




Abstract
Objective:
Electroencephalographic (EEG) neurofeedback (NF) is considered a nonpharmacological alternative for medication in attention-deficit/hyperactivity disorder (ADHD). Comparisons of the behavioral efficacy of NF and medication have produced inconsistent results. EEG measures can provide insight into treatment mechanisms, but have received little consideration. In this randomized controlled trial (RCT), effects of NF were compared with methylphenidate (MPH), and physical activity (PA) in children with ADHD on event-related potential (ERP) indices of response inhibition, which are involved in ADHD psychopathology.
Methods:
Using a multicenter three way parallel group RCT design, 112 children with a Diagnostic and Statistical Manual of Mental Disorders, 4th ed. (DSM-IV) (American Psychiatric Association 1994) diagnosis of ADHD, between 7 and 13 years of age, were initially included. NF training consisted of 30 sessions of theta/beta training at Cz over a 10 week period. PA training was a semiactive control group, matched in frequency and duration. MPH was titrated using a double-blind placebo controlled procedure in 6 weeks, followed by a stable dose for 4 weeks. ERP measures of response inhibition, N2 and P3, were available for 81 children at pre- and postintervention (n = 32 NF, n = 25 MPH, n = 24 PA).
Results:
Only the medication group showed a specific increase in P3 amplitude compared with NF (partial eta-squared [ηp 2 ] = 0.121) and PA (ηp 2 = 0.283), which was related to improved response inhibition. Source localization of medication effects on P3 amplitude indicated increased activation primarily in thalamic and striatal nuclei.
Conclusions:
This is the first study that simultaneously compared NF with stimulant treatment and a semiactive control group. Only stimulant treatment demonstrated specific improvements in brain function related to response inhibition. These results are in line with recent doubts on the efficacy and specificity of NF as treatment for ADHD.
Clinical Trials Registration:
Train Your Brain? Exercise and Neurofeedback Intervention for ADHD,
Introduction
A
NF aims to reduce abnormal brain activity by operant conditioning of desired brain states. Although several protocols exist, EEG training of theta/beta and/or sensorimotor rhythm (SMR) activity is used in the majority of studies (Loo and Makeig 2012). This protocol is based on the observation of increased slow wave activity (theta: 4–8 Hz) and decreased fast wave activity (beta: 13–21 Hz) in the spontaneous EEG of children with ADHD (Snyder and Hall 2006). The efficacy of NF in ADHD is still debated, with conclusions of systematic reviews ranging from NF having nonsignificant effects as measured by probably blinded assessment (Sonuga-Barke et al. 2013) to NF being effective and specific (Arns et al. 2009).
Event related potential (ERP) measurements provide a means to study the effects of NF on brain functioning. Dysfunctional response inhibition is seen as one of the core neurocognitive problems in ADHD (Barkley 1997), and is, therefore, an important treatment outcome. Because NF targets brain activity directly, changes in neurocognitive functioning may accompany treatment-related changes in brain activity. The N2 and P3 components in ERP studies have been associated with the inhibition process (van Boxtel et al. 2001; Ramautar et al. 2004), and have consistently been found to be reduced in amplitude in children with ADHD (Johnstone et al. 2013). Effects of NF on ERPs obtained in inhibition tasks are mixed, with evidence for increased P3 for children who were able to increase relative beta activity (Kropotov et al. 2007) or no P3 increase (Ogrim and Hestad 2013). Although ERP studies are scarce and inconsistent, some evidence indicates that NF may exert effects on a key deficit of response inhibition in children with ADHD.
Methylphenidate (MPH) is the most widely prescribed medication for ADHD and has been shown to ameliorate not only ADHD symptomology, but also neurocognitive deficits (Coghill et al. 2013), including deficits in inhibitory control. ERP studies found evidence for acute enhancing effects of MPH on N2 and/or P3 amplitudes during inhibition tasks (Seifert et al. 2003; Pliszka et al. 2007; Groom et al. 2010; Paul-Jordanov et al. 2010). Possibly, MPH acts on dopamine transmission in striatal nuclei and associated cortical structures (Rosa-Neto et al. 2005), which are involved in response inhibition deficits in ADHD (Hart et al. 2013), resulting in enhanced N2/P3 signals. Direct comparisons of NF and stimulant medication in children with ADHD have produced inconsistent clinical results, with studies showing comparable efficacy (Duric et al. 2012; Meisel et al. 2013) or superior effects for medication (Ogrim and Hestad 2013). Only the study of Ogrim et al. (2013) examined ERPs, and found increased P3 amplitudes in 8 medication responders as opposed to 4 medication nonresponders, and 11 children receiving NF.
Physical activity (PA) could be another treatment approach for ADHD that utilizes protective effects of exercise on brain functioning (Rommel et al. 2013). However, evidence for beneficial effects of chronic exercise in children with ADHD is scarce and has yet to be established in randomized controlled trials (RCT) (Halperin et al. 2014). In the current study, PA was applied to a semiactive control group to control for nonspecific treatment effects such as parental engagement and personal attention. Therefore, NF and PA training were matched in frequency and duration.
In the current RCT, we compared the effects of NF, stimulant medication with MPH, and PA on ERP indices of response inhibition in children with ADHD, to further elucidate possible treatment mechanisms of NF and MPH. Our aims were threefold: 1) To compare NF with optimally titrated MPH, 2) to compare NF with PA in a semiactive control group, and 3) to anatomically localize treatment effects to gain insights into the involved neural networks.
Methods
Participants
Eligible participants were Dutch-speaking children, between 7 and 13 years old, with a primary clinical Diagnostic and Statistical Manual of Mental Disorders, 4th ed., Text Revision (DSM-IV-TR) diagnosis of ADHD (American Psychiatric Association 2000). Parent and teacher ratings on the Disruptive Behavior Disorders Rating Scale (DBDRS) (Pelham et al. 1992) required at least one of the scores on the Inattention or Hyperactivity/Impulsivity scales to be above the 90th percentile for one of the informants, and the other to be above the 70th percentile for the other informant. At study entry, all children had been stimulant free for at least 1 month. Exclusion criteria were neurological disorders and an estimated intelligence quotient (IQ) <80 on the abbreviated version of the Wechsler Intelligence Scale for Children (WISC-III) (Wechsler 1991), using subtests Vocabulary, Arithmetic, Block Design, and Picture Arrangement.
Initially, 112 children with ADHD were randomized over the three interventions: NF (n = 39), MPH (n = 36) and PA (n = 37). A total of 103 children completed the study. Nine children dropped out for motivational (n = 1) or practical reasons (n = 6) or for medical contraindications (n = 2, MPH group only). The dropout rate did not differ for NF (n = 1[2.6%]), MPH (n = 5[13.9%]), and PA (n = 3[8.1%]), p = 0.164. The Consolidated Standards of Reporting Trials (CONSORT) flow diagram is presented in Figure 1.
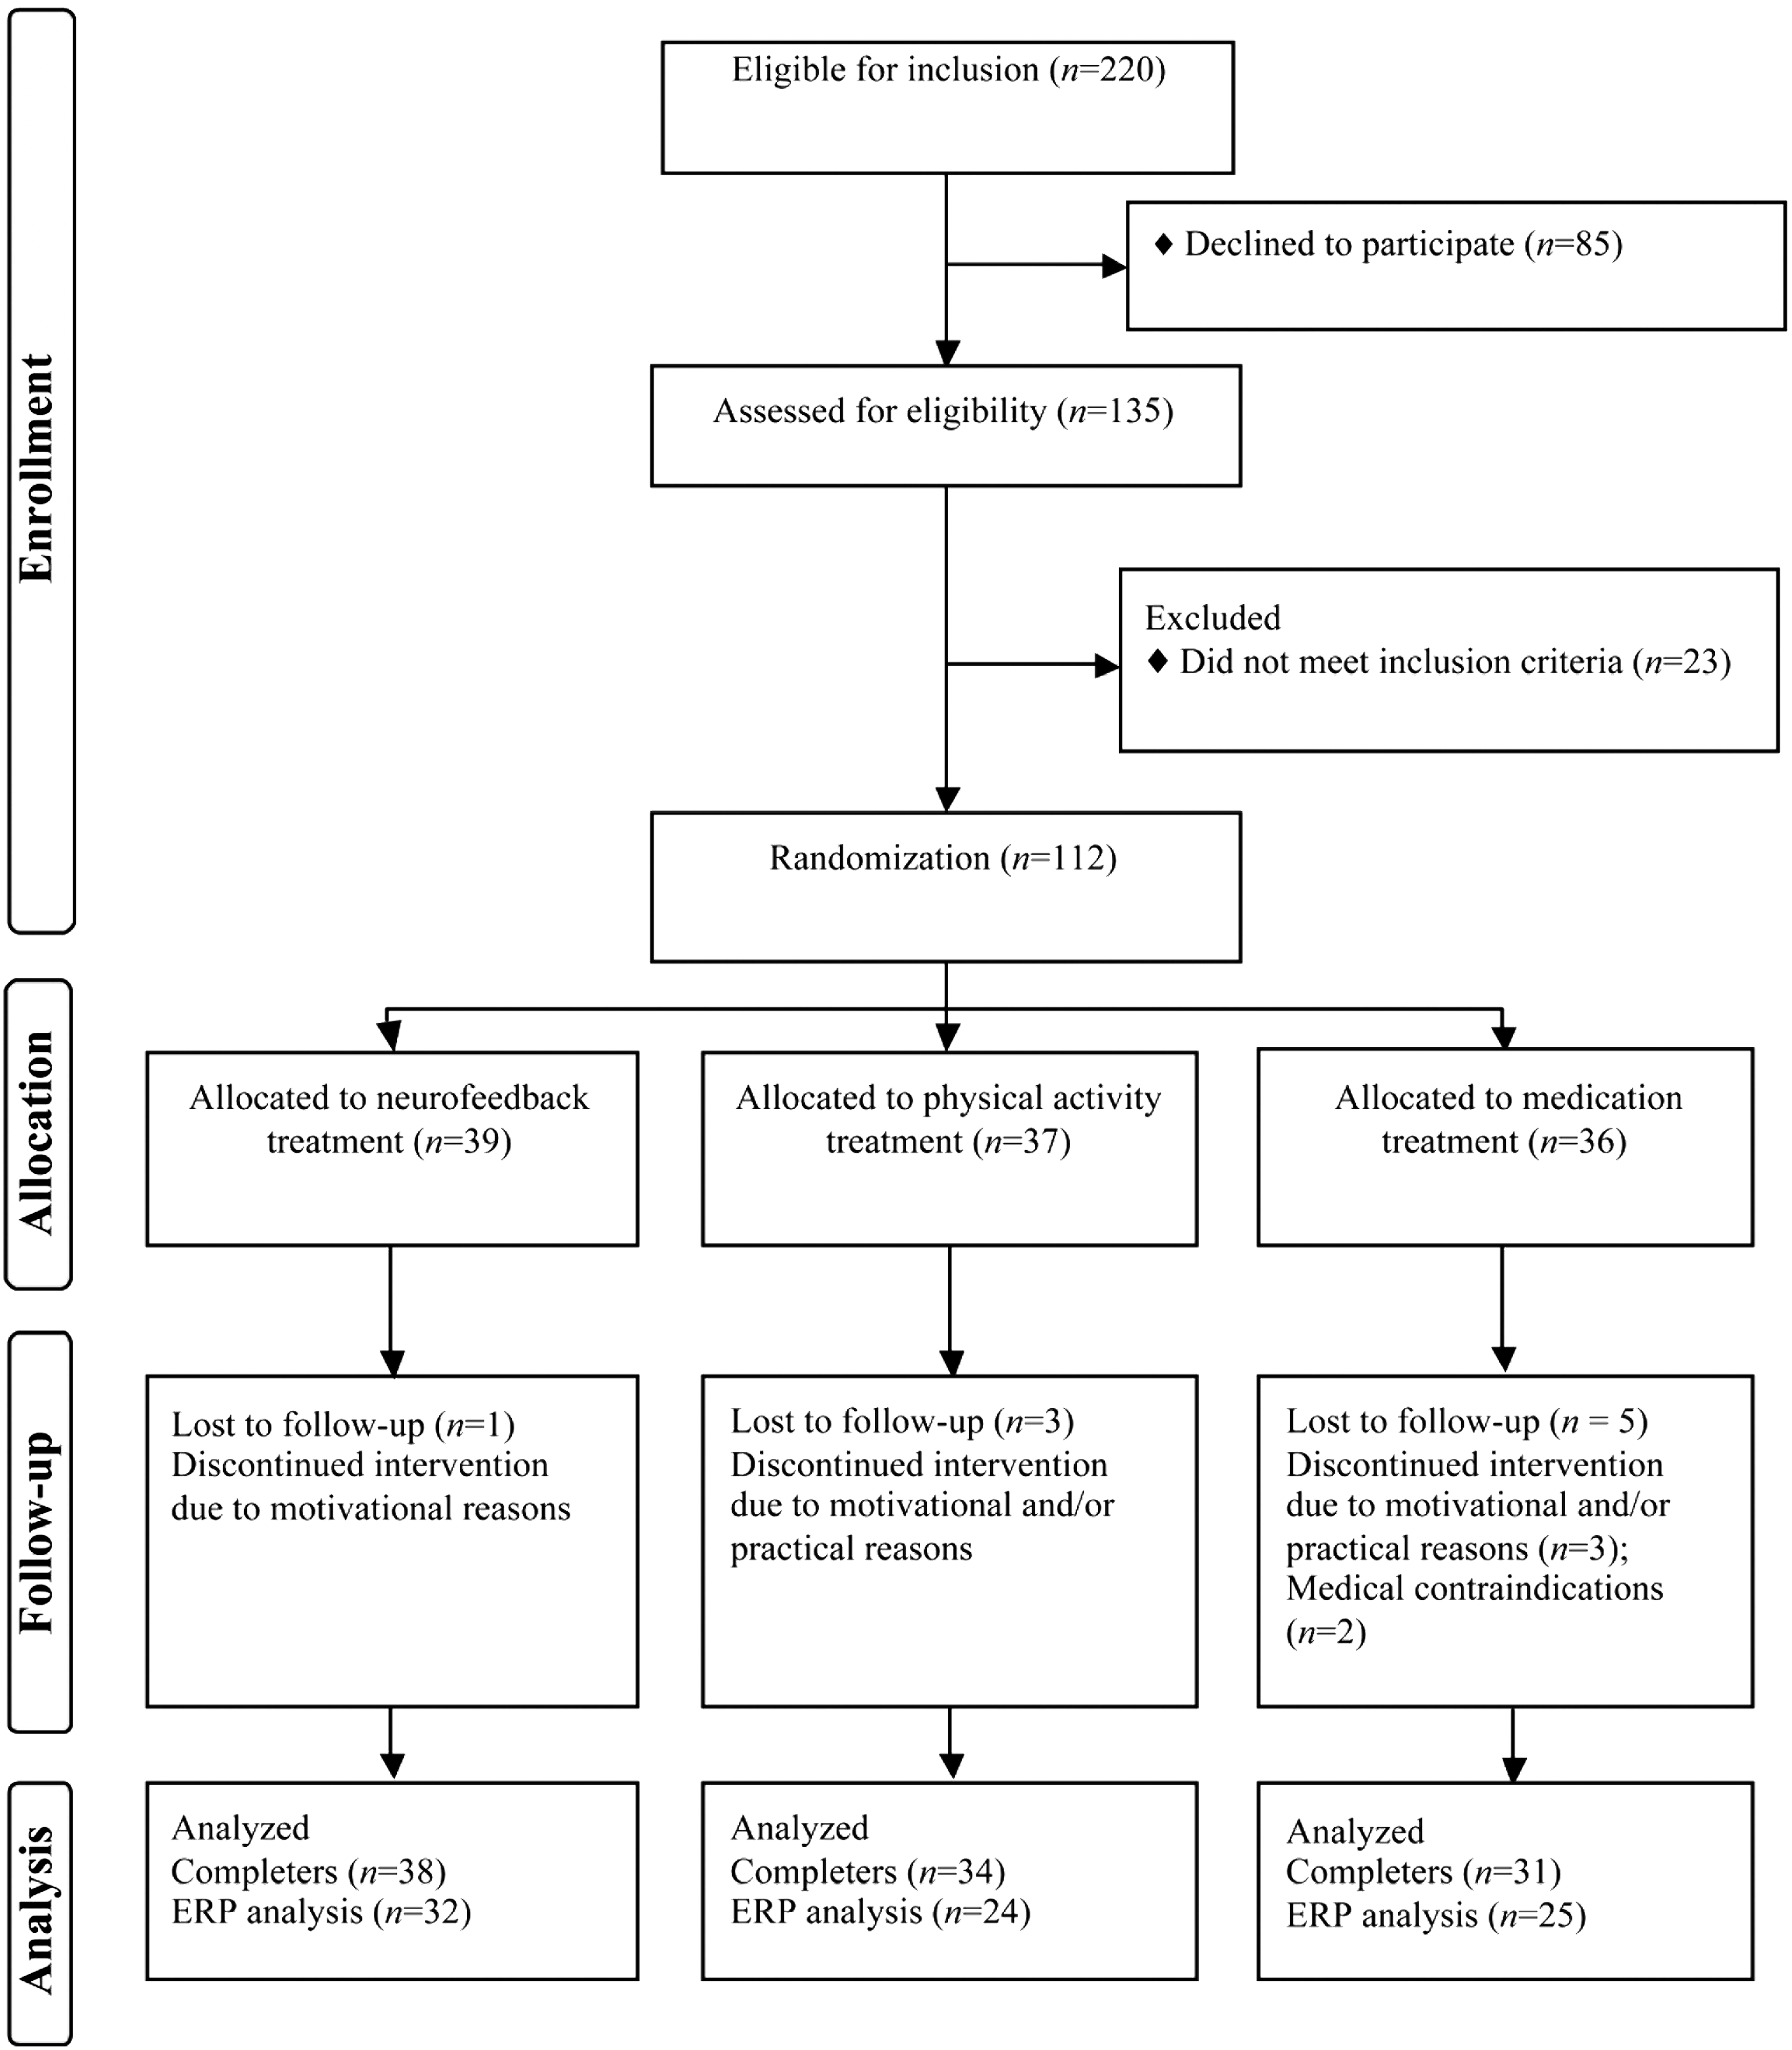
Flow diagram randomized controlled trial.
Trial design
A multicenter three way parallel group study with balanced randomization was conducted. Randomization was established using a computerized random number generator (Dallal 2007). Stocks of nine unmarked sealed envelopes were presented to parents at intake by the lead investigators. Parents randomly picked an envelope revealing treatment allocation.
For three groups, a total sample size of 66 (i.e., 22 per group) was calculated (by G*power version 3.1.5 (Faul et al. 2007) to be sufficient to detect a medium effect size (f = 0.25) in a repeated measures (RM) analysis of variance (ANOVA) with an α of 0.05 and a power of 95%. In the case of two groups, a total sample size of 54 (i.e., 27 per group) was calculated to detect a medium effect size (f = 0.25) in an RM ANOVA with an α of 0.05 and a power of 95%. This trial is registered in the United States trial register (Ref. No. NCT01363544).
Interventions
NF and PA treatment comprised three individual training sessions a week, over a period of ∼10 weeks. One training session lasted 45 minutes, with 20 minutes of effective training.
NF
Theta/beta training was applied with the aim of inhibiting theta (4–8 Hz) and reinforcing beta (13–20 Hz) activity at Cz. The THERAPRAX® EEG Biofeedback system (Neuroconn GmbH, Germany) with a DC amplifier and a sampling rate of 128 Hz was used to transmit and analyze the EEG signal. Reference and ground electrodes were attached to right and left mastoids respectively. Electrooculogram (EOG) was obtained with two electrodes at the external canthi, and two electrodes at the infra- and supraorbital sides. Ocular correction was applied as described in Schlegelmilch et al. (2004). Subsequently, theta/beta index [theta(μV/Hz)-beta(μV/Hz)/theta(μV/Hz)+beta(μV/Hz)] was computed with a short-time Fourier transform moving average for direct feedback.
The mean number of training sessions of participants who completed the assessments at postintervention (n = 38) was 29 (mean = 28.53, SD = 2.63, range between 19 and 30). Each training session started with a 1 minute baseline theta/beta index measurement, followed by 10 runs of NF. Each run comprised four 30 second epochs. The theta/beta index was represented to the participant by simple graphics on a screen. Successful reduction of the theta/beta index, as averaged over one epoch relative to the baseline, was rewarded with the appearance of a sun, and granted with credits. The first run of the first training started on a training level with the aim of reducing the theta/beta index by 3%. The training level increased or decreased based on performance of former runs, and could range between 3% and 52%, relative to training session baseline, over the total treatment period of 10 weeks. Higher training levels were rewarded with more credits.
Transfer trials without immediate visual feedback were included from session 11 (25%) and session 21 (50%) onwards. To further transfer learned behaviors, participants were instructed to retrieve their NF experiences by watching printed graphics of the training during school and homework. Compliance was verified by questioning the participants whether they used the transfer cards over the intervention period. Transfer cards were used by 84% of the participants.
Medication
A 4 week double-blind randomized placebo-controlled titration was used to determine the optimal individual dose of short-acting MPH. The titration was preceded by a baseline week to determine ADHD symptoms without MPH, followed by a lead-in week in which on 3 consecutive days, twice daily (at breakfast and lunch time) doses of 5 mg, 10 mg, and 15 mg (< 25 kg body weight) or 20 mg (>25 kg body weight) MPH were used to assess adverse effects. During the titration phase, children received in a pseudo-random order each of the three doses of MPH or placebo for 1 week, twice daily. At the end of each week, parents and teacher were asked to evaluate inattention and hyperactivity/impulsivity symptoms on the DBDRS, and adverse effects on the Multimodal Treatment Study of Children with ADHD (MTA) Side Effect Rating Scale (Greenhill et al., 1996). A standardized procedure (Greenhill et al. 1999) was used to classify children as responders (n = 29), or nonresponders (n = 2). Both nonresponders were treated with 5 mg MPH twice daily. The child's psychiatrist prescribed the twice-daily optimal dose for the remaining intervention period for responders (5 mg to 10 [8 responders and 2 nonresponders], 10 mg to 14, 15 mg to 2, and 20 mg to 5 children).
PA
Maximum heart rate (HRmax) was determined before the start of the first training session. The mean number of completed training sessions was 27 (27.74 ± 3.56), with a minimum of 12 sessions. Each training session started with 5 minutes of warming up followed by five 2 minute exercises at a level of 70–80% of HRmax. After a 5 minute break, five 2 minute exercises at 80–100% of HRmax were performed. The training finished with a 5 minute cool down. Time and heart rate were monitored and registered using POLAR (model FTM4).
Stimuli and task
The stop-signal task (SST) involved two types of stimuli: Go stimuli and stop stimuli. Go stimuli were left- or right-pointing airplanes requiring either a left or right button response. In a randomly selected 25% of the trials, go stimuli were followed by a visual stop signal (traffic stop sign) superimposed on the go stimulus, requiring the participants to withhold their response. The delay between the go and stop signal (SSD) varied trial by trial using a tracking algorithm that increased or decreased the delay by 50 ms, depending upon whether or not the previous stop trial resulted in successful inhibition. This procedure yielded ∼50% successful inhibitions (SI) and 50% failed inhibitions (FI). The SST has been more extensively described in Janssen et al. (2015).
Electrophysiological recordings
Continuous EEG was recorded at 512 Hz using the ActiveTwo Biosemi system and ActiView software (Biosemi, Amsterdam, The Netherlands) from 128 scalp electrodes according to the ABC labeling system, referenced to the active common mode, and grounded to the passive driven right leg, which functions as a feedback loop to drive average potentials across electrodes to the amplifier zero. The EOG was obtained using two electrodes at the external canthi, and two electrodes at the infra- and supraorbital sides. Reference electrodes were placed at both mastoids.
Off-line analysis was performed with Brain Vision Analyzer 2 software (Brain Products, Gilching, Germany). A band-pass filter of 0.1–30 Hz at 24 dB/oct and a 50 Hz notch filter were applied, and scalp electrodes were re-referenced to the average of the mastoids. Ocular artifacts were estimated and corrected with a semiautomatic independent component analysis (ICA) using a restricted infomax algorithm (Jung et al. 2000), and automatic artifact rejection was applied to segments based on the following criteria: Maximum allowed voltage step of 50 μV/ms, maximal peak-to-peak amplitude difference of ±100 μV, and minimal low activity of 0.50 μV for 100 ms intervals. Broken electrodes were interpolated with the spherical splines method (Perrin et al. 1989).
Correct go trials were segmented from 700 ms prestimulus to 1700 ms poststimulus and were baseline-corrected for the interval −700 ms to −500 ms; this interval precedes the fixation cross during the presentation of a blank screen between trials. Both SI and FI trials were first segmented at the preceding go stimulus using an equal interval and baseline correction as previously described. Because of the adjacency between go and stop stimuli, go and stop responses in the EEG overlap. We corrected for this with ADJAR (Woldorff 1993), which filters out overlap of previous go responses, using the correct go ERP. After this correction, trials were segmented from −100 ms to 800 ms relative to the stop stimulus. Subsequently, a 100 ms prestimulus baseline was applied, and averages were obtained for SI and FI. Grand average ERPs, scalp topographies, and difference waves for SI and FI were inspected to define analysis windows for N2 (215–265 ms) and P3 (300–400 ms). Mean voltage amplitudes of midline electrodes, Fz, Cz, and Pz, were used for statistical analyses.
LAURA source estimation
Sources underlying specific treatment effects were estimated for each time window using the LAURA distributed linear inverse solution method (Grave de Peralta Menendez et al. 2001, 2004; Michel et al. 2004). The analysis was performed using the Cartool software by Denis Brunet (
Procedure
The study was approved by the national medical ethics committee, the central committee on research involving human subjects (NL 31641.029.10 CCMO). Written informed consent was obtained before participation from parents and children ≥11 years of age. Children were recruited through mental health outpatient facilities in the west of the Netherlands.
Pre- and postintervention measures included behavioral questionnaires, neuropsychological tasks, and electroencephalogram. Preintervention assessment took place in the week prior to the start of the intervention. Postintervention assessment took place ∼1 week after the last training. The MPH group continued use of medication up to postintervention. Interventions took place between September 2010 and March 2014.
Nine children were dropouts for motivational/practical reasons (NF = 1, PA = 3, MPH = 5 [2 medical contraindications]) (see Fig. 1). The remaining missing data (n = 22) were mostly missing for technical reasons at baseline (n = 14) or postintervention (n = 8). At baseline (T0), 12 measurements were excluded for technical problems (e.g., missing markers, disconnected reference [n = 8] or insufficient data quality [n = 4]), and 2 measurements were excluded because of extremely poor task performance (adopting an incorrect strategy of always responding to stop signals or excessively waiting for the stop signal on all trials). At postintervention (T1), five measurements were excluded for technical problems (e.g., missing markers, disconnected reference [n = 2] or insufficient data quality [n = 3]), and three measurements were excluded because of extremely poor task performance.
Statistics
Statistical analyses were performed with SPSS 20 (IBM Corporation 2011). Significance was assumed if p < 0.05. Demographic and performance data were compared between groups with one way ANOVA or a χ2 test with Fisher exact correction. Significant group effects were further explored with pairwise group comparisons to locate group differences. Attrition analysis was performed with ANOVA by comparing the total randomized sample with the ERP subsample (available ERP data at T0 and T1) on group characteristics, and by exploring possible interactions with treatment group.
General linear model (GLM) multivariate analyses of variance (MANOVAs) were used for the primary ERP measures with time (preintervention [T0], and postintervention [T1]), condition (SI and FI) and location (Fz, Cz, Pz) as within-subject factors, and treatment group as between-subject factor. Significant interactions involving group were further explored with separate post-hoc GLM MANOVAs for each pair of treatments. ERP effects were evaluated using multivariate test criteria, because it is more robust in cases of violations of sphericity (Vasey and Thayer 1987). Only time effects and interactions with group are reported. For the main outcomes, mean difference and 95% confidence interval (CI) are reported. Effect sizes are reported as partial eta-squared (ηp 2), with effects interpreted as small (0.01), medium (0.06), or large (0.14).
Pearson correlations were computed between ERP component amplitudes at baseline and stop-signal reaction time (SSRT) and between treatment accompanied amplitude changes (T1-T0) and SSRT changes. To reduce the number of correlations, and to avoid potential effects of manual responses (button press) during FI, only ERPs at Cz during SI were considered. If time and treatment group interacted in the main analyses, correlations with SSRT were calculated for treatment groups separately. To test if correlation coefficients were different between groups, Fisher's r-to-z transformation was used, and z scores were compared as described in Cohen et al. (2003).
For the LAURA estimations, treatment effects were tested with paired t tests for each node. Significance was assumed if p < 0.01. Coordinates were converted from MNI to Talairach space with the icbm2tal algorithm (Lancaster et al. 2007) using GingerALE software (Laird et al. 2005).
Results
Group characteristics
At T0 there were no differences between the treatment groups in age, IQ, gender, symptom severity, or task performance (see Table 1). Further, treatment groups did not differ in ERP measures at T0 (all p > 0.05).
χ2(2).
NF, neurofeedback; MPH, methylphenidate; PA, physical activity; IQ, intelligence quotient; DBDRS, Disruptive Behavior Disorders Rating Scale; SSRT, stop-signal reaction time; MRT, mean reaction time on correct Go trials; CV, coefficient of variation.
Number of artifact-free segments at T0 did not differ between groups for SI trials (mean = 65, F[2,78] = 1.53, p = 0.223), and FI trials (mean = 51, F[2,78] = 0.52, p = 0.598). At T1, groups did not differ on number of segments for FI (mean = 52, F[2,78] = 0.62, p = 0.540); however, for SI, the medication group had more segments than the PA group (NF = 67, PA = 62, MPH = 72) (F[1,47] = 7.84, p = 0.007).
Attrition analysis
There were no differences in group characteristics between children contributing data to the current study and the total randomized group, nor were there any interactions with treatment group.
ERP results
Mean amplitudes of the ERP components for each location, condition, and treatment group for T0 and T1, and MANOVA results are shown in Table 2. Waveforms are shown in Figure 2.
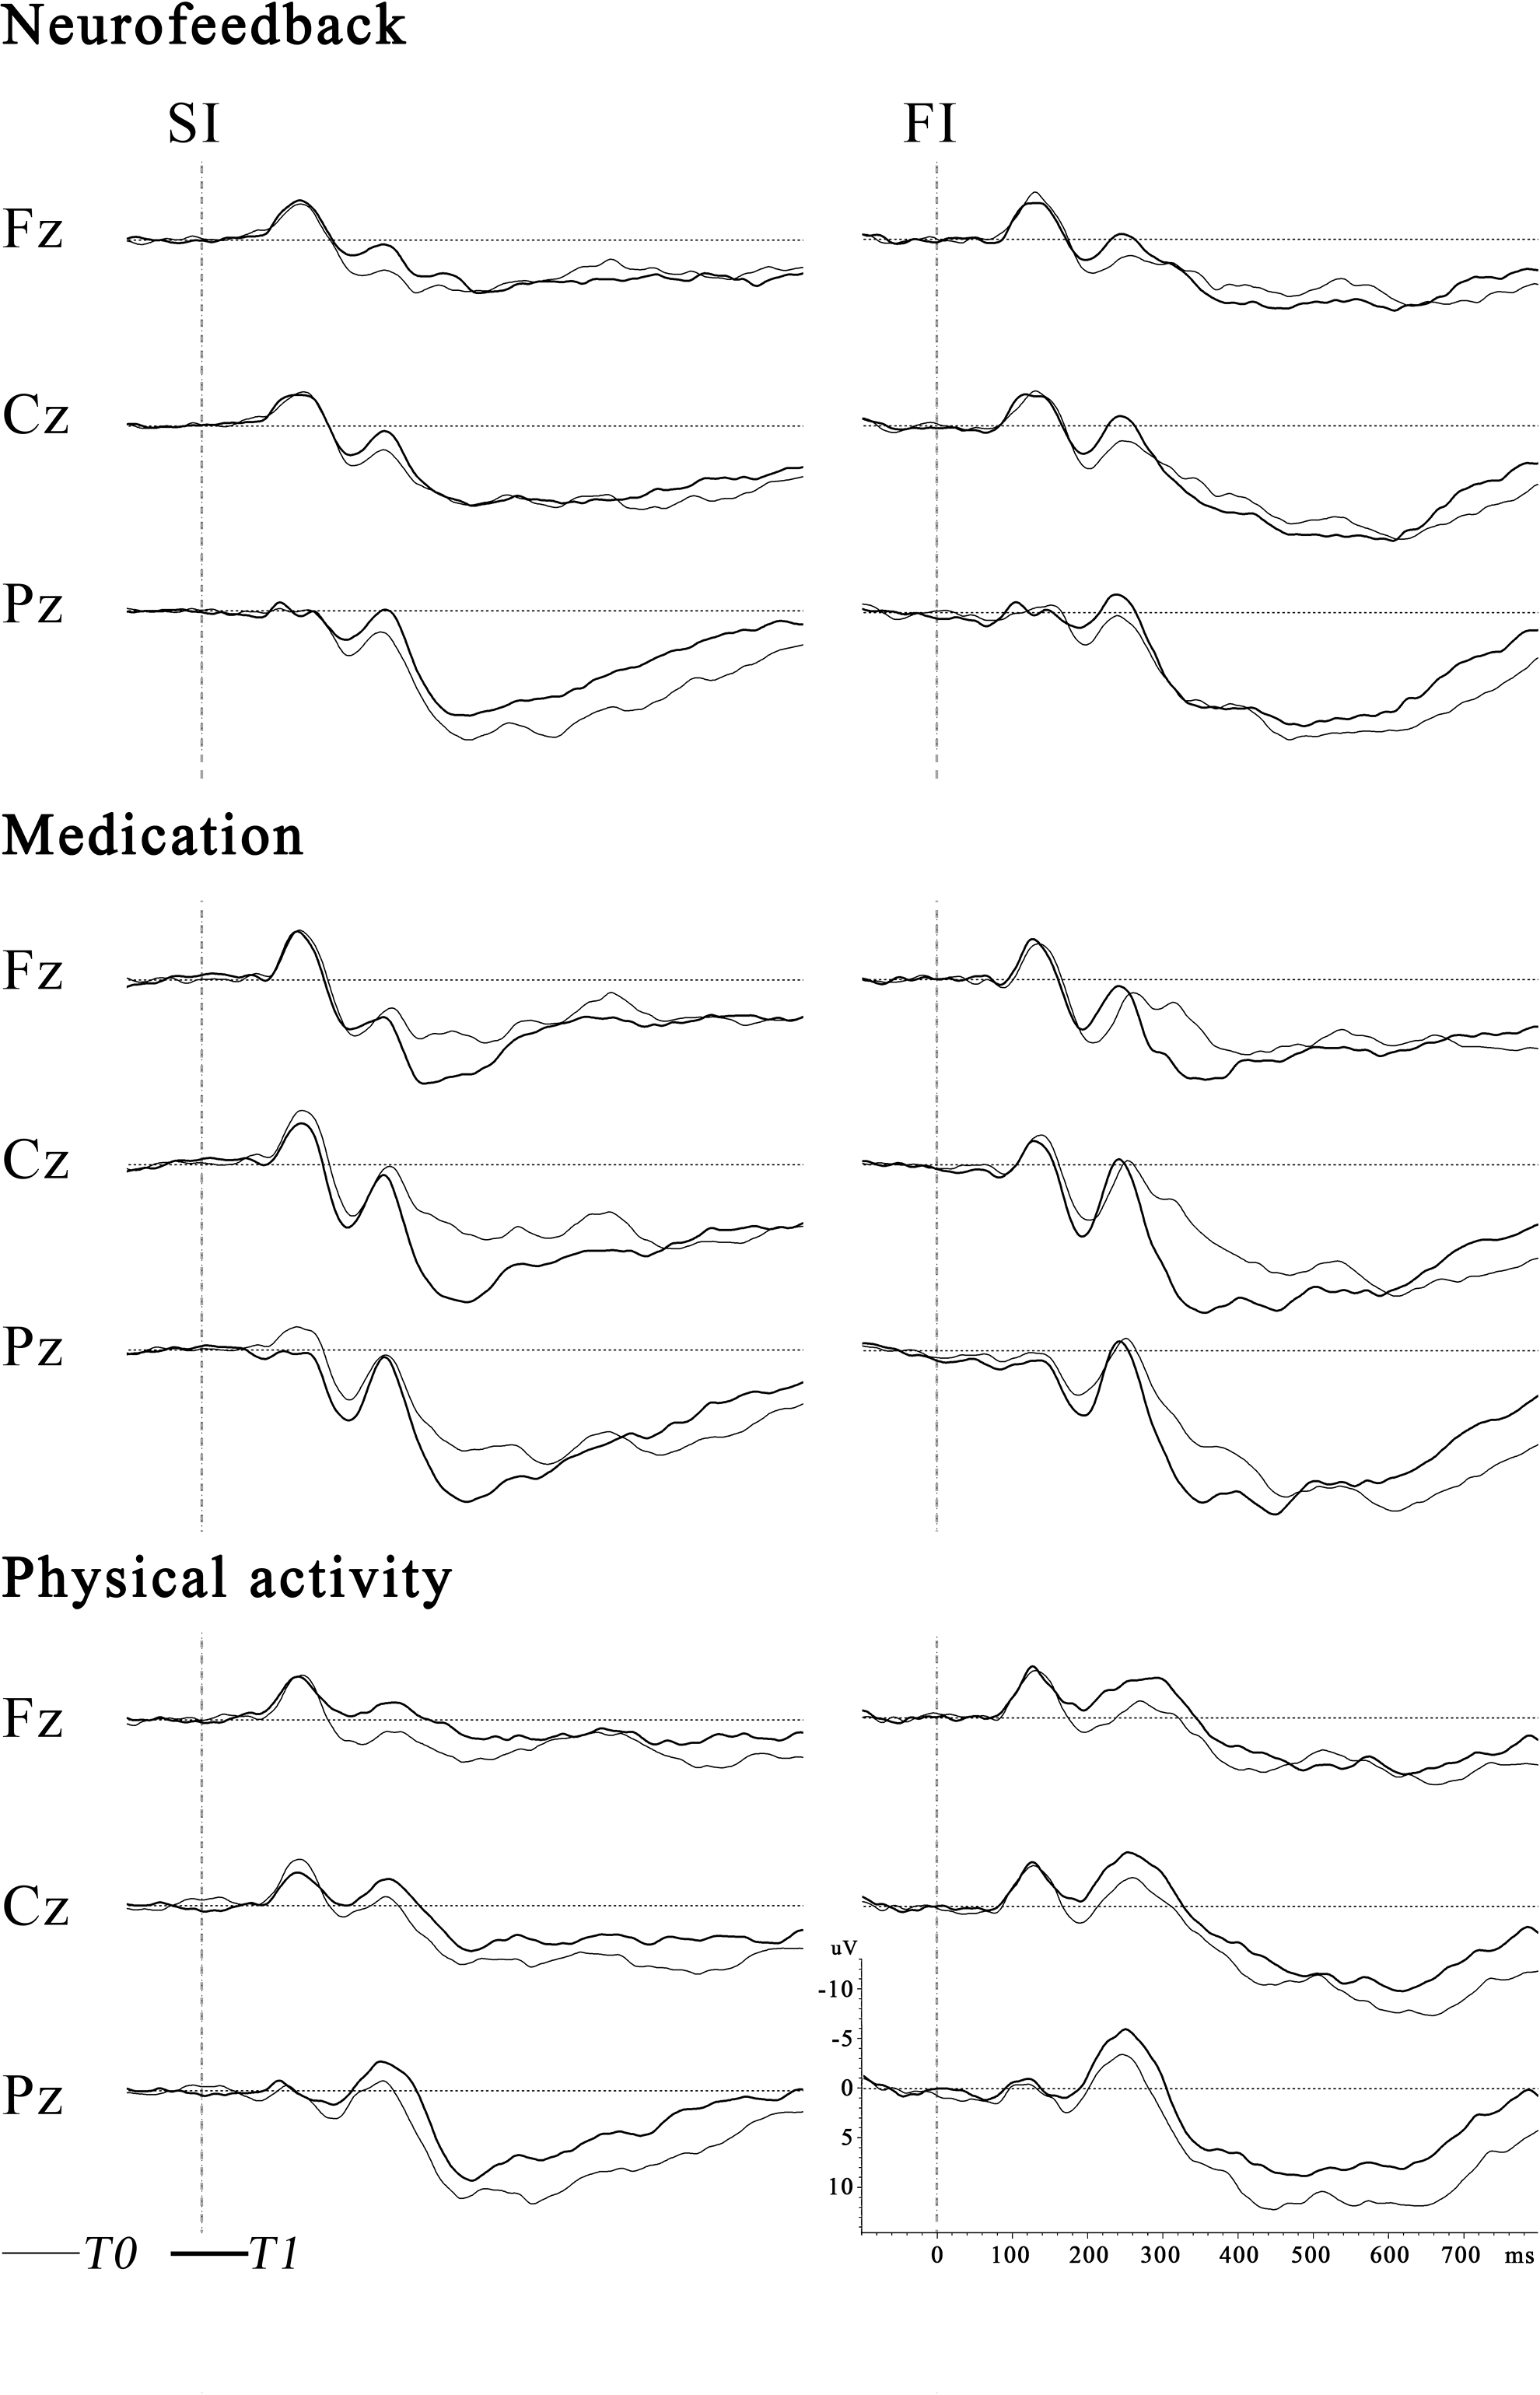
Grand average of event-related potential (ERPs) at T0 and T1 for the neurofeedback, methylphenidate, and physical activity groups, for successful inhibition (SI) and failed inhibition (FI) at midline electrodes.
p < 0.01, *** p < 0.001; data presented are mean(SD) in μV.
GLM, general linear model; MANOVA, multivariate analysis of variance; ERP, event-related potential; SI, successful inhibition,; FI, failed inhibition; T, time from preintervention (T0) to postintervention (T1); G, group (NF, MPH, or PA); C, condition (SI or FI); L, location (Fz, Cz, or Pz); NF, neurofeedback; MPH, methylphenidate; PA, physical activity.
N2 (215–265 ms)
A medium to large sized main effect for time was found, indicating larger N2 amplitudes at postintervention than preintervention.
P3 (300–400 ms)
Time and group interacted. Post-hoc analysis showed a larger P3 amplitude increase from pre- to postintervention for MPH than for NF (F[1,55] = 7.58, p = 0.008, ηp 2 = 0.121, mean difference(MPH-NF) = 5.29, 95% CI = [1.44,9.15]), or PA (F[1,47] = 18.56, p ≤ 0.0001, ηp 2 = 0.283, mean difference(MPH-PA) = 7.38, 95% CI = [3.93,10.82]). NF and PA did not differ from each other between pre- and postintervention (F[1,54] = 1.24, p = 0.271, ηp 2 = 0.022, mean difference(NF-PA) = 2.08, 95% CI = [−1.67,5,83]).
LAURA source estimation results
The medication effects on P3 amplitude were further explored with LAURA source estimation. Figure 3 shows the statistical parametric maps of the within-group comparison of pre- and postintervention.
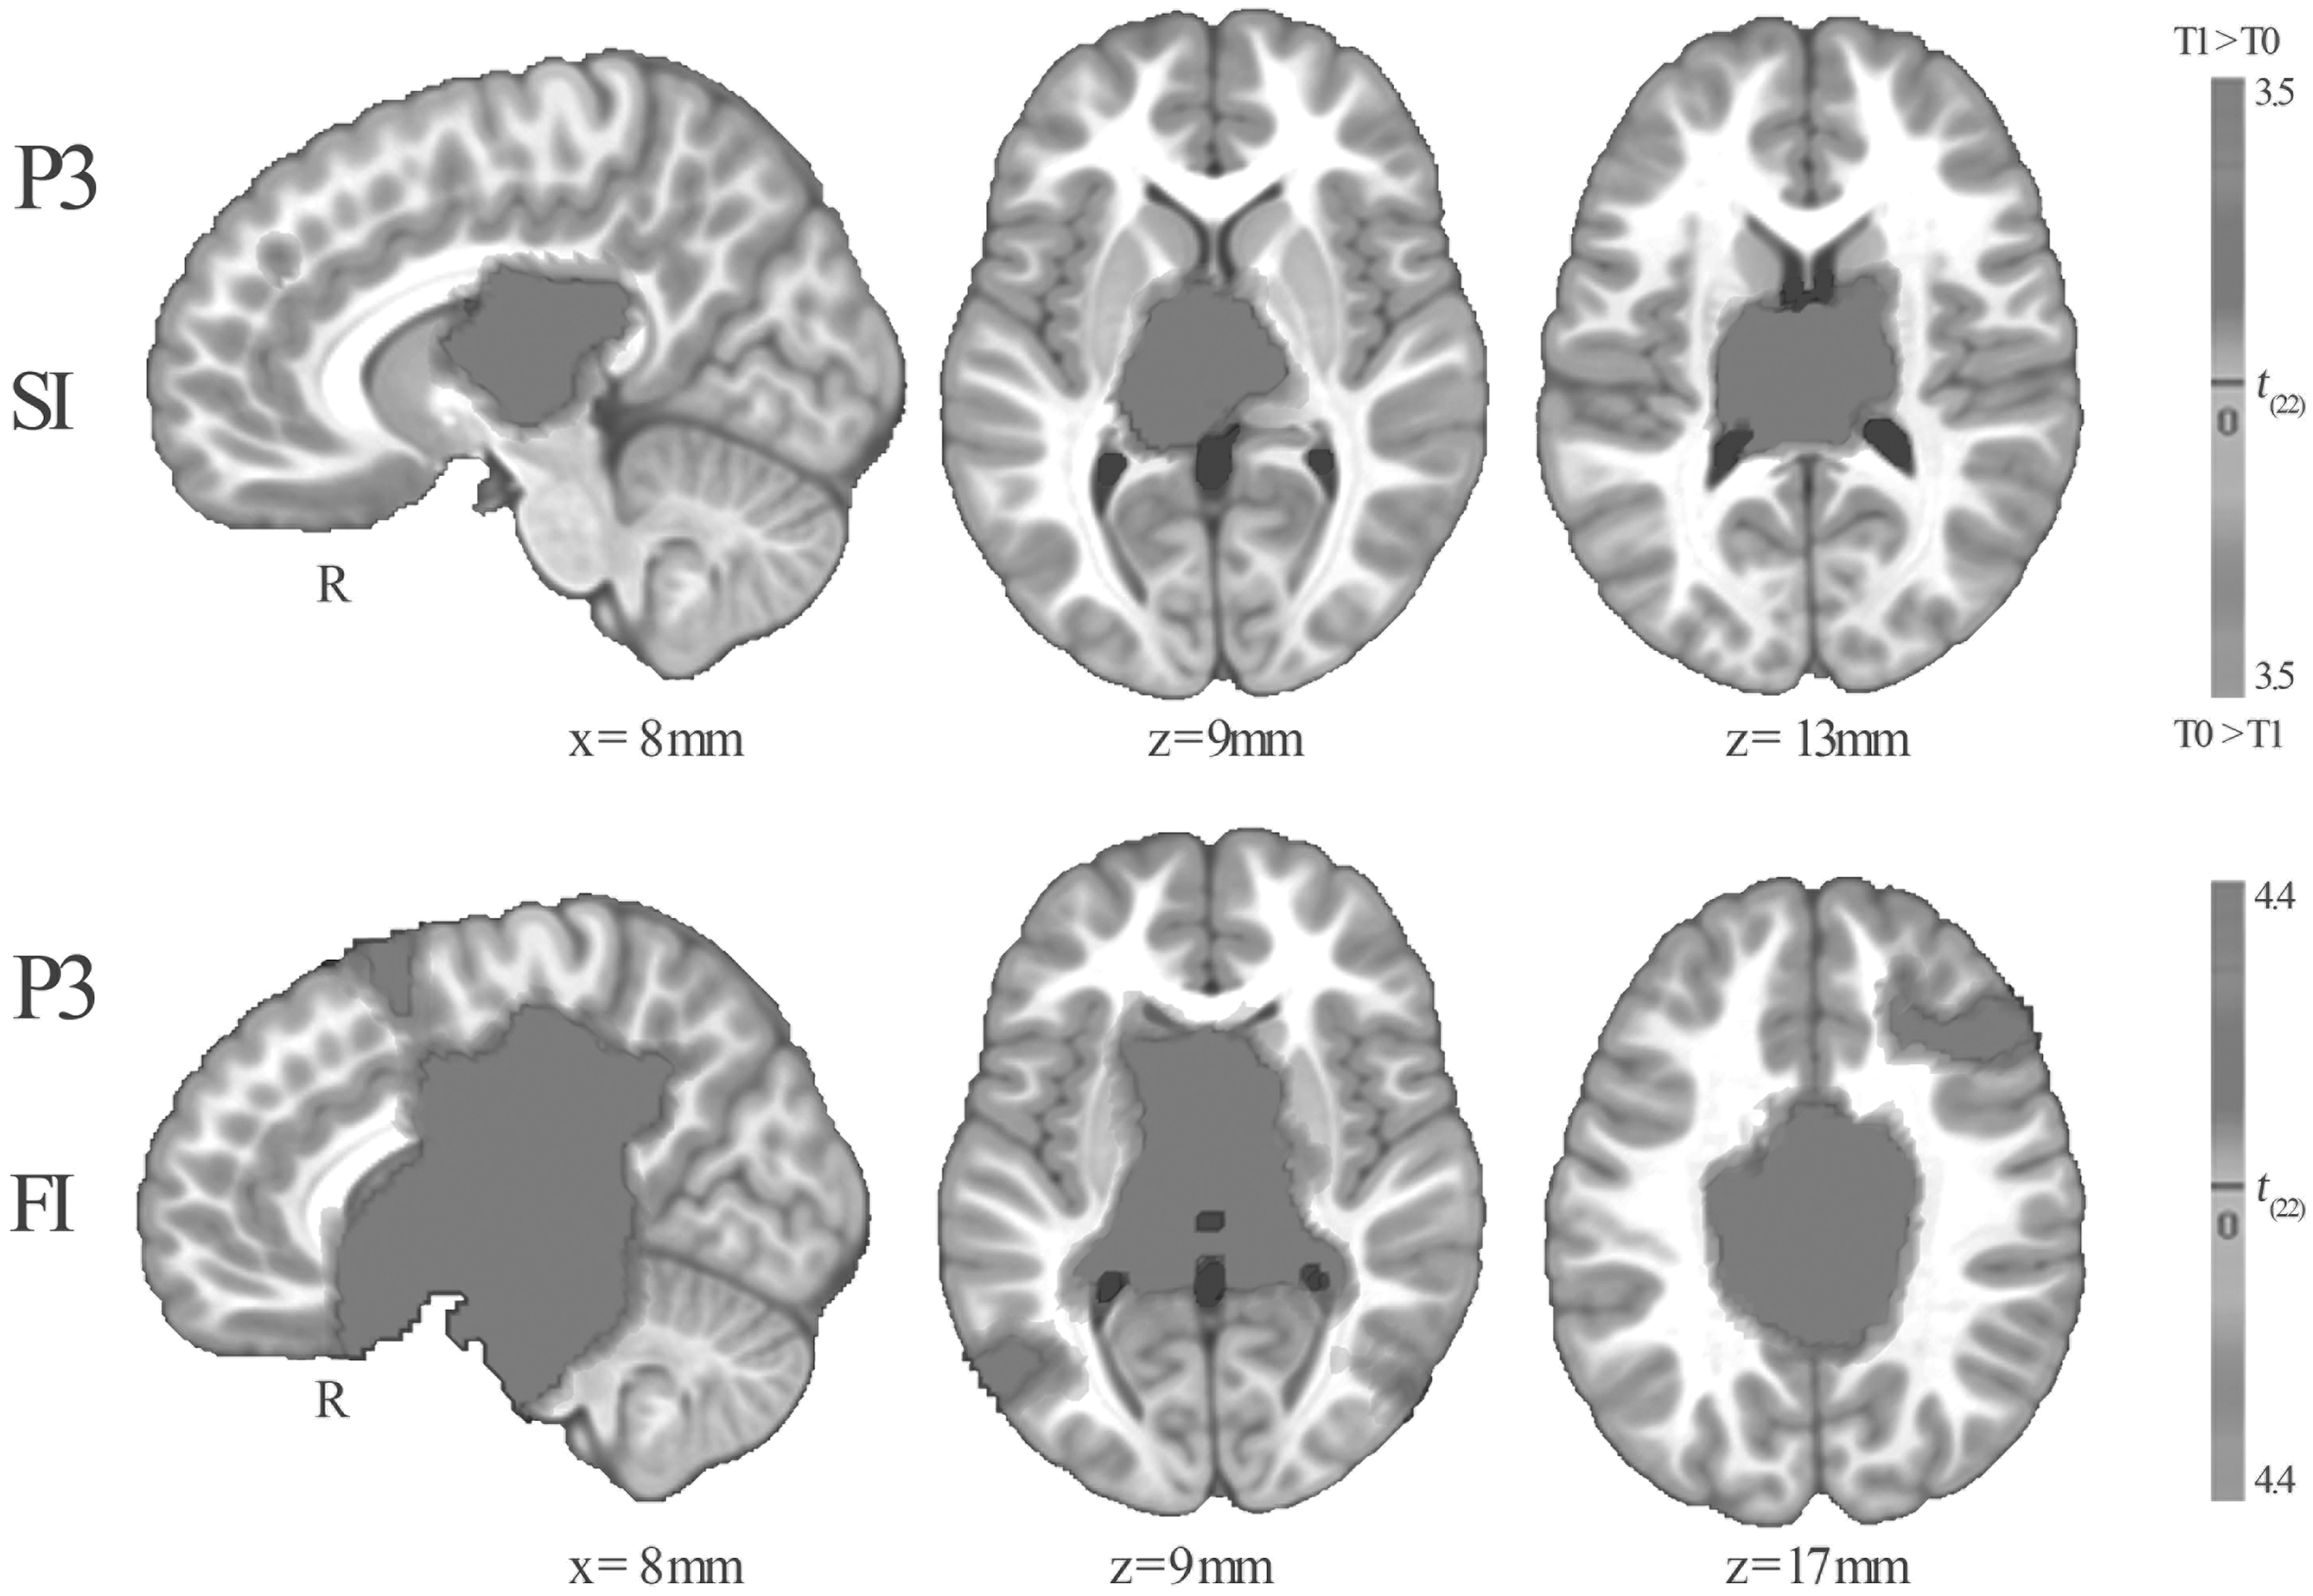
Significant medication effects on LAURA source estimations over the analysis window of P3 during successful inhibition (SI) and failed inhibition (FI), shown on a pediatric Montreal Neurological Institute (MNI) template brain. Illustrated coordinates were converted from MNI to Talairach space. Grayscale indicates the t values. Lower-bound significance threshold is p < 0.01. For viewing purposes, images were interpolated with the 4-nearest-neighbor (4NN) method.
During SI, increased activation at postintervention was found in the bilateral thalamus and caudate nuclei. During FI, a more extended increase in activation at postintervention was found in bilateral thalamus, caudate and lentiform nuclei, and parahippocampal and medial frontal gyri.
Correlations
Preintervention
N2 amplitude was not related to SSRT (r[79 ] = −0.086, p = 0.446). P3 amplitude and SSRT showed a strong negative correlation (r[79] = −0.566, p < 0.001, signifying larger P3 amplitudes in children with fast SSRTs, indicating better inhibition.
Intervention effects
For the total group, change in N2 amplitude (T1-T0) was weakly related to change in SSRT (T1-T0) (r[79] = −0.284, p = 0.010), with larger increases in N2 amplitudes associated with larger SSRT increases (worse inhibition). For the medication group, change in P3 amplitude and change in SSRT were strongly correlated (r[23] = −0.625, p < 0.001), indicating that children with greater P3 amplitude increases also had greater SSRT decreases (better inhibition). This relation was not found in the NF and PA groups (r[30] = −0.214, p = 0.240 and r[22] = −0.171, p = 0.425, respectively). Furthermore, the correlation for the medication group was significantly stronger than for the NF (z = 1.82, p = 0.034 [one sided]), and PA groups (z = 1.84, p = 0.033 [one sided]).
Discussion
The efficacy of NF as treatment for children with ADHD is still debated, and direct comparisons between neurofeedback and stimulant medication have produced inconsistent results (Duric et al. 2012; Meisel et al. 2013; Ogrim and Hestad 2013). Further, neural mechanisms underlying the behavioral effects of NF are yet unknown. EEG measures could provide a means to explore potential mechanisms of action. Therefore, this RCT compared the effects of NF, stimulant medication, and PA—as semiactive control group—on ERP indices of response inhibition. Dysfunctional response inhibition plays a key role in theoretical models of ADHD (Barkley 1997). The principal finding of this study was a specific increase in P3 amplitude with stimulant treatment, which reflected improved response inhibition. However, no specific effects were found for the NF intervention.
Although an N2 amplitude increase from pre- to postintervention was observed across groups, there was no evidence for specific treatment effects for NF or medication. Therefore, the N2 increase probably reflects practice or developmental effects. The N2 component in inhibition tasks has frequently been associated with the initiation of the inhibitory process (van Boxtel et al. 2001); however, this functional interpretation has received considerable competition from conflict monitoring theories (Enriquez-Geppert et al. 2010), which state that frequent (go trials) and infrequent (stop trials) responses compete and therefore result in conflict. Our results challenge the inhibition interpretation as well, as there was no relation between N2 and SSRT at baseline, as opposed to P3.
In contrast to the N2 findings, the medication group showed a specific increase in P3 amplitude from pre- to postintervention compared with the NF and PA groups. This result is in line with Ogrim et al. (2013), who showed superior P3 increases in medication responders compared with nonresponders and those receiving NF. It is worth noting that the study of Ogrim and colleagues is the only study that found superior behavioral effects for medication treatment compared with NF. Possibly, the double-blind medication management procedure that was used in one third of the participants, similarly to in the current study, resulted in more optimal doses and, therefore, greater clinical and electrophysiological effects. Although NF could be less effective in ameliorating neurophysiological deficits in ADHD than optimally titrated MPH, smaller-sized specific effects could potentially exist. However, direct comparisons between NF and PA, which were designed to control for nonspecific effects, could not establish evidence for this proposition. The absence of specific ERP effects for NF is in line with recent double-blind placebo-controlled trials (Arnold et al. 2013; van Dongen-Boomsma et al. 2013) that found no specific behavioral effects for NF compared with sham NF.
Correlational analyses and source localization of P3 effects provided further insights into the neuropharmacological mechanisms of MPH in children with ADHD. First, our results suggest that P3 is strongly related to SSRT, and, therefore, offers a physiological index of response inhibition. Further, the strong relation between larger increases in P3 amplitude and improved response inhibition (shorter SSRT) in the medication group shows that the effect of MPH is closely related to this inhibition mechanism. Source localization of P3 changes from pre- to postintervention indicated increased activation, primarily in thalamic and striatal (caudate and lentiform) nuclei, during SI and FI. Functional MRI (fMRI) studies show that these areas are under activated in children with ADHD during inhibition tasks (Hart et al. 2013) and positron emission tomography (PET) studies in adults with ADHD indicate lower D2/D3 dopamine receptor availability in the caudate (Volkow et al. 2009). The therapeutic action of MPH seems to concentrate on the striatum by inhibiting the reuptake of dopamine, and thereby increasing extracellular concentrations of dopamine (Rosa-Neto et al. 2005). In line with this putative mechanism, a metastudy by Hart et al. (2013) found that percentages of patients on long-term medication correlated with increased activation in the right caudate.
Limitations
The absence of specific ERP effects of theta/beta neurofeedback in this study should be considered in the context of possible limitations. First, although the neural mechanisms behind NF are yet unknown, physiological effects may be observed in other neurocognitive domains than response inhibition. One other study looked at ERP effects on an attention task, and found decreased P3 at postintervention for the children receiving NF as well as the control group (Wangler et al. 2011). However, the authors suggested that this effect may indicate task adaptation. Second, the effects of NF may be of a transitory nature and, therefore, not observable in a laboratory setting. Third, although the theta/beta ratio is increased in ADHD at the group level (Snyder and Hall 2006), several studies found considerable heterogeneity in power spectra measures within ADHD (Loo and Makeig 2012). The effects of NF may, therefore, be dependent upon etiological subtypes. Other research groups increasingly embrace the possibility that NF does not address a neural dysfunction, but rather enables learning of compensatory mechanisms (Gevensleben et al. 2012; Arns et al. 2014). Fourth, the analyzed sample is considerably smaller than the randomized sample (72%), for several reasons, such as dropouts (n = 9), technical issues/insufficient data quality or incorrect performance strategies at pre- or postintervention (n = 22). This accumulated in different, albeit nonsignificant, group sizes at follow-up. However, attrition analyses could not demonstrate differences in completers compared with the total randomized sample. Last, visually inspecting the ERP waveforms or mean voltage data may indicate other differences between groups, although these were nonsignificant in our analyses. Although groups may be equal, we cannot demonstrate this with conventional statistics and current group sizes. Otherwise, groups may differ, but large variation in ERP amplitudes, and small effect sizes, may have diminished statistical power.
Conclusions
In summary, the medication group showed a specific increase in P3 amplitude that was related to improved response inhibition; however, no specific ERP effects were found for theta/beta NF training. Our study is the first that simultaneously compared NF with a consistently employed double-blind medication management protocol – to objectively determine individual doses of MPH – and with a semiactive control group to control for nonspecific effects. An important clinical observation is that the type of medication protocol constitutes a major factor in treatment outcome, as has been demonstrated in earlier studies (MTA Cooperative Group 1999), and could potentially explain the disparate results of studies that compare NF with medication. In conclusion, this study showed specific and superior effects for medication treatment with MPH compared with theta/beta neurofeedback training on ERP indices of response inhibition. These findings are in accordance with the behavioral findings of the same RCT, and in line with recent doubts on the efficacy and specificity of theta/beta NF as treatment for ADHD.
Clinical Significance
The efficacy of NF in clinical practice is intensively debated by scholars and clinicians, and comparisons with stimulant medication have produced inconsistent results. Contributing to this discussion is the lack of a mechanistic explanation of how NF may ameliorate symptoms of ADHD. Evidence for such neural mechanisms could provide convincing evidence that the behavioral effects of NF are not (only) the result of nonspecific effects or reporter bias, but rather caused by specific effects of NF on brain functioning in children with ADHD. Despite uncertainties about the efficacy and specificity of NF, some clinicians may currently recommend expensive NF treatments to their clients. This study aimed to elucidate whether NF has specific effects on one of the core neurocognitive problems in ADHD, dysfunctional response inhibition, and herewith contributes to the discussion of whether NF treatment in ADHD induces more than nonspecific or reporter bias effects. The results of this study do not support the use of theta/beta NF as treatment for children with ADHD.
Footnotes
Acknowledgments
We thank all participating children and families for their contribution, as well as all research interns for their valuable support. Further, we thank the participating centers of child and adolescent psychiatry: ADHD behandelcentrum, Albert Schweitzer ziekenhuis, Alles Kits, GGZ Delfland, GGZ ingest, Groene Hart ziekenhuis, Groos Mentaal Beter Jong, Kinderpraktijk Zoetermeer, Lucertis, Maasstad ziekenhuis, PuntP, RIAGG Schiedam, and Yulius Academie. We are grateful for being able to use the Cartool software (
Disclosures
No competing financial interests exist.