
Abstract
Objective:
Neuroimaging and electrophysiological research have revealed a range of neural abnormalities in autism spectrum disorder (ASD), but a comprehensive understanding remains elusive. We utilized a novel methodology among individuals with ASD and matched controls, combining transcranial magnetic stimulation (TMS) with concurrent electroencephalogram (EEG) recording (TMS-EEG) to explore cortical function and connectivity in three sites implicated in the neuropathophysiology of ASD (dorsolateral prefrontal cortex, primary motor cortex, and temporoparietal junction). As there is evidence for neurobiological gender differences in ASD, we also examined the influence of biological sex.
Methods:
TMS pulses were applied to each of the three sites (right lateralized) during 20-channel EEG recording.
Results:
We did not identify any differences in the EEG response to TMS between ASD and control groups. This finding remained when data were stratified by sex. Nevertheless, traits and characteristics associated with ASD were correlated with the neurophysiological response to TMS.
Conclusion:
While TMS-EEG did not appear to clarify the neuropathophysiology of ASD, the relationships identified between the neurophysiological response to TMS and clinical characteristics warrant further investigation.
Introduction
A
Despite our growing understanding of the neurobiological underpinnings of autistic symptomatology, little focus has been placed upon the mediating role of biological sex, possibly a result of males being almost four times more likely to be diagnosed with ASD compared with females (Fombonne, 2003, 2009; CDC, 2014). It has been suggested that female gender may modulate clinical and neurobiological factors underlying ASD (Kirkovski et al. 2013 for a review). Neuroanatomically, the limited literature that is available suggests that females with ASD may experience an atypical neurobiological profile that differs to affected males, sometimes described as being more severe or widespread (Bloss and Courchesne, 2007; Beacher et al. 2012; Lai et al. 2013). Interestingly, however, these structural abnormalities have shown no relationship with symptomatology (Schumann et al. 2009), symptom onset, or regression (Nordahl et al. 2011), despite such relationships being present in the male subsamples.
Transcranial magnetic stimulation (TMS), a well-established modality used to noninvasively stimulate cortical regions of the brain, provides a novel way in which to investigate the neurobiological underpinnings of ASD. Most commonly applied through stimulation to the primary motor cortex (M1), cortical responses are indexed through facilitation or suppression of motor evoked potential (MEP; measurable involuntary muscle responses in response to TMS applied to the motor cortex) measures using electromyography (EMG). This technique has provided evidence for atypical cortical excitability in ASD populations with regard to mirror systems (Theoret et al. 2005; Enticott, et al. 2010; Enticott et al. 2011).
The technique described above is limited in application to motor regions. Obtaining measures of cortical excitability and activity (for example, cortically evoked potentials or oscillatory power spectra) through the applications of TMS to nonmotor regions are achievable through the concurrent recording of electroencephalography (Ilmoniemi and Kicic, 2010). Thus, TMS-electroencephalogram (EEG) allows us to probe excitatory and inhibitory aspects of neuronal activity in nonmotor regions and gain an in vivo understanding of potential neurochemical activity within a stimulated region. TMS-EEG can be applied to probe cortical function at rest, to simultaneously modulate regions or networks involved in execution of cognitive tasks, and to entrain and monitor oscillatory brain rhythms (Miniussi and Thut, 2010). Moreover, various applications and paradigms can induce excitatory or inhibitory responses (Daskalakis et al. 2012), targeting a variety of neural systems.
Application of TMS-EEG has shown promise in healthy samples, in terms of further understanding cortical functions such as long-term potentiation (Esser et al. 2006) and oscillatory modulation in response to varying stimulation parameters (Fuggetta et al. 2005). In psychiatric populations, TMS-EEG methods have been fruitfully used to explore the role of induced cortical oscillations and power in disorders such as schizophrenia (Ferrarelli et al. 2008; Frantseva et al. 2014). Notably, electrophysiological activity in high frequency bands (beta [β; 13-30 Hz] and gamma [γ; 31–45 Hz]) is often related to activity of the inhibitory neurotransmitter gamma-aminobutyric acid (GABA) (Porjesz et al. 2002; Gaetz et al. 2011). Atypical GABA-related cortical inhibition has been demonstrated in ASD using TMS and EMG (Enticott et al. 2010). GABAergic abnormalities are often cited in the ASD literature (e.g., Fatemi et al. 2009; Oblak et al. 2011) and better understanding of GABAergic function in ASD could have important implications for the development of novel treatment options.
To date, no research has used concurrent TMS-EEG to investigate cortical function in ASD. To this end, we conducted TMS-EEG at three sites as follows: right dorsolateral prefrontal cortex (DLPFC), right temporoparietal junction (TPj), and right M1. The right DLPFC and TPj were selected for stimulation primarily based on their involvement in systems and networks implicated in autistic symptomatology (e.g., impaired social understanding and executive dysfunction; Kobayashi et al. 2007; Costa et al. 2008; Van Overwalle and Baetens, 2009; Rizzolatti and Fabbri-Destro, 2010; Van Overwalle, 2011) and because functional abnormalities of these sites have been observed in ASD (TPj; [Kana et al. 2014; White et al. 2014] DLPFC; [Kalbe et al. 2010]). Right M1 was also stimulated as it allows for concurrent EMG relevant to the hemisphere of interest in this study, an important parameter to include in the first TMS-EEG investigation of ASD. In addition to this, TMS-EMG literature has demonstrated left-lateralized M1 abnormality in ASD (Theoret et al. 2005; Enticott et al. 2011); investigation of the right hemisphere would be informative with regard to hemispheric differences in neurobiological function at this site.
In line with the above described TMS-EEG literature, as well as the suggested impairment of the GABA system in ASD (Fatemi et al. 2009; Fatemi et al. 2009; Oblak et al. 2009; Enticott et al. 2010; Oblak et al. 2010), it was hypothesized that TMS-induced oscillatory power would be reduced in the high-frequency (β and γ) bands in individuals with ASD compared to age, sex, and IQ-matched NT controls across all sites. Considering the overlapping roles of the target sites described above, and the proposition of Brock et al. (2002) implicating γ-band abnormality in long range underconnectivity in ASD, it was further hypothesized that high-frequency band functional connectivity would be reduced in the ASD group compared with controls.
Given the preliminary nature of this study, EEG oscillations and phase synchrony of the alpha (α) frequency band were also explored. Second, as described above, there is evidence to suggest a mediating role of biological sex in ASD (Kirkovski et al. 2013); therefore, sex differences were also explored. Based on the limited literature that is available, it was expected that biological sex would mediate neurobiological functions beyond expected sexual dimorphisms. Specifically, based on the available literature at the time of this study, greater neurobiological atypicality was expected among females with ASD.
Materials and Methods
Participants
The final sample comprised 42 participants recruited as part of a larger study approved by the Human Research Ethics Committees of the Alfred hospital, Monash University, Swinburne University of Technology, and Deakin University.
Twenty-two participants (10 male, 12 female) had received a formal diagnosis of ASD (18 with Asperger's disorder [AD]) (9 male, 9 female) and 4 with autistic disorder (1 male, 3 female) without intellectual disability; high-functioning ASD [HFA]) based on Diagnostic and Statistical Manual of Mental Disorders, 4th edition (DSM-IV) (American Psychiatric Association 1994) criteria by an experienced clinician (psychologist, psychiatrist, and pediatrician) external to the study before taking part. A diagnostic report was provided to the researchers to ascertain diagnosis. There were 20 (11 male, 9 female) age, sex, and IQ-(as measured by the Kaufman Brief Intelligence Test, 2nd edition (KBIT-2; Kaufman and Kaufman, 2004) matched NT controls.
Handedness was quantified using the Edinburgh handedness inventory (Oldfield, 1971). All participants in the NT group were right handed. In the ASD group, 12 were right handed (6 male, 6 female), 7 were left handed (3 male, 4 female), and 3 were ambidextrous (1 male, 2 female). Demographic statistics are presented in Table 1; we note that an IQ score is not available for one participant in the ASD group due to fatigue and, hence, incompletion of the task. Based on the diagnostic report provided, it was confirmed that this participant had a cognitive ability within the normal range.
ASD, autism spectrum disorder; NT, neurotypical.
Screening
Participants were not eligible to take part in this study if they had been diagnosed with a psychiatric or neurological illness (with the exception of history of mood disorders and anxiety in the ASD group, given the high prevalence of this comorbidity within this population [Matson and Williams, 2014]), or an intellectual disability. Participants were excluded if they had any contraindications to TMS, including the following: having experienced a seizure or seizure disorder, stroke, serious head injury, brain related injury or illness, metal in the head (aside from dental fittings), implanted medical devices (e.g., pacemakers, medical pumps, and intracardiac lines), persistent or severe headaches and migraines, pregnancy, and breastfeeding.
Participants taking medications that may increase risk were also not able to partake in this study. It is commonplace for patients with ASD to be prescribed psychotropic medications, commonly used to treat other mental health conditions, to help manage their symptoms. Eleven participants in the ASD group reported taking such medications, these included the following: selective serotonin reuptake inhibitors (4), benzodiazepines (2), atypical antipsychotics (2), serotonin–norepinephrine reuptake inhibitor (1), typical antipsychotic (1), and norepinephrine reuptake inhibitor (1).
Behavioral assessment
As a measure of symptom severity or level of autistic traits, the Autism Quotient (AQ; Baron-Cohen et al. 2001), Empathy Quotient (EQ; Baron-Cohen and Wheelwright, 2004), and the Ritvo Autism and Asperger's Diagnostic Scale–Revised (RAADS-R; Ritvo et al. 2011) were administered. Each of these measures displays good psychometric properties (Austin, 2005; Stoesz et al. 2011; Falkmer et al. 2013) and is often used in research settings for this purpose. Furthermore, the RAADS-R was used as a screening measure for the NT group. Control participants scoring above the recommended clinical cutoff of 65 (of whom there were 7) for this measure were excluded from all analysis, given the absence of a full clinical assessment.
Locating stimulation sites
M1 stimulation was always delivered to the scalp region resulting in the highest muscle response in the first dorsal interosseous (FDI) muscle of the contralateral hand. Determination of this site is described in the next section. Stimulation sites for the DLPFC and TPj were determined as based on the standard 10–20 system positions; F4 has been established as an appropriate stimulation site for targeting the right DLPFC (Herwiget al. 2003), while previous brain-stimulation research has targeted CP6 for the right-sided TPj (Santiesteban et al. 2012). When combining TMS with EEG however, research from our laboratory has found that applying TMS laterally leads to an increase of muscle-related artefact (Rogasch et al. 2013). As such, in an attempt to minimize this artefact while still applying stimulation to the appropriate target sites, for DLPFC, the coil was centered between F2 and F4, and for TPj, the coil was centered between CP4 and CP6.
Motor threshold; TMS and EMG
TMS was applied over the EEG-recording cap (described in: Electroencephalography) using a standard figure eight (70 mm diameter) coil and two Magstim 200 stimulators connected through a BiStim device (Magstim Ltd.). This setup was used as the current data were collected as part of a larger protocol administering single and paired (not discussed in this article) pulse TMS.
To determine motor threshold, the coil was held tangentially over the scalp in a 45o angel to the midline. The coil was moved over the right motor cortex in systematic movements until the site producing greatest muscle responses (MEP) were determined. Cortical excitability was determined based on MEP size as measured through EMG and was recorded from the contralateral FDI muscle. Self-adhesive bipolar silver-silver chloride (Ag-AgCl) surface electrodes were placed in a belly-tendon array with a ground reference placed on the ulnar styloid process.
EMG signal was amplified ( × 1000) and band-pass filtered (10–500 Hz, PowerLab; ADInstruments) and digitized at 2 kHz with a Cambridge Electronic Design (CED Ltd.) interface. The EMG signal was epoched around the TMS pulse (−200 to 500 ms) and displayed on a computer screen online. The stimulation intensity used for each site was defined as the intensity required to elicit an average muscle response of 1 millivolt (mV) in peak-to-peak amplitude from 10 consecutive trials (S1mV). S1mV ranged between 41%–97% of stimulator intensity and did not differ between groups; (ASD: range = 41–82, M = 62.4, SD = 11.84, NT: range = 41–97, M = 62.5, SD = 14.88, t (36) = 0.02, p = 0.98). Due to recoding error, S1mV was not saved for four (2 ASD, 2NT) participants.
Experimental TMS
During stimulation, participants were required to sit as still as possible and remain awake with their eyes opened. Seventy-five single (and 75 paired; not discussed in this study) TMS pulses were randomly delivered (with 5 seconds jittered by 10% between stimuli) to the right M1 (during which EMG was also recorded, as per the aforementioned parameters), TPj, and DLPFC in separate blocks. Stimulation was delivered at S1mV. The coil was held tangentially and 45o to the midline for all stimulation sites. The coil was held in place by an experimenter throughout the stimulation to (a) monitor the participant and (b) ensure that the coil remained in place. To eliminate the effects of artefact caused by auditory activation resultant from the TMS pulse, participants were required to listen to white noise through earphones inserted into the ear canal during stimulation. Each block of stimulation lasted approximately 10 minutes, after which participants were offered a short break and drink of water to reduce the influence of fatigue.
Electroencephalography
EEG was recorded concurrent to stimulation using 20 Ag-AgCl sintered ring electrodes, fastened within plastic clips of an EEG-recording cap (EASYCAP GmbH), positioned bilaterally in the standard 10–20 system positions (AF4, F3, Fz, F2, F4, F6, FC4, C3, Cz, C2, C4, P3, Pz, P2, P4, P6, CP4, CP6, TP8, and PO4). Data were also recorded from the mastoids (M1 and M2), bilaterally. Electrooculogram (EOG) recordings were obtained from four Ag-AgCl electrodes positioned to the outer canthus of each eye, and above and below the left eye, in line with the pupil. All electrodes were referenced to the CPz electrode, with the exception of the EOG electrodes, which were referenced to each other. EEG signals were amplified (1000×), filtered (DC-2000 Hz), digitized (10 kHz; SynAmps2, Compumedics Ltd.), and recorded on a computer for offline analysis. All blocks of EEG recording were conducted in a dark room to avoid line noise from electrical appliances such as lights.
Data processing and analysis
EMG data were processed offline. Peak-to-peak MEP amplitude was measured from individual trials. MEPs containing EMG evidence of tonic muscle activity before the stimulus (200 ms) were excluded from analysis. MEP data from three participants (2 NT, 1 ASD) were excluded from analysis due to excessive tonic muscle activity across the entire block of trials. Excluding these, <1% of all trials were removed across the remaining 39 participants. Remaining data were averaged to provide an individual MEP peak-to-peak amplitude value for each participant.
EEG data were preprocessed using EEG laboratory (Delorme and Makeig, 2004) and analyzed using fieldtrip v20140401 (Oostenveld et al. 2010) and custom scripts, all run using MATLAB R2013a (The MathWorks, Inc.). Data cleaning was based on that presented by Rogasch et al. (2014).
Briefly, EEG data were epoched around the TMS pulse (−1000 to 1000 ms) and then baseline corrected (−500 to −110 ms). Channels that were disconnected or appeared to be making poor contact were removed. The TMS-induced artefact and muscle activity were removed (−2 to 15 ms) and the data were downsampled to 1 kHz. The data were submitted to the fast independent component analysis (fastICA) algorithm and the independent components representing remaining muscle activity were manually identified and removed. Data were then band-pass filtered (1–100 Hz) and band-stop filtered (45–55 Hz) to remove line noise.
Individual epochs were then manually inspected and rejected if persistent muscle activity or other anomalous signal was present. Following this procedure, a second round of fastICA was performed and components representing blinks, decay artefacts, or other noise-related signal were removed. Then data from available electrodes were rereferenced to the average of the mastoid electrodes, and butterfly plots were inspected. The artefact component identification and removal process was repeated if butterfly plots showed patterns of nonphysiological activity.
Power (μV2/Hz) estimates of TMS-evoked oscillations were obtained using Fourier transforms with a hanning window taper on single trials for each individual electrode (sliding window analysis; three oscillation cycles per window every 10 ms; frequency steps of 1 Hz between 8 and 45 Hz). Power estimates were then averaged over trials for each condition and related to a baseline period (data from −600 to −200 ms before TMS were subtracted from post TMS data). Power estimates were taken from specific electrodes of interest depending on the site of stimulation: DLPFC (F4), M1 (C4), and the TPj (CP6).
To estimate connectivity between electrodes, we calculated the debiased weighted phase-lag index (WPLI; Vinck et al. 2011). The WPLI is a calculation of interregional phase clustering (i.e., between electrode phase synchrony), which weights against zero-phase lag synchrony and is therefore robust against volume conduction; for a detailed explanation see Vinck et al. (2011). WPLI was calculated using the same time-frequency settings as above. To estimate TMS-evoked connectivity, the average WPLI between the electrode of interest at the site of stimulation (DLPFC = F4, M1 = C4, TPj = CP6) and all other electrodes was calculated across all time points and frequencies. The data were then baseline corrected by subtracting the average WPLI values between −600 to −200 ms from all data points.
Comparisons of TMS-evoked oscillatory power and TMS-evoked phase synchrony between groups at each electrode of interest were made using nonparametric, cluster-based permutation statistics. This approach controls for multiple comparisons across time and frequency and, therefore, does not require any a priori delineation of time periods or frequency bands. Clusters were defined as two or more contiguous data points, in which the t-statistic at a given time (20–300 ms) or frequency (8–45 Hz) point exceeded a threshold of p < 0.05 (independent t-test). Time points and frequency bins with above threshold values were used for subsequent cluster-based permutation analysis. Monte Carlo p-values were calculated on 5000 random permutations and a value of p < 0.05 was used as the cluster-statistical significance threshold for all analyses.
Two-tailed independent sample t-tests were conducted between groups for each site of interest. As recent research investigating sex differences in ASD highlights the importance of sex-stratified analysis (Holt et al. 2014; Lai et al. 2013), irrespective of the findings of our preliminary analysis, data were then stratified by sex.
Results
Demographic and behavioral data
The assumptions of normality were violated for demographic (Table 1) and behavioral data. Upon further inspection, it was determined that this was a true representation of the data, and not due to outliers, nor floor or ceiling effects. Hence, nonparametric (Mann–Whitney - U) tests were performed. To account for multiple comparisons, more conservative alpha levels of <0.003 (RAADS-R and AQ) and <0.004 (EQ) were used based on a Bonferroni correction. Overall, the ASD group scored significantly higher than the NT group on the AQ and RAADS-R, and all subscales. The ASD group scored lower than the NT group on the EQ and all subscales. When data were stratified by sex, females did not differ on the local detail and imagination subscales of the AQ and small effect sizes were detected (r = 0.21 and 0.17, respectively). Table 2 presents descriptive and statistical data for these measures.
ASD, autism spectrum disorder; AQ, Autism Quotient; EQ, Empathy Quotient; RAADS-R, Ritvo Autism and Asperger's Diagnostic Scale–Revised; NT, neurotypical.
EMG recording during M1 stimulation
Average MEP size (mV) during stimulation to M1 did not differ between groups (NT; M = 1.18, SD = 0.66, ASD; M = 1.36, SD = 0.66), U = 152, p = 0.30, and r = −0.17.
Electroencephalogram
DLPFC data were missing for two participants in the ASD group due to (a) cessation of protocol due to discomfort at stimulation site and (b) a corrupted data file. DLPFC data were excluded from a third ASD participant for the power analysis as this subject was detected to be an extreme outlier.
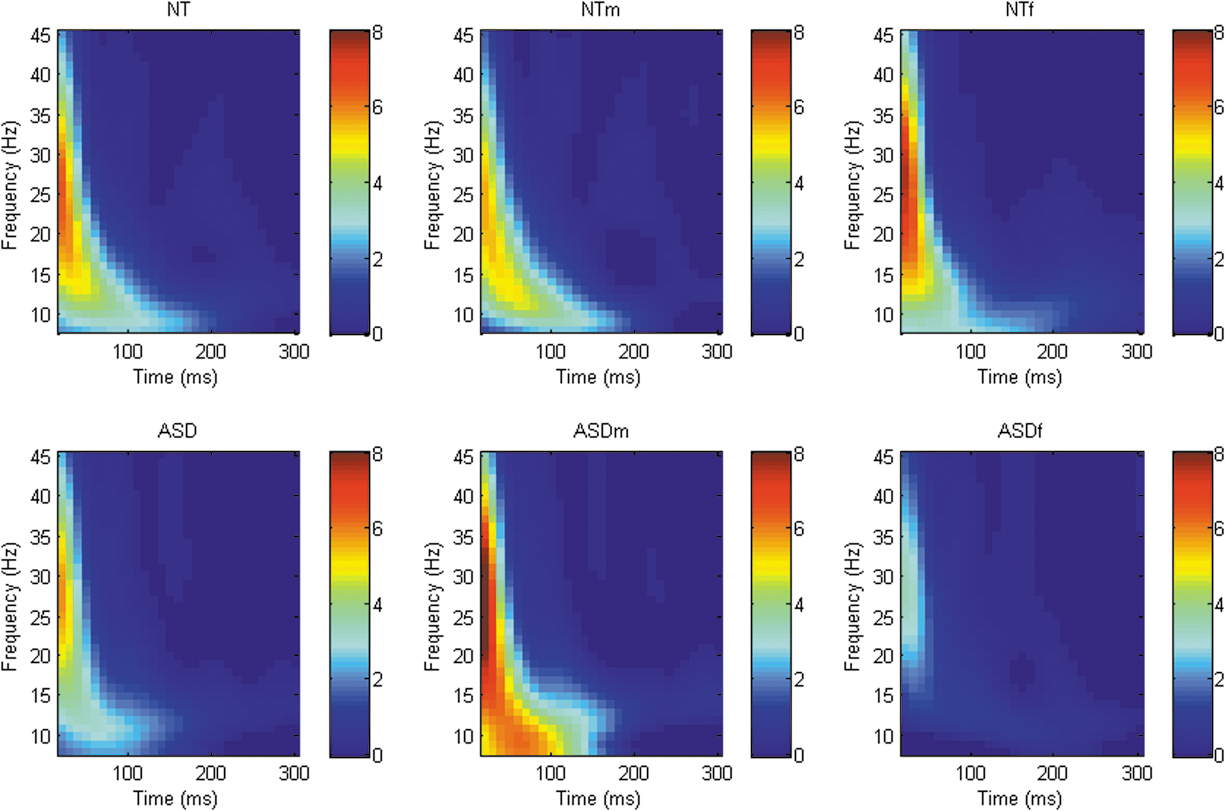
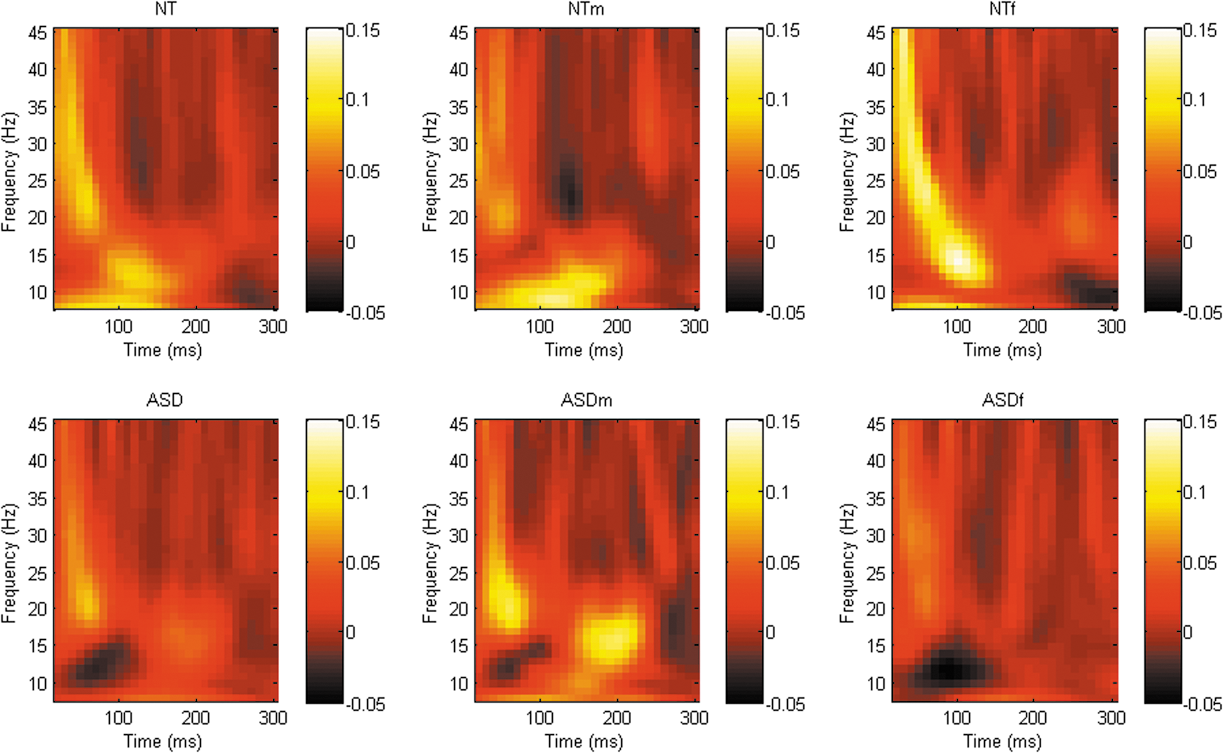
Analysis of TMS-evoked oscillatory power revealed a number of differing clusters at each of the sites of interest ([DLPFC; whole sample = 2 clusters, male stratified = 3 clusters, female stratified = 1 cluster], [M1; whole sample = 0, male stratified = 2 clusters, female stratified = 1 clusters], [TPj; whole sample = 1 cluster, male stratified = 1 cluster, female stratified = 2 clusters]) although no significant differences in power between groups across any frequency band/time point at any site were identified. When data were stratified by sex, there were again no significant differences between groups in any frequency band at any site (Figs. 1 –3).
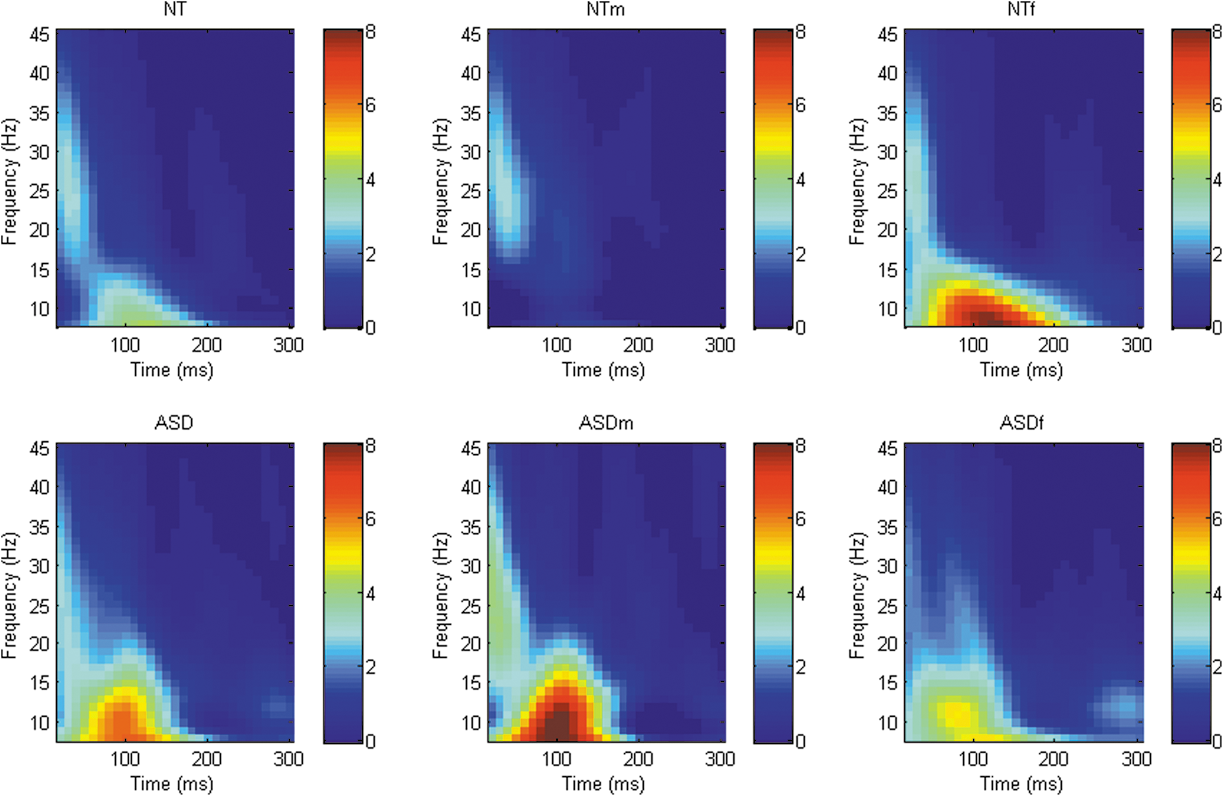
Graphical representation of Time-Frequency power spectra across all frequency bands following TMS to right DLPFC (F4). TMS, transcranial magnetic stimulation; DLPFC, dorsolateral prefrontal cortex.

Graphical representation of Time-Frequency power spectra across all frequency bands following TMS to right M1 (C4). TMS, transcranial magnetic stimulation.
Graphical representation of Time-Frequency power spectra across all frequency bands following TMS to right TPj (CP6). TPj, temporoparietal junction; TMS, transcranial magnetic stimulation.
Although a number of differing clusters were identified at each of the sites of interest ([DLPFC; whole sample = 7 clusters, male stratified = 5 clusters, female stratified = 2 clusters], [M1; whole sample = 2 clusters, male stratified = 2 clusters, female stratified = 3 clusters], [TPj; whole sample = 2 clusters, male stratified = 4 clusters, female stratified = 5 clusters]), there were no significant difference in phase synchrony between groups across any frequency band/time points at any site, see Figures 4 –6.
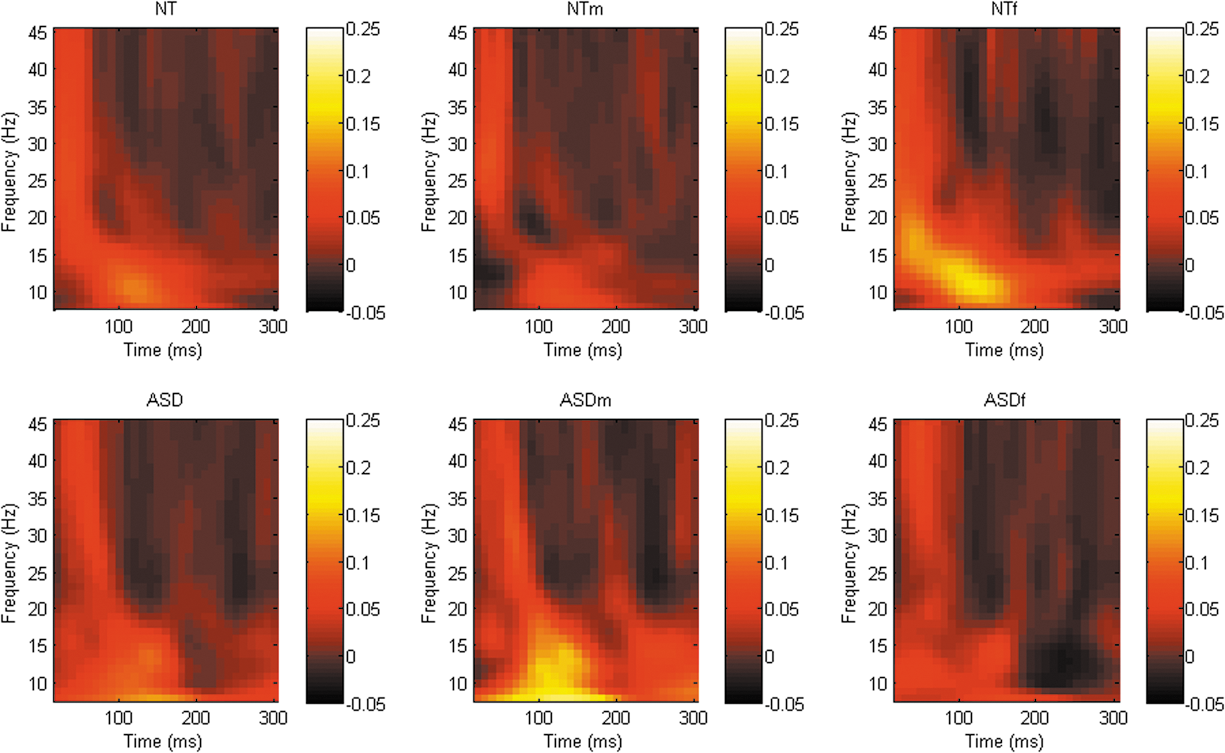
Graphical representation of phase synchrony power spectra across all frequency bands following TMS to right DLPFC (F4). TMS, transcranial magnetic stimulation; DLPFC, dorsolateral prefrontal cortex.
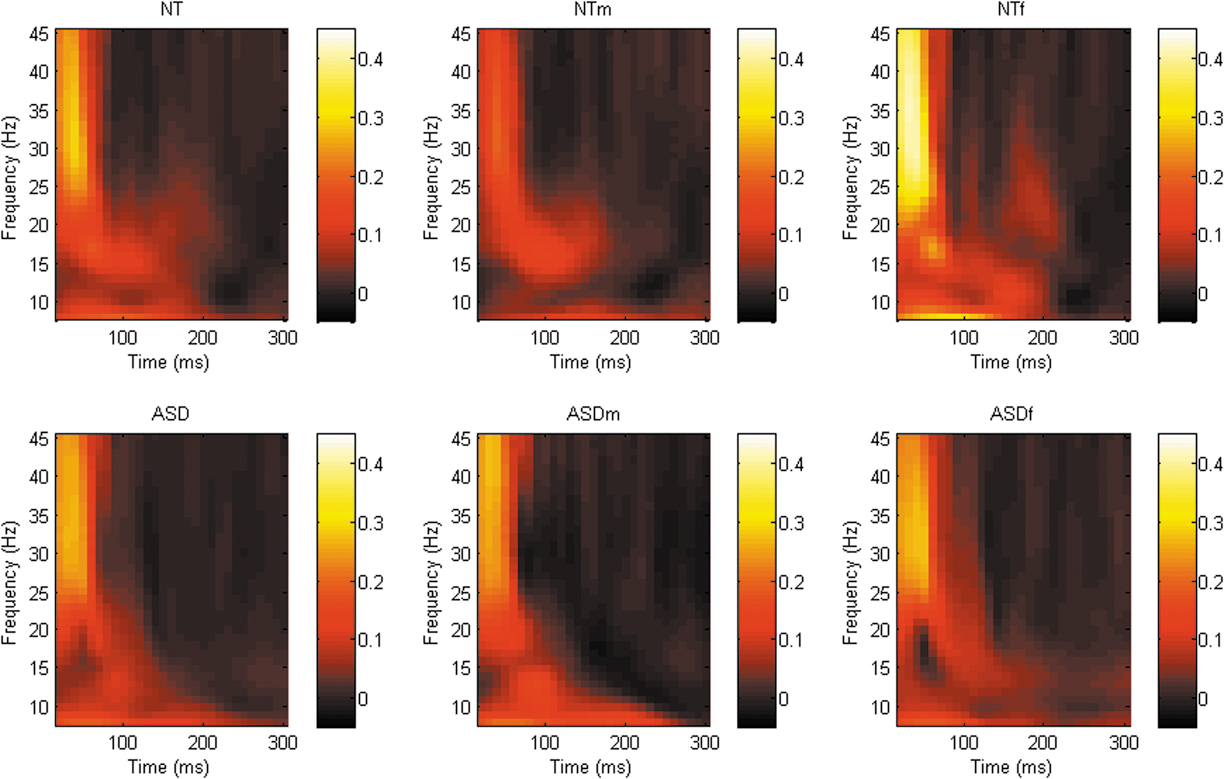
Graphical representation of phase synchrony power spectra across all frequency bands following TMS to right M1 (C4). There was a trend toward decreased β-band phase synchrony in the ASD group compared with the NT group approximately 50–100 ms following the TMS pulse. A similar trend toward decreased β-band phase synchrony 50–100 ms following the TMS pulse in females with ASD compared with the NT females. ASD, autism spectrum disorder; NT, neurotypical; TPj, temporoparietal junction; TMS, transcranial magnetic stimulation.
Graphical representation of phase synchrony power spectra across all frequency bands following TMS to right TPj (CP6). There was a trend toward decreased β-band phase synchrony in females with ASD compared with the NT females approximately 150–200 ms after the TMS pulse. ASD, autism spectrum disorder; NT, neurotypical; TMS, transcranial magnetic stimulation; TPj, temporoparietal junction.
There was, however, a nonsignificant trend (p = 0.079) toward reduced phase synchrony in the M1 β-band between approximately 150–200 ms following the TMS pulse in the ASD group compared with controls. When data were stratified by sex, a similar nonsignificant trend emerged between the female subgroups (p = 0.055; Fig. 5). Furthermore, there was also a nonsignificant trend (p = 0.064) toward reduced TPj connectivity in the β-frequency band between approximately 50–100 ms post the TMS pulse in females with ASD compared with control females, see Figure 6.
While the above findings cannot be taken to indicate group differences, they may provide some direction toward clinical associations. Indeed, to assess whether these trends were related to clinical characteristics (as measured by total score on the KBIT-2, AQ, RAADS-R, and EQ), the average of the time and frequency points included in clusters close to the significance threshold was calculated and extracted for each individual. Spearman's rank-order correlation analysis was conducted in IBM SPSS v22. Missing data were excluded pairwise.
When data were analyzed across the sample (Table 3), several significant correlations emerged, suggesting that higher levels of autistic characteristics were related to less phase synchrony. Composite IQ was not related to phase synchrony. When data were stratified by group (NT and ASD), a significant positive relationship was identified between phase synchrony at M1 (including males and females) and total EQ score, rs (18) = 0.693, p = 0.001, for the NT group only. To account for multiple comparisons, a more conservative alpha of 0.002 has been adopted based on a simple Bonferroni correction.
Two-tailed comparisons.
female subsample.
Significant, at 0.002 level.
AQ, Autism Quotient; EQ, Empathy Quotient; KBIT-2, Kaufman Brief Intelligence Test, 2nd edition; RAADS-R, Ritvo Autism and Asperger's Diagnostic Scale–Revised.
Discussion
To our knowledge, this is the first study to explore neurobiological mechanisms in ASD using a concurrent TMS-EEG paradigm, and moreover, to explore sex differences to this effect. Contrary to expectation, we did not detect any differences in neurobiological activity or connectivity in the high frequency bands at brain regions previously implicated as being impaired in ASD between groups. Moreover, we did not identify any differences between groups when data were stratified by sex.
Despite this, several correlations were identified between clinical features of ASD and clusters extracted from the phase synchrony data. These findings suggest that although subtle, traits and characteristics associated with the autism spectrum could be related to neurophysiological differences in the brains’ response to TMS. In addition to experimental applications, TMS protocols show promise for the treatment and management of core symptoms of ASD (Enticott, et al. 2014), and further investigation of these effects appears warranted.
As a whole, the present study provides findings in contrast with the vast majority of the literature suggesting abnormalities in the neurobiological mechanisms underlying ASD (Philip et al. 2012; Wang et al. 2013). Using an alternative, paired-pulse TMS (with concurrent EMG) paradigm aimed at investigating cortical inhibition and excitability, Enticott et al. (2010) report comparable cortical inhibition between participants with AD and NT controls, cortical inhibition in participants with high-functioning autistic disorder however was reduced (Enticott et al. 2010). Given that the majority of the clinical sample in the present study had been previously diagnosed with AD, although investigating different mechanisms, the findings of the present study are akin to those presented by Enticott et al. (2010) and may be reflective of level of impairment. As only four participants had a diagnosis of autistic disorder, we were not able to investigate this further.
In fact, only recently have these two conditions been subsumed under one diagnostic category (American Psychiatric Association, 2013), previously AD and autistic disorder have been considered two separate conditions (American Psychiatric Association, 1980, 1994, 2000). Although formally, individuals who have been previously diagnosed with AD would have their diagnosis recognized under the Diagnostic and Statistical Manual of Mental Disorders, 5th edition (DSM-5) changes (American Psychiatric Association, 2013), it has been suggested that many high-functioning individuals (including those with AD), if assessed based on the updated diagnostic criteria, may not meet criteria for a formal diagnosis (Mattila et al. 2011). Despite this, the neuroimaging literature comparing AD and autistic disorder is limited, as many researchers referred to and considered the group of conditions previously considered pervasive developmental disorders (PDD) collectively under the “autism spectrum” umbrella before the official changes in the DSM-5 (Ozonoff, 2012).
By definition, individuals with AD experience a lesser degree of clinical impairment (American Psychiatric Association, 2000). Wilson et al. (2014) however, note that at a behavioral level, while individuals with AD and autistic disorder differed on some subscales of gold-standard measures of autistic symptomatology, overall ASD subtype was not able to be classified beyond as would be expected by chance, hence providing support for the subsumption of these diagnoses. A meta-analysis of structural abnormalities further refutes the notion of differentiation between PDD subtypes (Via et al. 2011). These findings, however, do not speak to functional neurobiological differences that may be observed between individuals experiencing varying degrees of clinical impairment along this highly heterogeneous spectrum.
This is not the first study to reveal no brain-related differences between individuals with ASD and healthy controls (Tepest et al. 2010; Kirkovski et al. 2015; Lefebvre et al. 2015). Indeed, Kennedy et al. (2015 p. 82) emphasize that “negative findings can be as important as positive findings and help to narrow our search for causal explanations of psychiatric illness.”
One factor that may influence this result considerably is age. Structural neuroimaging research, for example, has demonstrated that the developmental trajectory of the brain-based abnormality observed in children and adolescents with ASD may “normalize” with age, to the point whereby individuals on the spectrum have comparable total brain volume to unaffected individuals (Redcay and Courchesne, 2005). Moreover, at a behavioral level, there is research to suggest that individuals with ASD may experience some degree of improvement in the level of clinical symptoms expressed (Mayes and Calhoun, 2011). Although there is a plethora of neuroimaging literature demonstrating functional differences between adults with ASD and NT controls (Philip et al. 2012 for a review and meta-analysis), this pattern of normalization with regard to neurobiological function is yet to be directly investigated.
A second, and vital, consideration is the modalities used across studies. In this study, we use TMS-EEG, a paradigm that has not previously been reported in an ASD sample. Of note, the present study was part of a larger protocol that involved magnetic resonance imaging (MRI). Using diffusion tensor imaging, we did not identify any differences in white matter microstructure in a related sample (Kirkovski et al. 2015), although sex differences in brain function during social processing were identified (Kirkovski et al. 2016). It was thought that TMS-EEG may provide a more sensitive measure that can detect subtle differences not identified using standard neuroimaging modalities. However, the neurobiological mechanisms assessed through single pulse TMS-EEG may have little relevance to the neuropathophysiology of ASD, at least among a high-functioning adult sample.
Our findings are somewhat similar to recent functional neuroimaging investigations of sex differences in ASD, which indicate that females with ASD may have a functional neurobiological profile more akin to NT females during social processing (Holt et al. 2014; Kirkovski et al. 2015). In contrast, however, these studies report that compared with NT males, an atypical neurobiological response was noted in males with ASD. Alternative cognitive states and demands are likely to affect neurobiological function. It is possible that the presence of a social task, demanding of the brain regions stimulated in this study, would yield a different neurobiological response in comparison to stimulating these regions in the absence of any cognitively demanding task as per the protocol used in the present study. This warrants further investigation.
While providing basis for a novel paradigm by which to investigate the neurobiological basis of autistic symptomatology, this study is not without limitation. First, although the present sample is large in comparison with earlier investigations of sex difference in ASD, it may still be statistically underpowered to detect subtle differences between groups. Objective confirmation of diagnosis using a measure such as the Autism Diagnostic Interview (ADI) or Autism Diagnostic Observation Schedule (ADOS), as well as a standardized neuropsychiatric interview to characterize other symptomatology, would be of value.
Methodologically, the use of a partial and asymmetrical EEG montage may compromise temporal resolution. Future research would benefit from a more robust and symmetrical EEG montage. While TMS-EEG is beneficial in terms of its applicability to investigate the function of brain regions in the absence of external (visual) stimuli, its concurrent use during the presence of a socio-cognitive demanding task designed to engage the cortical regions targeted may yield more robust findings. Finally, future studies of this nature would benefit from the use of neuronavigation, a technique not available for this study.
As highlighted above, the results of this study are based on a high-functioning adult sample of individuals with ASD. Hence, the present findings may not be applicable to younger or lower functioning samples. In addition, due to potential confounds arising due to hand dominance and laterality, it has become common practice for many neuroimaging studies that limit participation to right handers only (Willems et al. 2014). While we feel that we are justified in including left handed and ambidextrous participants in this study, as left-handedness is reflective of a proportion of the general population (Willems et al. 2014), and more over individuals with ASD are more likely than NT controls to be left-hand dominant or ambidextrous (Colby and Parkison, 1977; Tsai, 1982), future research could, however, more stringently match handedness between patient and control samples.
Conclusions
In summary, using a TMS-EEG paradigm, we did not identify any differences in the electrophysiological response to TMS at the right DLPFC, TPj, and M1 between high functioning adults with ASD and matched controls. Moreover, we did not detect any effects of sex. There is, however, preliminary correlational evidence to suggest that clinical characteristics associated with ASD may be related to the neurophysiological response to TMS. Given the preliminary nature of this methodology, we feel that future research investigating brain-based abnormality in ASD could benefit from this, and similar paradigms.
Clinical Significance
This research, although preliminary, has important implications for treatment and management of ASD. The vast majority of literature in ASD is predominantly based on male samples. As a result, researchers and clinicians’ understanding of ASD are biased toward the male profile of ASD. With novel treatments being trialled to directly target brain function (for example, Enticott et al. 2014), deeper understanding of neurobiological (sex) differences is imperative to appropriately tailor intervention.
Footnotes
Disclosures
Peter G. Enticott is supported by a Career Development Grant from the National Health and Medical Research Council (NHMRC). Bernadette M. Fitzgibbon and Nigel C. Rogasch are supported by Early Career Fellowships from the NHMRC. Paul B. Fitzgerald is supported by a NHMRC Practitioner Fellowship. Melissa Kirkovski, Nigel C. Rogasch, Takashi Saeki, Bernadette M. Fitzgibbon, and Peter G. Enticott report no conflict of interest. Paul B. Fitzgerald has received equipment for research from MagVenture A/S, Medtronic Ltd, and Cervel Neurotech and Brainsway Ltd. and funding for research from Cervel Neurotech.