
Abstract
Objectives:
Neuroimaging studies of adults with bipolar disorder (BD) have identified several BD subtype distinctions, including greater deficits in prefrontal gray matter volumes in BD-I (bipolar I disorder) compared to BD-II (bipolar II disorder). We sought to investigate BD subtype differences in brain structure among adolescents and young adults.
Methods:
Forty-four youth with BD (14 BD-I, 16 BD-II, and 14 BD-not otherwise specified [NOS], mean age 17) underwent 3T-MRI and images were analyzed using FreeSurfer software. Cortical volume and thickness were analyzed for region of interest (ROI): ventrolateral prefrontal cortex, ventromedial prefrontal cortex, anterior cingulate cortex (ACC), subgenual cingulate cortex, and amygdala, controlling for age, sex, and total intracranial volume. ROIs were selected as found to be implicated in BD in prior studies. A whole brain vertex-wise exploratory analysis was also performed. Uncorrected results are presented.
Results:
There were group differences in ACC thickness (F = 3.88, p = 0.03, η2 = 0.173 uncorrected), which was reduced in BD-II in comparison to BD-I (p = 0.027 uncorrected) and BD-NOS (p = 0.019 uncorrected). These results did not survive correction for multiple comparisons and no other group differences were observed. The exploratory vertex-wise analysis found a similar pattern of lower cortical thickness in BD-II in the left and right superior frontal gyrus and left caudal middle frontal gyrus.
Conclusions:
This study found reduced cortical thickness for youth with BD-II, relative to BD-I, in regions associated with cognitive control. Further neurostructural differences between subtypes may emerge later during the course of illness.
Introduction
B
BD-I remains the most heavily studied subtype (Phillips and Kupfer 2013). There is thus an important research gap; whereas the prevalence of BD-I and BD-II in youth is 1%–2%, an additional 3.9%–5.7% of youth have BD-NOS or other BD-spectrum conditions (Lewinsohn et al. 1995; Merikangas et al. 2009, 2010). Youth across the BD spectrum have comparable functional impairment, level of comorbidity and family aggregation (Lewinsohn et al. 1995; Hafeman et al. 2013; Towbin et al. 2013). Importantly, the rate of conversion from BD-NOS to BD-I or BD-II among youth is as high as 38%–45% at 5 years, and up to 58% in those with a positive family history of mania or hypomania (Birmaher et al. 2009; Axelson et al. 2011).
Whereas BD subtypes are defined solely by phenomenology and symptoms, it is important to evaluate whether such groupings are related to objective neurobiological phenotypes such as brain structure. Examining neuroimaging correlates of BD subtypes in youth can contribute to our understanding of putative structural underpinnings of these symptom-driven constructs. Contemporary neuroimaging models of BD describe functional and structural differences in circuits implicated in emotion processing and emotional regulation, and abnormalities in neural circuitry related to reward processing (Phillips and Swartz 2014). Anomalous connectivity between ventral prefrontal networks and limbic structures, especially the amygdala, is thought to be at the center of a disruption causing structural and functional reorganization, and BD symptom emergence (Strakowski et al. 2012).
Although amygdala volume reduction has been consistently replicated in youth with BD (Blumberg et al. 2003; DelBello et al. 2004; Pfeifer et al. 2008; Kelley et al. 2013), neurostructural findings regarding prefrontal and temporal cortical abnormalities have been less consistent (Wilke et al. 2004; Dickstein et al. 2005; Frazier et al. 2005; Kaur et al. 2005; Hajek et al. 2008a). Most neuroimaging studies of middle-age adults with BD have either grouped BD-I and BD-II subjects together, or investigated only BD-I or only BD-II (Kempton et al. 2008; Ambrosi et al. 2013; Elvsåshagen et al. 2013; Hanford et al. 2016).
Several studies in middle-aged adults have found greater structural deficits in BD-I in comparison to BD-II. In adult studies comparing brain structure in BD-I and BD-II to each other and to HCs, both BD groups showed decreased volumes compared to healthy controls (HCs) in prefrontal regions, but BD-I subjects had additional deficits in temporal regions and more diffuse and severe gray matter (GM) reduction (Ha et al. 2009; Abé et al. 2015). Whereas BD-II was not significantly different from HCs in terms of brain volume and cortical thickness, BD-I differed from HCs in specific areas such as the cingulate gyrus, postero-medial, and inferior parietal lobe, with notable differences in orbitofrontal cortex (OFC) and superior temporal regions between the BD subtypes (Maller et al. 2014). There are also contradictory findings, with one study reporting greater volumetric deficits in medial frontal areas, OFC, and dorsolateral prefrontal cortex (DLPFC) in a cyclothymic subgroup in comparison to BD-I and BD-II (Haznedar et al. 2005). The largest study to report on BD subgroup differences in adults thus far, from the ENIGMA Bipolar Disorder Working Group, found no significant differences in cortical thickness or surface area across BD subtypes (Hibar et al. 2018).
Few studies have focused on subtype difference in young adults with BD. A study comparing young adults with psychosis to those with BD and to controls compared cortical thickness among subjects with BD-I (n = 21), BD-II (n = 29), and BD-NOS (n = 23) as part of a secondary analysis. Uncorrected analysis found medium effect sizes for lower cortical thickness of the supramarginal gyrus and precuneus in BD-I in comparison to BD-NOS (Hatton et al. 2013). A subgroup analysis of the ENIGMA Bipolar Disorder study group, focusing on individuals under 25 years of age found cortical thickness differences between BD-I (n = 214) and BD-II (n = 90) in temporal regions, and surface area differences in occipital regions and caudal anterior cingulate cortex (ACC). None of the findings remained significant after correction for multiple comparisons, which may be related in part to the analysis of 70 regions of interest (ROIs) (Hibar et al. 2018).
Finally, a large study reported reduced left ACC volume in adolescents with subthreshold manic symptoms (n = 42) compared to HCs (n = 126) (Paillère Martinot et al. 2014). However, no prior study has specifically examined BD-I, BD-II, and BD-NOS subtype differences in brain structure among adolescents. Adolescence is a key period for brain development, onset of BD is frequently during adolescence, and it is proposed that abnormalities in neurodevelopment could be involved in BD etiolpathology (Blumberg et al. 2004; Perlis et al. 2004). It is hypothesized that brain structural abnormalities could be related to symptom severity or a poorer prognosis in adolescents with BD.
The goal of this study is to compare GM volumes and cortical thickness among older adolescents and young adults with BD-I, BD-II, and BD-NOS. This group will be referred to as “youth.” In the context of a paucity of prior studies on BD subtypes in this population, we hypothesized there would be differences in terms of brain volume and cortical thickness in the following regions previously linked to BD circuitry: ventrolateral prefrontal cortex (vlPFC), ventromedial prefrontal cortex (vmPFC), ACC, subgenual cingulate cortex (sgCC), and amygdala. We also complemented this ROI approach with an exploratory whole brain vertex-wise analysis.
Methods
Participants
Fifty-one youth with BD were recruited from a subspecialty clinic in an academic health sciences center. Participants were included if they were English-speaking, 13–20 year olds with a diagnosis of BD-I, BD-II or BD-NOS. Participants were excluded in the case of contraindication to magnetic resonance imaging (MRI), cardiac, autoimmune, or inflammatory illness, neurological or cognitive impairment or inability to provide consent. In addition, HCs were recruited from the community through advertising and were excluded if they had any major or recent psychiatric disorders (no lifetime mood or psychotic disorders; no alcohol or drug dependence or anxiety disorders within 3 months) or first- or second-degree family history of BD or psychotic disorders.
Psychiatric diagnoses were established using the Schedule for Affective Disorders and Schizophrenia for School Age Children, Present and Life Version (K-SADS-PL) (Kaufman et al. 1997); expanded mood sections, the KSADS Depression Rating Scale (Chambers et al. 1985) and the KSADS Mania Rating Scale (Axelson et al. 2003), were used in place of the standard mood sections of the K-SADS-PL to generate related diagnoses and mood symptom severity scores. The K-SADS-PL has been validated for children and adolescents from 6 to 18 years of age; for consistency within the current study, K-SADS-PL was also used for those participants aged 19–20 years. Further information was collected using the Family History Screen interview (Weissman 2000), and the Children's Global Assessment Scale (CGAS) (Shaffer et al. 1983). The interviewers involved in this study had completed a Bachelors or Master's degree in a Health Sciences-related field and had prior training on the KSADS by the senior author (B.I.G.). Consensus case conferences after the aforementioned measures were held and diagnosis was confirmed by a board-certified child and adolescent psychiatric (B.I.G. or R.H.B.M.).
BD-NOS was defined using criteria previously operationalized by the COBY (Course and Outcome of Bipolar Illness in Youth) study group (Axelson et al. 2006): Elevated and/or irritable mood, plus (1) two Diagnostic and Statistical Manual of Mental Disorders, fourth edition (DSM-IV) (American Psychiatric Association 1994) manic symptoms (three if only irritable mood is reported), (2) change in functioning, (3) mood and symptom duration of at least 4 hours during a 24 hour period, and (4) at least four cumulative 24 hour periods of episodes over the participants' lifetime that meet the mood, symptom severity, and functional change criteria.
Participants and one parent or guardian provided written informed consent before study participation. The local ethics board approved this study.
MRI acquisition
MRI data were collected with a 3T Philips Achieva system (Philips Medical Systems, Best, The Netherlands) using body coil transmission and an eight-channel head receiver coil. Anatomical images were acquired via T1-weighted high resolution fast-field echo imaging (repetition time/echo time/inversion time = 9.5/2.3/1400 ms, field of view 240 × 191 mm, spatial resolution 0.94 × 1.17 × 1.2 mm, flip angle 8°, 256 × 164 × 140 matrix, scan duration 8 minutes and 56 seconds).
Image processing
Seven participants were excluded due to poor image quality from excessive head motion and/or artifacts. For the remaining 44 participants (14 BD-I, 16 BD-II, and 14 BD-NOS) measures of cortical thickness, volume, and surface area were obtained by processing T1-weighted images for individual participants into surface based morphometric data using FreeSurfer (v5.3) software (Fischl 2012). Preprocessing was completed in accordance with prior detailed descriptions (Dale et al. 1999), and involved registration to Montreal Neurological Institute (MNI305) atlas, intensity normalization, and removal of nonbrain tissue (Ségonne et al. 2004). Automated parcellation of the cortex consisted of classifying voxels as either white matter or nonwhite matter based on signal intensity, followed by the generation of a tessellated white matter surface (i.e., the gray/white matter interface) and pial surface (i.e., gray matter/CSF interface).
Extractions of these surfaces allowed thickness and volume to be computed automatically by FreeSurfer software (Fischl and Dale 2000). Based on anatomical landmarks, the individual brain images were mapped to probabilistic atlases (Desikan-Killiany and Destrieux) to label the various cortical regions (Desikan et al. 2006; Destrieux et al. 2010). Surface reconstructions were visually inspected by two independent raters. When possible, erroneous parcellations were manually corrected using editing tools provided in FreeSurfer. Automated segmentation of subcortical volumes was processed independently via nonlinear registration to MNI305 space and mapping to probabilistic atlas to label the various subcortical structures (Fischl et al. 2002). A radiologist reviewed the scans for anatomical abnormalities.
Regions of interest
Bilateral ROIs were defined based on proposed circuits of BD etiopathology (Strakowski et al. 2012). Cortical ROIs were defined using Destrieux cortical parcellation atlas available in Freesurfer (Desikan et al. 2006; Destrieux et al. 2010), based on concordance to Brodmann areas (BA). ROIs and labels included ACC (BA 24, 32: anterior part of the cingulate gyrus and sulcus); sgCC (BA 25: subcallosal area/subcallosal gyrus); vmPFC/OFC (BA 11: suborbital sulcus [sulcus rostrales/supraorbital sulcus], straight gyrus/gyrus rectus, medial orbital sulcus [olfactory sulcus], orbital gyri, and orbital sulci [H-shaped sulci]); and vlPFC (BA 10, 47: horizontal ramus of the anterior segment of the lateral sulcus [or fissure], orbital part of the inferior frontal gyrus, lateral orbital sulcus, fronto-marginal gyrus [of Wernicke] and sulcus, and transverse frontopolar gyri and sulci). Thickness measurements were calculated in proportion to the surface area of the combined regions. The amygdala was defined using a probabilistic subcortical segmentation algorithm (Fischl et al. 2002).
Statistical analysis
Analyses were performed using SPSS, version 24 (IBM Corp., Armonk, NY). Group comparisons of participants' demographic and clinical variables were assessed using one-way ANOVA and chi-square tests, as appropriate. For a priori ROIs, GM volume and cortical thickness were tested using analysis of covariance general linear models (GLMs) with BD subtype (BD-I, BD-II, and BD-NOS) and sex as fixed factors and age as a nuisance covariate. Intracranial volume (ICV) was included as an additional covariate in the volumetric analyses. Omnibus tests were followed by post hoc pairwise comparisons of estimated marginal means (EMM), irrespective of statistical significance. Measures of effect size are included for pairwise comparisons by reporting Cohen's d (d).
In the context of literature suggesting an impact of lithium on neurostructural findings, we performed a sensitivity analysis by excluding patients taking lithium (Hafeman et al. 2012). Both uncorrected p-values and false discovery rate (FDR) corrected p-values (p corr) were considered (Benjamini and Hochberg 1995).
Whole brain analysis
A whole brain vertex-wise analysis was used to complement the ROI analysis in the context of limited previous literature and the exploratory nature of this study. Preprocessing for this step included generating an average control surface over which volume/thickness data for each participant were mapped and smoothed using a full-width at half maximum of 15 mm. A surface-based smoothing kernel with a full-width at half maximum of 15 mm was used to observe more coarse differences given our relatively small sample size. Pairwise contrasts and an F-test across all three groups were tested. Briefly, each contrast was entered into a GLM design matrix with volume and thickness as the outcome variable, accounting for sex, age, and ICV. Statistical significance for the primary threshold was defined as p < 0.05, and cluster corrected using permutation testing method (−log p = 1.3 corresponding to p = 0.05).
To contextualize the differences found between the three BD groups with HCs, a post hoc analysis was conducted using the results from the whole brain cortical thickness analysis. The following approach was undertaken to follow-up on BD subtype findings, to provide the context of which direction could be considered anomalous. Once vertex-wise clusters were rendered on a FreeSurfer average (fsaverage) template brain, the clusters were mapped across all brain surfaces in the sample, including the BD sample and 42 age- and sex-matched HC. This was done by using the fsaverage cluster as a source mask and by mapping the circumscribed vertices to individual subjects' space, using Talairach space for intermediate registration. Cortical measurements, including thickness and volume, were then obtained for specific clusters across the entire sample. The mean cortical thickness values extracted from the whole brain analysis for all four groups (BD-I, BD-II, BD-NOS, and HCs) for bilateral superior frontal gyrus (SFG) and left caudal middle frontal gyrus (CMFG) were compared using analysis of covariance GLMs with BD subtype (BD-I, BD-II, BD-NOS, and HC) as fixed factor, sex (% female) as fixed factor, and age as covariate of nuisance.
Results
Demographic and clinical variables
Demographic and clinical variables are presented in Table 1. No age differences were found between groups (17.6 ± 1.4 years, p = 0.167). There was a smaller proportion of females in the BD-II group (43.75%) than in the BD-I and BD-NOS groups (64.29%) but this was not statistically significant. Lifetime history of lithium use was significantly more common in BD-I participants than in participants with BD-NOS or BD-II (p = 0.011). In light of prior evidence that lithium is associated with brain structure in BD (Moore et al. 2000; Sassi et al. 2002; Hafeman et al. 2012), we conducted a sensitivity analysis examining only participants without lifetime history of lithium use.
Data for CGAS—current and CGAS—lifetime most severe only available for 13/14 subjects with BD-I.
ADHD, attention-deficit/hyperactivity disorder; BD, bipolar disorder; BD-I, bipolar I disorder; BD-II, bipolar II disorder; BD-NOS, bipolar disorder not otherwise specified; CD, conduct disorder; CGAS, Children's Global Assessment Scale; ODD, oppositional defiant disorder; SSRI, selective serotonin reuptake inhibitors.
There was a trend for substance use (p = 0.055) being higher in BD-I and BD-II groups than in the BD-NOS group. The lifetime most severe score on the CGAS was significantly lower in the BD-I group than in the BD-II and BD-NOS groups. No other demographic or clinical variables varied significantly between groups.
ROI analysis
EMM for cortical thickness and volume are presented in Tables 2 and 3, respectively. Cortical thickness differed between groups in the ACC (F = 3.88, p = 0.03, η2 = 0.17) (uncorrected). Post hoc pairwise comparisons demonstrated that ACC thickness (Fig. 1) for BD-II (2.72 ± 0.035 mm) differed significantly from BD-I (2.85 ± 0.039 mm) (p = 0.027, d = 0.91) (uncorrected) and BD-NOS (mean = 2.85 ± 0.038 mm) (p = 0.019, d = 0.92) (uncorrected); BD-I and BD-NOS did not differ (p = 0.95, d = 0) (uncorrected). Cortical thickness in SgCC is presented in Supplementary Figure S1. No group differences survived correction for multiple comparisons (all pFDR >0.1).

ACC cortical thickness across the BD spectrum in adolescents. Post hoc pairwise comparison all participants: BD-I versus BD-II: uncorrected p = 0.027, BD-I versus BD-NOS: uncorrected p = 0.95, BD-II versus BD-NOS: uncorrected p = 0.019. Post hoc pairwise comparison in participants without lifetime history of lithium use: BD-I versus BD-II: uncorrected p = 0.441, BD-I versus BD-NOS: uncorrected p = 0.245, BD-II versus BD-NOS: uncorrected p = 0.006. All participants: BD-I: n = 14, BD-II: n = 16, BD-NOS: n = 14. Participants without lifetime history of lithium use: BD-I: n = 7, BD-II: n = 15, BD-NOS: n = 12. Error bars representing standard error. ACC, anterior cingulate cortex; BD, bipolar disorder; BD-I, bipolar I disorder; BD-II, bipolar II disorder; BD-NOS, bipolar disorder not otherwise specified; EMM, estimated marginal means.
p-Values were adjusted for multiple comparisons using the false discovery approach (FDR).
ACC, anterior cingulate cortex; BD-I, bipolar I disorder; BD-II, bipolar II disorder; BD-NOS, bipolar disorder not otherwise specified; EMM, estimated marginal means; FDR, false discovery rate; ROI, region of interest; sgCC, subgenual cingulate cortex; vlPFC, ventrolateral prefrontal cortex; vmPFC, ventromedial prefrontal cortex.
Sensitivity analysis excluding participants with a lifetime history of lithium use identified significant differences between groups in terms of uncorrected ACC thickness (F = 4.5, p = 0.021, η2 = 0.250) with reduced thickness in BD-II in comparison with BD-NOS (p = 0.006 [uncorrected], d = 1.12) (Fig. 1).
Whole brain analysis
There were no significant whole brain differences in terms of cortical volume. In terms of cortical thickness, there were significant clusters in the left SFG (cluster-wise p [CWP] = 0.0061), left CMFG (CWP = 0.0206), and right SFG (CWP = 0.0285) (Table 4). The left SFG corresponds predominantly to BA 6 and 32, the left CMFG encompasses BA 6 and 44, while the right SFG corresponds mainly to BA 6, 32, 24, and 8. When accounting for sex and controlling for age, EMM from these clusters identified lower cortical thickness in BD-II compared to BD-I and BD-NOS (Fig. 2).
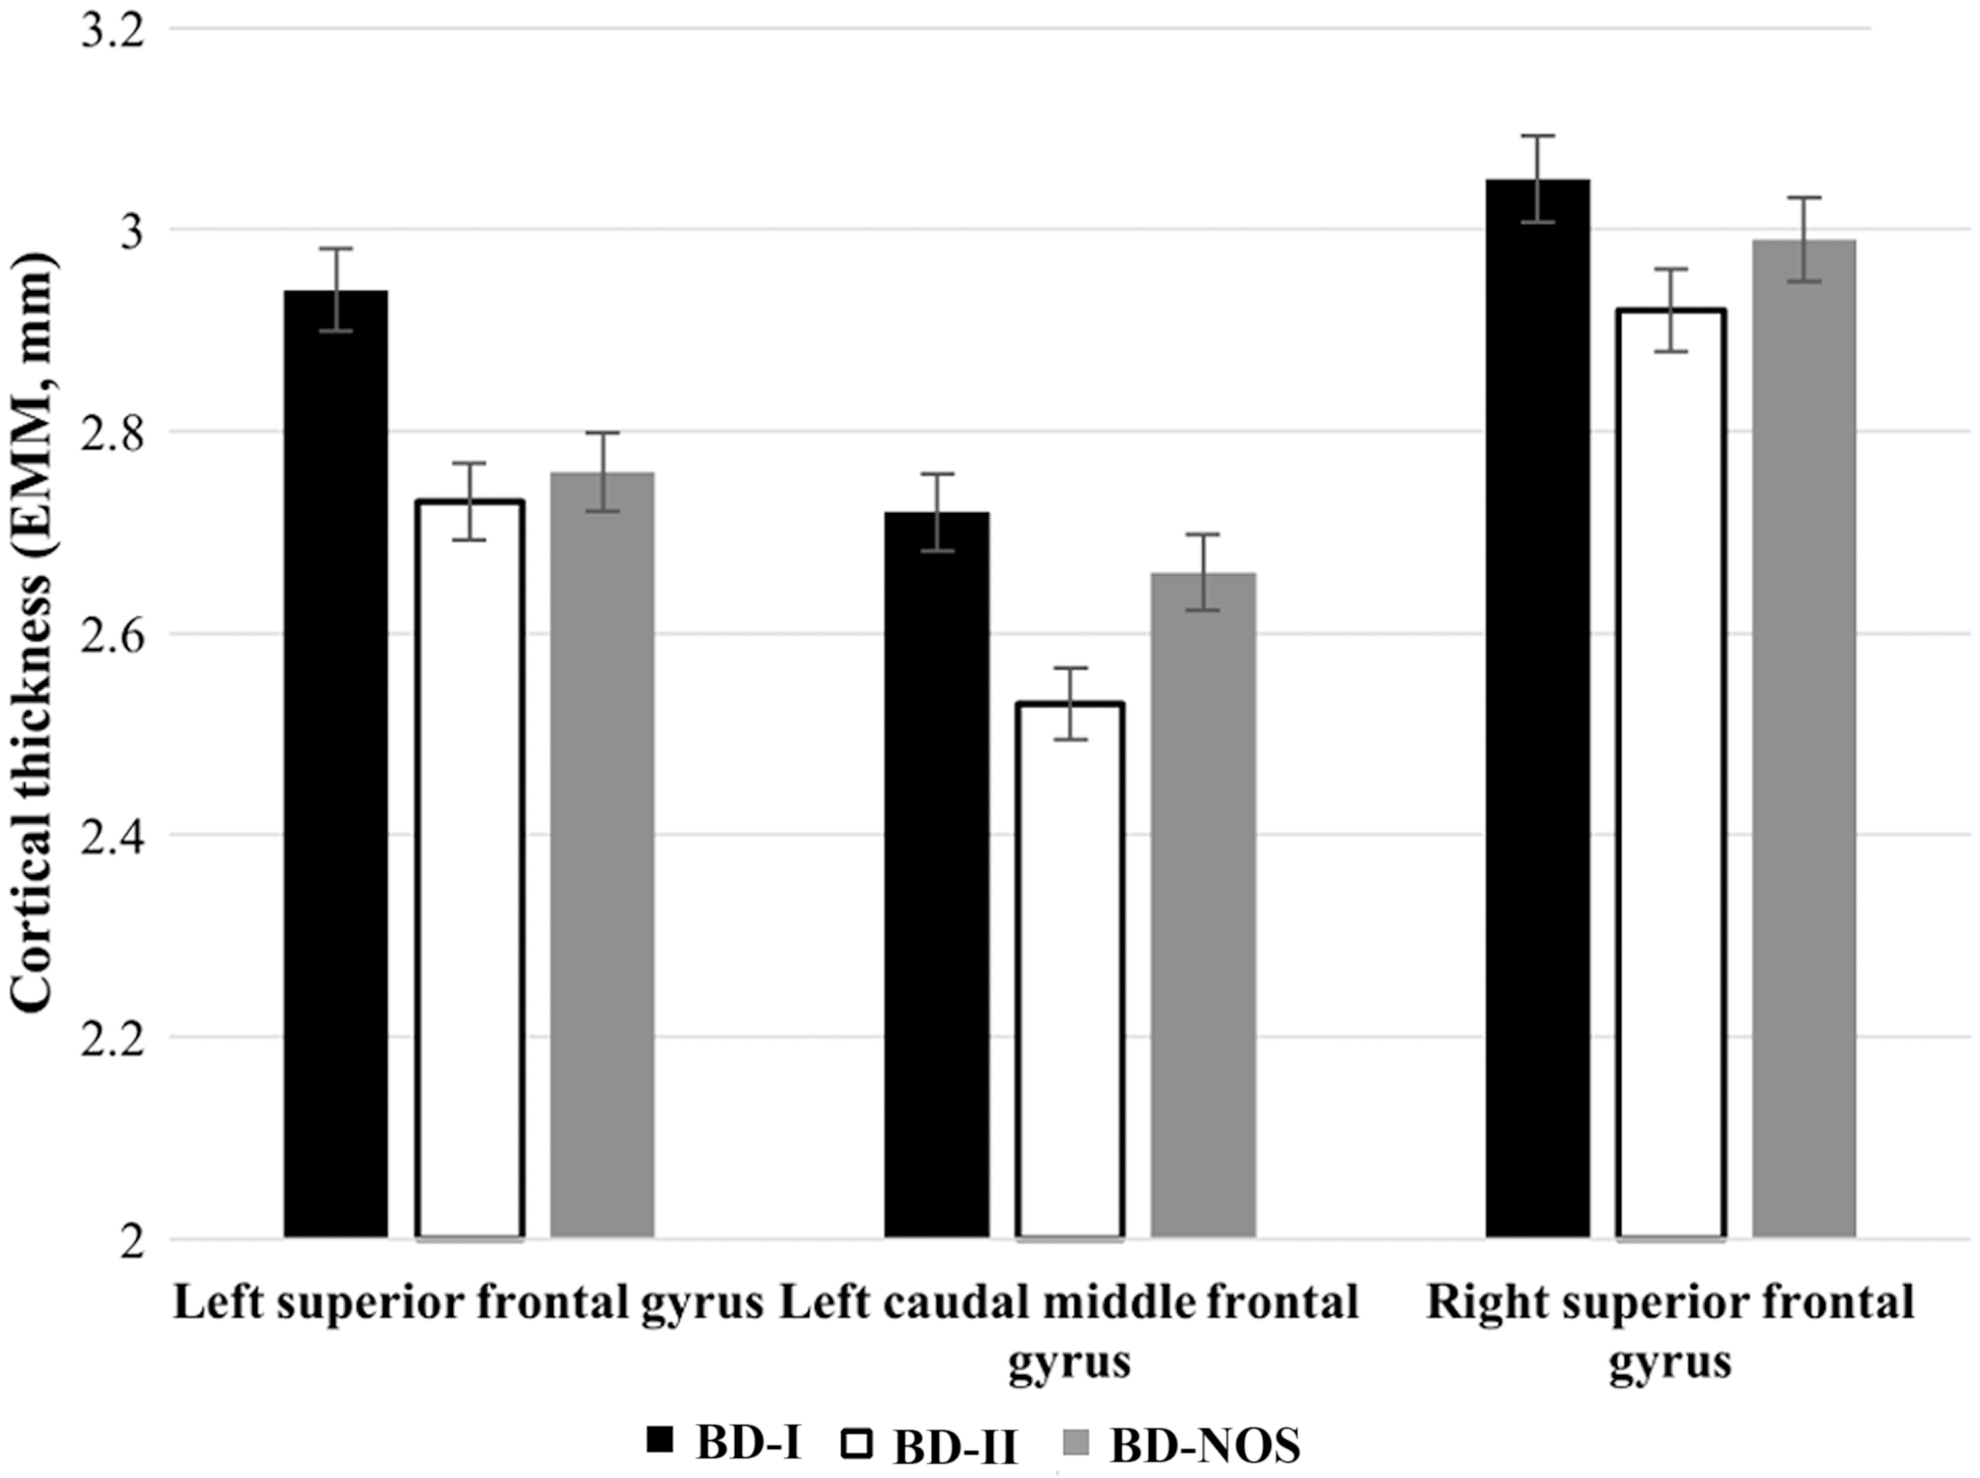
EMM for clusters identified in whole brain analysis for cortical thickness among adolescents with Bipolar Disorder. Post hoc pairwise comparison: Left SFG: BD-I versus BD-II: uncorrected p = 0.001. BD-I versus BD-NOS: uncorrected p = 0.006. BD-II versus BD-NOS: uncorrected p = 0.49. Left CMFG: BD-I versus BD-II: uncorrected p < 0.001. BD-I versus BD-NOS: uncorrected p = 0.203. BD-II versus BD-NOS: uncorrected p = 0.005. Right SFG: BD-I versus BD-II: uncorrected p = 0.001. BD-I versus BD-NOS: uncorrected p = 0.052. BD-II versus BD-NOS: uncorrected p = 0.087. BD-I: n = 14, BD-II: n = 16, BD-NOS: n = 14. Error bars representing standard error. BD, bipolar disorder; BD-I, bipolar I disorder; BD-II, bipolar II disorder; BD-NOS, bipolar disorder not otherwise specified; CMFG, caudal middle frontal gyrus; EMM, estimated marginal means; SFG, superior frontal gyrus.
CWP, cluster-wise p-value; L, left; R, right.
A post hoc analysis compared the BD sample with 42 age- and sex-matched HCs (17.13 ± 1.32 years old, p = 0.092; 57.14% female; p = 0.976). There were statistically significant group differences in terms of cortical thickness for all regions examined: left SFG (F = 4.42, p = 0.006, η2 = 0.14) (uncorrected) (pairwise comparisons: HC vs. BD-I: p = 0.378, d = 0.14 HC vs. BD-II: p = 0.002*, d = 0.88 HC vs. BD-NOS: p = 0.023*, d = 0.82) (uncorrected), right SFG (F = 6.17, p = 0.001, η2 = 0.18) (uncorrected) (pairwise comparisons: HC vs. BD-I: p = 0.579, d = 0.30 HC vs. BD-II: p < 0001*, d = 1.10 HC vs. BD-NOS: p = 0.098, d = 0.65) (uncorrected), and left CMFG (F = 5.18, p = 0.003, η2 = 0.16) (uncorrected) (pairwise comparisons: HC vs. BD-I: p = 0.677, d = 0.31 HC vs. BD-II: p < 0001*, d = 1.24 HC vs. BD-NOS: p = 0.297, d = 0.49) (uncorrected). EMM found greater cortical thickness in the HC group than in the BD groups for all clusters examined.
Discussion
The aim of this preliminary study was to investigate structural brain differences across BD subtypes in a group of adolescents and young adults. Overall, very limited differences were identified between the subtypes. The finding of reduced ACC cortical thickness in BD-II in comparison to BD-I and BD-NOS in ROI analyses did not survive correction for multiple comparisons. Whole brain analyses identified three clusters, right and left SFG and left CMFG, with reduced cortical thickness in all three regions in BD-II compared with BD-I and BD-NOS. Based on an exploratory comparison with HCs, undertaken to provide context for the findings, a pattern was observed whereby BD-II was most anomalous.
Our results differ from prior findings in middle-aged adults showing reduced thickness and volume in frontal regions in BD-I compared with BD-II (Ha et al. 2009; Maller et al. 2014; Abé et al. 2015). One potential explanation for this discrepancy is that the subtype-related patterns described in adult studies could emerge later during the course of illness, as a consequence of development and/or neuroprogression. Neuroprogression is defined as structural and functional reorganization that takes place in the context of illness due to epiphenomena of recurrent episodes (Berk et al. 2011). The literature on progressive neurostructural changes in adults with BD is limited with mixed results (Schneider et al. 2012; Passos et al. 2016). Some studies suggest progressive structural deficits (Lyoo et al. 2006; Foland-Ross et al. 2011) while others infer that neurostructural deficits in BD are already present by early adulthood (Sani et al. 2016). Neuroprogression has also been associated with number of manic episodes (Passos et al. 2016), which could explain why the greater GM deficits found in BD-I adults were not seen in the present sample of BD youth. Importantly the cross-sectional nature of this study precludes testing or validation of cortical thinning in this population.
Moreover, the impact of ongoing neurodevelopment in older adolescents and young adults with the various BD subtypes is unknown and may be implicated in our cross-sectional findings. Normal loss/pruning of GM occurs in adolescence and is thought to follow a characteristic inverted U-shape curve, with distinctive peak periods in various brain regions and maturation of the PFC occurring only at the beginning of adulthood (Gogtay et al. 2004). Therefore, regions hypothesized to be central to BD are thought to mature only toward the end of adolescence, and possibly at a later age than that of the participants in the present study. Importantly, prior longitudinal studies have found abnormal developmental trajectories among adolescents with BD-I, with GM volume contraction in anterior paralimbic and heteromodal regions, along with volume loss and accelerated degeneration of the sgCC and ventral prefrontal regions (Gogtay et al. 2007; Najt et al. 2016).
The interplay between neurodevelopment and neuroprogression in late adolescence and early adulthood in subjects with BD-I may lead to greater GM volume and cortical thickness loss than in other BD subtypes, leading to the patterns identified in adult subtype studies. Of note, the largest study in young adults under 25 years did not identify cortical thickness or surface area differences between BD-I and BD-II after correction for multiple comparisons, although mean age and age distribution of participants is unspecified, which limits comparison with the current study. Furthermore, most sites participating in the ENIGMA study excluded participants under 18 years of age (Hibar et al. 2018). Youth with BD in the current study already had reduced cortical thickness in comparison with HCs in regions found to differ between the subtypes.
Furthermore, 100% of our sample has early-onset BD (i.e., <18 years old), adult BD studies combine participants with early-onset and adult-onset, a factor that may also contribute to the discrepancy between our findings and those of prior studies in adults. Indeed, early-onset BD has been associated with a more chronic course and greater functional impairment, which suggests that our cohort may represent a more severe subtype (Perlis et al. 2004, 2009). Although GM differences across age-of-onset groups are unknown, white matter microstructural differences between pediatric and adult onset BD support neurobiological differences (Lu et al. 2012). Moreover, contrasting with adults, diagnostic conversion from BD-NOS to BD-I or BD-II is common in adolescents (Birmaher et al. 2009; Axelson et al. 2011).
The lack of between-subtype differences in amygdala volume in the current study could be due to a lack of power or to a true shared pathophysiology between the subtypes. A recent study based on an overall BD versus HC contrast in the current sample did not identify differences in amygdala volume (Mitchell et al. 2018). This could be due to the fact that this sample is older than the samples in which BD versus HC amygdala volume differences were found (Pfeifer et al. 2008). Indeed, studies regarding amygdala volumes in adults with BD are inconsistent, such that age appears to be an important factor (Hajek et al. 2009).
Although preliminary and to be interpreted with caution, it is worth noting that both the ROI analysis and the whole brain analysis yielded convergent findings of reduced cortical thickness in BD-II in comparison to the other subtypes. The regions identified in whole brain exploratory analysis, right and left SFG and left CMFG, have been previously associated with cognitive control and working memory (du Boisgueheneuc et al. 2006; Li et al. 2013). Neurocognitive impairment in BD subjects and its functional impact has been consistently described in literature (Robinson et al. 2006; Li et al. 2012; Pålsson et al. 2013; Best et al. 2017). The CMFG corresponds to the DLPFC, which is thought to have a pivotal role in cognitive and behavioral control (MacDonald et al. 2000; Miller 2000; Koechlin et al. 2003). Although the DLPFC is not prominent in models of BD, which focus more so on ventral regions (Strakowski et al. 2012; Phillips and Swartz 2014), the DLPFC is central in models of depression pathophysiology (Koenigs and Grafman 2009) and is a treatment target (Fregni et al. 2006; O'Reardon et al. 2007; Fales et al. 2009; Lefaucheur et al. 2014). Importantly, cortical thinning of prefrontal regions and especially the bilateral SFG and CMFG compared to controls has been associated with more previous depressive episodes (Tu et al. 2012).
In light of the above findings in major depressive disorder (MDD), it is noteworthy that adults with BD-II spend more time in depressive states than those with BD-I (Judd et al. 2003). Similarly, a large prospective study found that youth with BD-I and BD-NOS spend 5.5% of time in major depressive episodes, whereas those with BD-II spend on average 12.4% of the follow-up time in major depressive episodes (Birmaher et al. 2009). This study found thinner cortices in BD-II than in BD-I and BD-NOS in regions thought to be involved in depressive pathology, which could cautiously be related to the greater longitudinal burden of depression in BD-II participants, although further study is needed.
In addition, the cingulate cortex has been implicated in integration of emotional processing and regulation, given its position at the intersection between the dorsal and ventral prefrontal regions (Fountoulakis et al. 2008; Strakowski et al. 2012; Gasquoine 2013; Phillips and Swartz 2014). The cingulate cortex has also been previously implicated in the pathophysiology of depression and involved in negative emotional processing in adolescents with MDD (Connolly et al. 2013). Reduced left sgCC volume in MDD, especially in familial depression has been described in a meta-analysis, the association being stronger with MDD than with BD (Hajek et al. 2008a; Hajek et al 2008b). Smaller ACC in MDD has also been found to differentiate subjects with MDD from those with BD-I, both in adults and adolescents (MacMaster et al. 2014; Redlich et al. 2014). Although this cross-sectional study cannot examine this hypothesis directly, and intake and lifetime worst depression scores did not vary between groups, it remains possible that greater prospective depression symptom burden in the BD-II group compared with the other two groups could be implicated in findings.
In addition to differential burden of depression symptoms, BD-II participants in our study were significantly less likely to have been prescribed lithium in comparison to those with BD-I. Although this must be interpreted cautiously due to the particularly small sample size, when restricting analyses to participants without lifetime exposure to lithium, there were significant subtype-related differences in ACC thickness only between BD-II and BD-NOS. Lithium has been found to normalize regional brain volumes in BD (Hafeman et al. 2012). Specifically, one study reports on lithium increasing cingulate cortex volumes in adolescents with BD (Baloch et al. 2010), a finding that converges with the present study.
Strengths and limitations
The primary analyses examined relatively small groups, which makes this study susceptible to type II error. This applies in particular to the lithium sensitivity analysis, which should be considered preliminary and interpreted tentatively. The cross-sectional nature of this study is also a limitation as it precludes inferences regarding the direction of the observed associations, and precludes us from examining hypotheses regarding potential roles of neurodevelopment and neuroprogression. The combination of older adolescents and young adults may have created heterogeneity, although the standard deviation for age is under 2 years. Furthermore, information regarding longitudinal course of symptoms was not collected in this sample, precluding analyses addressing the impact of longitudinal disease burden as discussed above.
Similar to representative epidemiologic studies and clinical studies (Frias et al. 2015; Kozloff et al. 2010), our sample had high rates of comorbidity. There was also heterogeneity in terms of medication. This overall heterogeneity may have reduced signal detection. That there were no significant differences in comorbidities and most medications (except lithium, as addressed through sensitivity analyses), the impact of this heterogeneity did not appear to be meaningfully different across the BD subtypes. These limitations need to be balanced against the limitation of the literature thus far; to our knowledge this is the only study investigating structural differences between BD-I, BD-II, and BD-NOS subtypes in youth.
Conclusions
In conclusion, this study identified modest neurostructural differences across BD subtypes among youth. Those with BD-II in this study had thinner lateral prefrontal cortices and ACC, which may be associated with longitudinal burden of depressive symptomatology previously identified in this population. Further neurostructural differences between subtypes may emerge later during the course of illness, with repeated episodes of mania. Future studies examining BD subtypes in youth in relation to other neuroimaging phenotypes, ideally enrolling larger samples, and integrating other biomarkers, are warranted. Future studies using a longitudinal approach exploring brain development in the early stages of BD subtypes may elucidate subtype brain structural differences and their evolution. Furthermore, a longitudinal design would allow to test whether neural phenotypes defined by structural brain differences forecast symptom progression and course of illness.
Clinical Significance
Modest neurostructural difference were found between youth with BD subtypes early in course of illness, which taken in the context of findings of greater GM deficits in middle-aged adults with BD-II than BD-I may suggest future neuroprogression in BD with repeated episodes. Thinner cortices in BD-II may putatively reflect the impact of longitudinal depression burden and/or less exposure to lithium. This study builds on previous findings suggesting comparable impairment across the BD spectrum in youth.
Footnotes
Acknowledgments
We would like to thank the staff at the Center for Youth Bipolar (CYBD) and all participants and families for their time.
Disclosures
S.T., A.H.I., R.H.B.M., L.F., B.J.M., and B.I.G. do not have any conflicts to disclose. A.W.S.M. is currently employed by the Canadian Imaging Research Centre.
Supplementary Material
Supplementary Figure S1
References
Supplementary Material
Please find the following supplemental material available below.
For Open Access articles published under a Creative Commons License, all supplemental material carries the same license as the article it is associated with.
For non-Open Access articles published, all supplemental material carries a non-exclusive license, and permission requests for re-use of supplemental material or any part of supplemental material shall be sent directly to the copyright owner as specified in the copyright notice associated with the article.