
Abstract
Objectives:
This study validates the caregiver-rated Pediatric Acute-onset Neuropsychiatric Syndrome (PANS) Global Impairment Score (GIS), a single-item, 0–100 scale, for use in PANS.
Methods:
We collected longitudinal data from community patients meeting PANS criteria. We included 128 patients with 1926 GISs, each from a unique clinic visit. To assess discriminant validity, we compared GISs from patients with PANS with scores from a population of healthy controls. To evaluate external validity, we compared global impairment with a clinician-reported global measure—the Child Global Assessment Scale (CGAS)—using the Bland–Altman plots and correlation coefficients. Then, we evaluated associations between the PANS GIS and symptom-specific disease severity variables by fitting mixed models with repeated measures.
Results:
The GIS shows excellent discriminant validity, distinguishing patients with PANS from healthy controls. The scores on the GIS show an acceptable level of agreement with the clinician-reported CGAS. The regression line in the Bland–Altman plot had a positive slope, indicating that parents tend to report higher disease severity than clinicians at higher levels of disease severity. Correlation was higher during disease remissions than during disease flares (r = −0.69 vs. r = −0.48). All disease severity scales predicted GIS in the expected direction.
Conclusion:
The GIS has excellent discriminant validity and acceptable construct validity.
Introduction
P
The diversity of inciting events, PANS symptoms, and severity complicates treatment. In response, some PANS practitioners treat patients using multiple modalities in a multidisciplinary clinic in which psychiatrists treat neuropsychiatric symptoms while other specialists address infections and inflammation (Frankovich et al. 2015; Cooperstock et al. 2017; Thienemann et al. 2017). PANS symptom heterogeneity also complicates research because it is difficult to compare disease severity across patients and within a patient over time. For example, two patients with different symptoms may have equivalent impairment: one patient's impairment may be driven by severe OCD symptoms, whereas the other's impairment is driven by severe generalized anxiety. Equally impairing symptoms may change flare to flare within an individual (e.g., an individual experiences severe OCD during one disease flare and severe generalized anxiety with little OCD during the second flare). Symptom-specific ratings alone would not capture the same impairment level. Without a global measure of patient status, it is difficult to track disease impact.
Also, some existing global measures of psychiatric disease severity focus on the clinician's assessment. The caregiver and the clinician may not perfectly agree on a child's disease severity because they bring to the clinic different sets of knowledge. While the clinician carries the knowledge of how this disease has manifested itself in previous patients, the caregiver—especially if he or she is a parent—holds intimate knowledge of how the disease has affected this patient in particular. These sets of knowledge can complement each other even as (or especially because) they can conflict with each other.
To address these issues, experienced PANS/PANDAS clinicians Dr. James Leckman of the Yale University and Dr. Tanya Murphy of the University of South Florida developed the PANS Global Impairment Score (GIS), a single-item caregiver- or patient-reported assessment of impairment that has been previously reported but never described or validated (Brown et al. 2017). The score is not designed to replace symptom-specific measures of disease severity or clinician reports. Rather, as a caregiver-reported score, it is designed to measure a caregiver's perspective of a child's PANS illness, which could add to symptom-specific measures and to a clinician's global assessment. The GIS, if valid and reliable, could be useful clinically or potentially in research settings as a component of an outcome in prospective studies. The GIS would also be useful for basic science studies as a continuous measure of patient status filled out on the same day the patient has biological examination, such as a blood draw or brain magnetic resonance imaging. Finally, the GIS is easy for caregivers to fill out, lending itself to clinical use.
This study seeks to validate the GIS for clinical use in PANS by assessing the discriminant validity, construct validity, and sensitivity to change. Specifically, we aimed to (1) assess how well the parent-reported GIS agreed with the clinician-reported Child Global Assessment Score and (2) test the assumption that most—if not all—PANS symptoms would influence the PANS GIS.
Methods
Setting
Our multidisciplinary PANS clinic serves community-based families affected by PANS and PANDAS. Between September 2012, when the clinic opened, and December 2017, the clinic has accepted and tracked 287 patients. Patients are diagnosed with PANS, PANDAS, both, or neither based on published research criteria (Swedo et al. 1998, 2012, 2017). One important difference between PANS and PANDAS is that PANDAS requires a preceding streptococcal infection, whereas PANS is agnostic to preceding events. In the Stanford PANS clinic, treatment is coordinated between practitioners of various disciplines (psychiatry, psychology, primary care, rheumatology, immunology, ENT, and occasionally, neurology), as well as a social work psychotherapist and an education specialist (Frankovich et al. 2015).
Data sources
We draw measures of disease severity from a questionnaire that the patient or parent fills out before each appointment with the PANS clinic. Patients have different numbers and frequencies of visits, so we have variable amounts of data for each patient.
The questionnaire has included the following scales: (1a) the Child Yale-Brown Obsessive Compulsive Scale (Scahill et al. 1997), (1b) a 0- to 15-point OCD scale (likelihood scale), (2) the Yale Global Tic Severity Scale (Leckman et al. 1989), (3) an Avoidant/Restrictive Food Intake symptom scale (unpublished data), (4) the Columbia Impairment Score (Bird et al. 1993), (5) the Caregiver Burden Inventory (Novak and Guest 1989), (6) the Modified Overt Aggression Scale (Sorgi et al. 1991), and (7) a Fibromyalgia scale measuring pain, fatigue, and malaise (Wolfe et al. 2010; Ting et al. 2016). All scales have previously been validated with the exception of the OCD and the Avoidant/Restrictive Food Intake symptom scales, both of which were adapted from prior studies, but neither of which was formally validated (Murphy et al. 1982; Insel et al. 1983). A symptom severity checklist was added to the questionnaire in April 2017. This checklist prompts parents to rate the severity during the past week of 30 symptoms on a 0–4 scale. Two other measures of disease severity are clinician-reported: disease flare status (yes/no) and the Child Global Assessment Scale (CGAS) (Shaffer et al. 1983; Brown et al. 2017). The CGAS measures child and adolescent psychosocial function due to psychiatric illness. Scores range from 100 (lowest impairment) to 1 (highest impairment). A score of 41–50 reflects a “moderate degree of interference in functioning in most social areas or severe impairment of functioning in one area.”
We show the PANS GIS prompt in Table 1. A short statement first primes caregivers to think about certain aspects of a child's disease. Five anchor statements (one every 20 points) then describe patient functioning within each category of scores. Caregivers report a score from 0 to 100 using a horizontal slide bar. The GIS scaled from 0 to 50 until February 2015, and then, it was changed to scale from 0 to 100. Zero represents no impairment and 100 represents the highest level of impairment. For these analyses, we scaled all scores to range from 0 to 100 by multiplying older scores by two. A score between 41 and 60 reflects “Moderate impairment (due to any PANS symptom, psychiatric, or nonpsychiatric) with a definite decrease in ability to function on their own. Symptoms would lead to seeking psychiatric and medical treatments and services.” In our clinic, the global impairment question is only available in English.
We also define disease flare status (flare, remission, or unclear) at each clinic visit as previously described (Brown et al. 2017). A research assistant defined flare status for visits between September 1, 2012, and Spring 2017. Since Spring 2017, clinicians have defined flare status at the end of each clinic visit, basing their decisions on a comprehensive clinical visit that includes review of the patient questionnaire, which includes the GIS. Briefly, a flare is defined as a discrete episode of neuropsychiatric symptoms that meet the PANS/PANDAS criteria.
Stanford University's Human Subjects Institutional Review Board approved this research. Parents provided written informed consent, and patients provided written assent or consent.
Inclusion/exclusion criteria
We show an inclusion flowchart in Figure 1. Inclusion criteria for this study were as follows: at least one GIS, diagnosis of PANS and/or PANDAS, patient younger than 18 years at first clinic visit, and family lives within 90 miles of clinic and in one of seven counties surrounding the San Francisco Bay (Marin, Contra Costa, San Francisco, Alameda, San Mateo, Santa Clara, and Santa Cruz). We also included data from 63 healthy controls recruited from the surrounding community through fliers and by asking families in our clinic to recruit friends and neighbors of approximately the same age as their child(ren). All controls filled out an extensive questionnaire.

Inclusion/exclusion criteria for a study seeking to validate the global impairment score for use in children and adolescents diagnosed with PANS. Before entering our PANS clinic, patients are prescreened for likelihood of having PANS by the following: family patient questionnaire, review of outside records and/or discussion with primary medical doctor. Patients must have had an established primary medical doctor for more than 3 years to gain entry into the PANS clinic. PANS, Pediatric Acute-onset Neuropsychiatric Syndrome.
Missing data
Our patient questionnaire was changed in Spring 2017. A few symptom scales used since the beginning of our clinic were replaced, and additional scales were added. Each variable was measured for unique—often overlapping—populations of patients with PANS. This reality limits the type of analysis that we can run; germanely, it prevents us from running multivariate regressions with all symptom scales as predictors.
Statistical analyses
We present descriptive statistics and preliminary normative data for GISs during disease flare and disease remission (Table 2). We assessed the discriminant validity by comparing GIS in our population of PANS patients with scores in a population of healthy controls (using t-tests for normally distributed data and Wilcoxon rank-sum tests for non-normally distributed data). We expected that GIS would clearly distinguish the two groups.
Psychiatric symptom onset is defined as the date of the first event of sudden-onset psychiatric symptoms, which may have met PANS criteria, but, in many cases, we cannot say with certainty. These data were determined through conversations with parents and primary medical doctors and through chart review.
A PANS course of illness can change over time. For instance, after one PANS flare that has subsided, all courses are, by definition, single episode. Also, relapsing/remitting courses can become chronic/static. For the purpose of these data, we used the most recent information to categorize the patients.
Follow-up time is the time from the patient's first clinic visit to the latest visit at the time of data analysis.
IQR, interquartile range; PANDAS, Pediatric Autoimmune Neuropsychiatric Disorders Associated with Streptococcal Infections; PANS, Pediatric Acute-onset Neuropsychiatric Syndrome; SD, standard deviation.
Our external validity analyses draw from the validation of the Bath Ankylosing Spondylitis Global Scale, which assessed correlations between the scale and similar but not identical clinical measures (Jones et al. 1996; Calin et al. 1999). The study then evaluated the scale longitudinally, analyzing test–retest reliability and sensitivity to change (Jones et al. 1996). This validation study followed good psychometric practice: validation studies should clearly define, a priori, the theoretical construct measured. Then, the study should statistically assess how well the measure approximates the construct (Borsboom 2006; Holmbeck and Devine 2009). If the measure is used longitudinally, a validation study should analyze the reliability and sensitivity to change.
We hypothesized that the PANS GIS measures a similar, but not identical, construct to the CGAS, a practitioner-reported measure of psychosocial functioning. To compare the two variables, we calculated the Spearman rank-order correlation coefficients separately for flare and remission, using data from the first flare and first remission for each patient for whom we have data on both the GIS and CGAS. We visualized the agreement between the GIS and CGAS in the Bland–Altman plot (Fig. 2). Bland–Altman plots are often used to assess the agreement between two measures. Each pair of measurements on the same unit of observation is included as a point in a scatter plot, where the x-axis is the average of the two measurements and the y-axis is the difference between measurements. Generally, studies using Bland–Altman plots report the average y-value and 95% limits of agreement (the y-values within which 95% of observations are expected to fall). If two measurements agree perfectly (and both measurements are on the same scale), all points will fall on y = 0. The closer the average y-value is to 0, the better the average agreement. Narrower limits of agreement indicate better range of agreement.
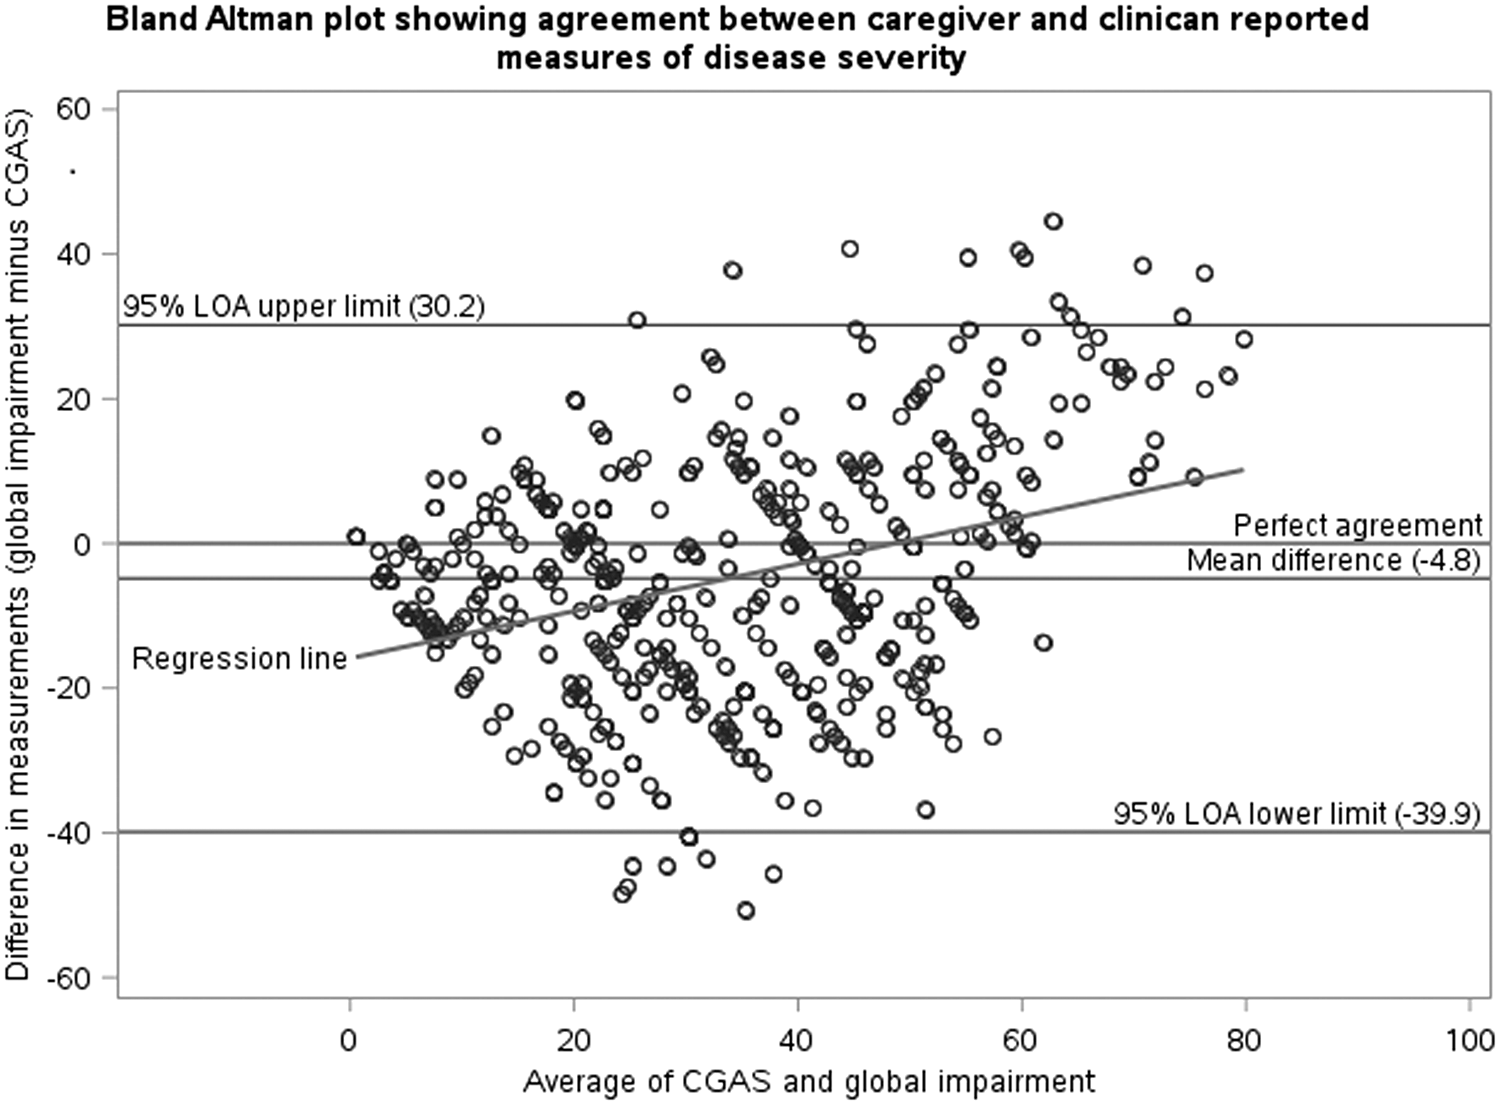
The Bland–Altman plot comparing global impairment with the practitioner-reported Child Global Assessment Scale. Data come from visits (n = 95 patients with 471 visits) with data on global impairment and Child Global Assessment Scale. In this Bland–Altman plot, the y-axis represents the difference between the global impairment score and a scaled version of the Child Global Assessment Scale. Negative y-values indicate that the clinician rated the patient as more impaired than the caregiver; positive values indicate that the clinician rated the patient as less impaired than the caregiver. A value of y = 0 indicates perfect agreement. Values farther from 0 indicate less agreement. The x-axis is the average of the two scores. Larger x-axis values indicate more impairment. The regression line shows the association between the y-axis (difference in ratings) and x-axis (impairment). In this case, as impairment increases, the difference in ratings becomes more positive, indicating that the clinician rates patients as less impaired than the caregiver at higher values of average score. The 95% LOAs are the limits within which the data predict that 95% of observations will fall. The 95% LOA account for correlations within patient. In this case, accounting for these correlations widens the limits. LOAs, limits of agreement.
Our Bland–Altman plot includes all observations for which we have data on both the GIS and CGAS (471 observations for 95 patients). We accounted for correlations within patient by calculating 95% Limits of Agreement using the Bland and Altman's algorithm for assessing the agreement with multiple observations per individual (Bland and Altman 2007). Since the CGAS runs from 100 to 1, whereas GIS runs from 0 to 100, we scaled CGAS to range from 0 to 100 using Equation (1).
We then assessed the agreement using categorized scores. Since the GIS and CGAS have similar anchor points, we categorized the scores based on the anchor statement into which the score falls. We gave a value of 0 to GIS of 0 and CGAS scores of 100; we gave a value of 1 to GIS of 1–20 and CGAS scores of 99–80 and so on. Using the categorical data, we report the number and percentage of observations in which (1) caregiver and clinician agree, (2) caregiver reports greater severity, and (3) clinician reports greater severity. We then report correlations between disagreement and other variables (Table 3). We hypothesized, a priori, that the following variables are associated with disagreement: male patient sex, high caregiver social burden, and chronic/static disease course. After initial analyses, we hypothesized (post hoc) that two Fibromyalgia scores (Symptom Severity Scale and Widespread Pain Index) would be associated with greater disagreement because the CGAS theoretically only responds to psychiatric impairment, whereas the global impairment responds to all impairments (including pain and fatigue). In these analyses, the outcome is categorical agreement—agree, parent higher, or clinician higher. Outcomes can be either categorical or continuous. All analyses used the generalized estimating equation models with repeated measures.
Data come from clinic 454 visits during which PANS flare status was defined, the clinician gave a Child Global Assessment Scale rating, and the parent gave a global impairment rating. Here, we present the agreement between the two measures separately by flare and remission. These data are repeated measurements of 95 patients. We do not take correlations within patient into account for this table because these data are presented to generate hypotheses, not to test hypotheses.
PANS, Pediatric Acute-onset Neuropsychiatric Syndrome.
Our second main expectation was that multiple symptoms influence the GIS; therefore, all disease scales should predict the GIS. One provider hypothesized that male sex predicts increased GIS (due to the clinical experience). We also hypothesized that age at symptom onset does not predict the GIS, but the time between psychiatric symptom onset and first clinic appointment does due to the hypothesis that the disease is more difficult to treat if treatment is delayed following symptom onset. To test these hypotheses, we fitted mixed models with repeated measures in which the outcome was GIS. To facilitate interpretation, we standardized all predictor variables (with two exceptions, explained in the footnote of Table 4) to have a mean of 0 and a standard deviation of 1. From each mixed model, we report the number of observations used and the effect estimate and 95% confidence interval (CI) (Table 4). In this analysis, we modeled intercept as random due to theoretical considerations (impairment at entry into clinic is heterogeneous) and because doing so resulted in a smaller Akaike's Information Criterion, Corrected (AICC). We used an unstructured covariance structure because it resulted in the smallest AICC of all covariance structures tested.
All models evaluate the predicted effect that an increase in the variable in the first column has on the global impairment score.
Number of observations is highly variable because the clinic has collected different disease severity variables over the course of the past 5 years.
For all variables except years in clinic and flare, the effect estimate refers to the change in global impairment score predicted by a one standard deviation increase in the predictor variable.
ARFI, Avoidant or Restrictive Food Intake; CBI, Caregiver Burden Inventory; CI, confidence interval; CIS, Columbia Impairment Scale; CY-BOCS, Child Yale-Brown Obsessive Compulsive Scale; MOAS, Modified Overt Aggression Scale; OCD, Obsessive Compulsive Disorder; PANS, Pediatric Acute-onset Neuropsychiatric Syndrome; SSS, Fibromyalgia symptom severity scale; WPI, Widespread Pain Index; YGTSS, Yale Global Tic Severity Scale.
We stored data on a RedCap server, and we performed analyses on the SAS University Edition (Cary, NC) (Harris et al. 2009).
Results
The final study sample included 128 children and adolescents with PANS with a total of 1926 PANS GISs (median 12 scores, interquartile range [IQR] 7–20 scores) and 63 healthy controls (Table 1). Seventy-eight of 128 patients (61%) were male compared with 26 of 59 healthy controls (44%) with data on sex; average age at onset of psychiatric symptoms was 8.5 years (standard deviation 3.5 years). Average age at first clinic appointment was 10.4 years (standard deviation 3.6 years). In healthy controls, average age at data collection was 11.8 years (standard deviation 4.2 years).
The GIS during the first flare was high, approximating a normal distribution (mean = 48.4, standard deviation = 24.1); the GIS during the first remission was rated less severe, with a right-skewed distribution (median = 20, IQR 10–40). Five of 118 (4%) patients had a score of 0 during their first remission. In our healthy child population, however, the median score was 0 (IQR 0–0). Caregivers of 60 of the 63 (95%) healthy children reported a score of 0. It is highly unlikely that we would have found this difference by chance alone (p < 0.0001).
The GIS correlated moderately with the CGAS during the first flare captured in our clinic (Spearman's correlation coefficient = −0.48, p < 0.0001) and with the first remission captured in our clinic (Spearman's correlation coefficient = −0.69, p < 0.0001). We graphed the agreement in the Bland–Altman plot (Fig. 2). On average, scaled CGAS values were larger than GISs, indicating that the clinician rated the patient as more impaired than the caregiver did, on average. However, the regression line in Figure 2 indicates that at higher disease severity levels, GISs were higher than scaled CGAS scores. There was no association between disagreement and patient sex, course of illness, the Widespread Pain Index, or caregiver's social burden (data not shown). However, malaise score was associated with disagreement. Caregivers reporting a higher score than clinician predicted a 1.2 point increase in malaise score compared with parent agreeing with clinician (95% CI 0.3–2.1) and a 1.5 point increase in malaise score compared with clinician reporting a higher score than caregiver (95% CI 0.6–2.5).
In our mixed models, the GIS decreased linearly with increasing years engaged in clinic. Each additional year in clinic predicted a 4.7-point decrease in the GIS (95% CI −5.6 to −3.7).
All disease severity variables predicted GIS in the expected direction (Table 4). Flare status predicted GIS most strongly; a flare, compared with remission, predicted a 16.6-point increase in the GIS (95% CI 14.9 − 18.3). The OCD score had the largest effect on the GIS of any disease scale; each standard deviation increase in OCD score predicted a 14.3-point increase in the GIS (95% CI 13.4 − 15.2). All individual symptoms also predicted GIS in the expected direction (Table 4). Of demographic variables, increased age at first clinic visit predicted higher GIS, but no effect was found for age at symptom onset, time between onset and first clinic visit, and patient sex (Table 4).
Discussion
Holmbeck and Devine (2009) provide a checklist for the development of a new measure, which lists four items: (1) establishing a scientific need, (2) “building in” content validity, (3) establishing reliability, and (4) analyzing validity. In this discussion, we respond to each item in turn.
The PANS GIS is scientifically necessary because PANS is a heterogeneous disease that impacts different facets of functioning, which can complicate both treatment and research. The GIS draws from all sources of impairment, outputting a single score that can be used to track overall functioning over time. Similar scales exist in the rheumatology and psychiatry literatures for diseases without objective indices of disease activity (e.g., biomarkers, images, and tissue samples). In rheumatology, researchers often try to measure the current activity of an underlying disease using single-item disease activity indices, which have been employed in juvenile idiopathic arthritis, juvenile ankylosing spondylitis, and lupus (Bombardier et al. 1992; Consolaro et al. 2009; Weiss et al. 2014). Psychiatric research uses disorder-specific and global functional impairment scales (e.g., in studies involving depression, schizophrenia, self-esteem, and childhood mental health issues; Shaffer et al. 1983; Bird et al. 1987; Robins et al. 2001; Kadouri et al. 2007). These measures can help clinicians to monitor the disease activity and function. They can also gauge outcomes in research studies, especially in diseases with heterogeneous symptoms.
The GIS was developed to address this need in PANS/PANDAS research. As it is a single-item scale, we cannot perform confirmatory factor analysis to assess the reliability; therefore, this study focused on discriminant and external validity.
To assess the discriminant validity, we compared GISs in our population with a population of healthy children. Most caregivers of healthy children report a GIS of 0; therefore, the measure discriminates between healthy children and patients with PANS.
We then assessed the external validity, first by evaluating the agreement between the caretaker-rated GIS and the clinician-rated CGAS. The two measures agreed modestly. We found a correlation of −0.69 during disease remission; for reference, a previous study found a correlation of −0.65 between the CGAS and the behavior problem score on the Child Behavioral Checklist (Bird et al. 1987). Interestingly, correlation was tighter during disease remission than flare. To understand this relationship, we graphed the agreement between global impairment and CGAS on the Bland–Altman plot, finding that GISs, on average, were 4.8 points less than a scaled version of the CGAS (possible difference ranges from 100 points less than to 100 points greater than). The 95% confidence limits for agreement ranged from −39 points to +30 points. This confidence limit was wider than expected. Interestingly, a regression line in Figure 2 sloped upwards, indicating that the CGAS reports more severe impairment than the GIS when the average score is low, whereas GISs tend to be higher than CGAS scores when average scores are high. One explanation for this finding could be that parents and clinicians have different banks of knowledge. When a child is doing poorly, the parent may never have seen their child so impaired, leading them to rate the child at the high end of the GIS; however, the clinician has likely seen patients with the same disease doing worse, so they may report more moderate scores. If true, this could explain the tighter correlation found during disease remissions compared with disease flares when children have higher GISs.
Our 95% limits of agreement between clinicians and parents were wider than agreement between health-related quality-of-life scales filled out by parents and their children with skin disease, which found 95% limits of agreement between −25.5/100 and 26.7/100 (Beattie and Lewis-Jones 2006). However, Beattie and Lewis-Jones evaluated identical constructs, whereas we evaluated slightly different constructs. While the GIS prompts caretakers to think about all sources of impairment (including pain and fatigue), the CGAS prompts clinicians to only consider psychosocial impairment due to psychiatric symptoms. Therefore, discordance between the CGAS and GIS may be explained by symptoms such as pain and fatigue, which clinicians often observe in PANS (Leibold et al., under review). We found some evidence to support this hypothesis: when the caretaker reported a higher score than clinician, malaise score, an indicator of pain and fatigue, increased. Clinicians do not typically consider pain, fatigue, and other malaise symptoms when scoring the CGAS. Although pain and fatigue may be a part of the PANS illness, patients can also experience pain or fatigue from another cause. In one example, a patient had abdominal pain due to recent appendicitis. Since the GIS prompts the caregiver to consider pain, the caregiver gave a high score (>50 points). The clinicians noted the high score before their clinic visit and prepared for a moderately impaired child; however, the patient was doing quite well from a PANS standpoint. The clinicians were confused until they learned about the recent appendicitis.
Discordance could also be explained by the fact that caregivers and clinicians have different perspectives on a child's illness. Some evidence suggests that parents and clinicians agree comparably with children on measures of the quality of life (Bastiaansen et al. 2004); however, parents and clinicians do have different perspectives of a child's illness, so their ratings could systematically differ (Achenbach et al. 1987). Therefore, information from multiple informants should be interpreted in concert to provide a comprehensive view of child functioning. Given the above arguments, we believe that there is an acceptable level of agreement between the GIS and CGAS, suggesting that the GIS agrees somewhat with clinician impression of functioning, but from a parental perspective, which the GIS is useful in clinical settings both for getting a sense of the child's impairment and for improving parent–clinician communication regarding the child's impairment. However, we believe that the GIS is not sufficiently refined for use in clinical trials.
The GIS tends to decrease throughout the course of a patient's engagement with the Stanford PANS clinic (Table 4). A decrease of 4.7 points per year is on the lower end of clinical significance. More research is needed on the kinetics of the GIS. Clinical observation does suggest that the disease severity tends to decrease over time (probably through some combination of regression to the mean and effective clinical treatment). This result provides initial evidence that the GIS is reliable as a longitudinal measure.
As expected, increases in all disease severity variables predicted increased GIS. Clinician-defined patient flare status and caregiver-reported OCD score predicted the largest increases in the GIS. Other variables that predicted increased GIS were caregiver-rated Child Yale-Brown Obsessive Compulsive Scale, an Avoidant/Restrictive Food Intake symptom score, the Columbia Impairment Score, the Caregiver Burden Inventory, the Modified Overt Aggression Scale, and Fibromyalgia scales (the Symptom Severity Scale and the Widespread Pain Index). These scales are all caregiver-derived, so common method variance may explain some of the association (Holmbeck and Devine 2009). However, the fact that flare status and CGAS are both clinician-derived discounts this claim.
Based on clinical experience, one provider had expected male patients to have higher GISs than female patients; however, we found no difference based on sex. We also found no effect on the GIS for time between psychiatric symptom onset and first clinic visit, which was surprising considering the hypothesis that the treatment is less effective, the longer it is delayed after PANS onset (Frankovich et al. 2017).
Limitations
Our population, as reported previously, has high socioeconomic status (Farmer et al. 2018). Also, anecdotally, most of the caregivers who filled out the patient questionnaire are mothers. It is possible that caregiver assessment of child functional impairment depends on socioeconomic status and/or caregiver identity.
Other scales could have been used in place of the GIS. For instance, the Clinical Global Impressions scale has been used in a similar context. It is possible that the Clinical Global Impressions scale is more appropriate than the GIS for research studies; however, the purpose of the GIS is to assess the parent's view of their child's illness.
Our correlation between flares and the GIS suffers from circular logic—flare status is determined at least in part by the GIS, so some correlation between the two variables is expected.
We modeled changes in the GIS as linear; however, PANS has been described as a relapsing/remitting disease. We were unable to take into account more complex changes in the GIS in this study.
Future directions
We plan to use the GIS as a continuous measure of patient status measured on the same day a patient gives a biological specimen. This work will allow us to determine whether an immune profile—for example, TNF expression—tracks with global impairment due to PANS.
To further validate the concept of a PANS flare, an inter-rater reliability study could be performed using data from two clinicians who attended the same clinic visit.
Conclusion
The PANS GIS agrees acceptably with clinician-derived measures of disease severity, is responsive to all sources of child impairment, and discriminates between patients with PANS and healthy controls.
Clinical Significance
The GIS assesses a caretaker's perspective of PANS severity and is a useful clinical tool for tracking patients over time. The tool can also be used to improve parent–clinician communication regarding a patient's functional status.
Disclosures
No competing financial interests exist.
Footnotes
Acknowledgments
The authors acknowledge Cristan Farmer, PhD, for her statistical advice, the PANDAS Physicians Network, the Stanford SPARK program, Dr. Susan Swedo, MD, the National Institute of Mental Health, and all the staff and faculty at the Lucile Packard Children's Hospital who make caring for these children possible. We thank Kiki Chang, MD, for his critical review of this article.