
Abstract
Objectives:
We recently found that metformin attenuated weight gain due to mixed dopamine and serotonin receptor antagonists, commonly termed atypical antipsychotics, in children and adolescents with autism spectrum disorder (ASD). Previous studies have found that genetic variation predicts response to metformin in diabetes. In this study, we aimed to assess whether response to metformin for weight gain in this population is associated with variants in five genes previously implicated in metformin response in diabetes.
Methods:
Youth with ASD who experienced significant weight gain while taking mixed receptor antagonist medications were randomly assigned to metformin or placebo for 16 weeks, followed by open-label metformin treatment for 16 weeks. In the 53 participants with available DNA samples, we used a linear, mixed model analysis to assess response in the first 16 weeks of metformin treatment, whether in the randomized or open-label period, based upon genotypes at polymorphisms in five genes previously associated with metformin response in diabetes: ATM, SLC2A2, MATE1, MATE2, and OCT1.
Results:
In the primary analysis, both ATM and OCT1 showed significant effects of genotype on change in body mass index z-scores, the primary outcome measure, during the first 16 weeks of treatment with metformin. No other polymorphism showed a significant difference.
Conclusion:
As has been shown for metformin treatment in diabetes, genetic variation may predict response to metformin for weight gain in youth with ASD treated with mixed receptor antagonists. Further work is needed to replicate these findings and evaluate whether they can be used prospectively to improve outcomes.
Introduction
Metformin hydrochloride is an insulin-sensitizing biguanide that is typically used in type 2 diabetes to suppress gastrointestinal absorption and hepatic production of glucose (Kirpichnikov et al. 2002; Pawlyk et al. 2014). Mixed dopamine and serotonin receptor antagonists (DSRAs) [neuroscience-based nomenclature (Sultan et al. 2018)], such as risperidone and aripiprazole, commonly termed atypical antipsychotic medications, often lead to weight gain in adults and in youth (Allison et al. 1999; Parsons et al. 2009; De Hert et al. 2011; Almandil et al. 2013). Among adults taking mixed DSRAs, metformin leads to significant weight loss and a reduction in body mass index (BMI) (Bjorkhem-Bergman et al. 2011; Wu et al. 2012; de Silva et al. 2016).
Previously, a 16-week randomized controlled trial (RCT) with 39 children and adolescent weight gain due to DSRAs, ages 10–17, found that metformin treatment resulted in a significant reduction in BMI z-score (Klein et al. 2006). Two smaller, open-label trials also reported similar benefits (Morrison et al. 2002; Shin et al. 2009); however, another RCT conducted over 12 weeks did not find metformin to be statistically effective at treating weight gain among children and adolescents taking risperidone (Arman et al. 2008).
We recently conducted a 16-week, placebo-controlled RCT to assess the efficacy of metformin as a treatment for weight gain due to DSRAs in 61 children and adolescents, ages 6–17, with autism spectrum disorder (ASD) (Anagnostou et al. 2016). From baseline to the end of the 16-week treatment phase, metformin compared to placebo led to significantly decreased BMI z-scores and secondary somatic measures, including BMI and weight. We followed the RCT with a 16-week open-label extension that included 52 of the randomized participants (Handen et al. 2017).
During the open-label extension, participants previously taking placebo (30 of the participants) displayed reduced BMI z-scores and significant improvements in secondary somatic measures. The 22 participants randomized to metformin in the RCT maintained their declines in BMI z-scores, but did not show additional declines (Handen et al. 2017). Based on these results, we concluded that metformin treatment among children and adolescents with ASD can be effective in reducing weight gain associated with DSRA medications.
Importantly, there was considerable variability in response to metformin in the RCT and open-label extension. Previous reports have also noted variable response to metformin in diabetes (Pawlyk et al. 2014) and for weight loss (Hui et al. 2019), with genetic variation appearing to play a crucial role (Pawlyk et al. 2014). A genome-wide trait analysis study attributed 21% to 34% of variability in response to metformin in diabetes to numerous genetic variants across the genome (Zhou et al. 2014a).
An improved understanding of the genes and pathways shaping an individual's response to metformin would allow personalized treatment. In this study, we aimed to assess the role of genetic variants in predicting response to metformin in children with ASD taking atypical DSRA medications.
We focused on variants in five genes that were previously associated with metformin response in genome-wide association (GWA) or candidate gene studies. Recent GWA findings from the Metformin Genetics Consortium highlighted an association with a minor C allele variant in the Glucose 2 Transporter gene (GLUT2/SLC2A2) with a 0.17% (p = 6.6 × 10⁻¹⁴) greater reduction in hemoglobin A1c (HbA1c), in response to metformin treatment (Zhou et al. 2016). A GWA study with 1024 patients and a subsequent meta-analysis (n = 3920), with two additional cohorts, identified a strong association (p = 2.9 × 10⁻⁹) between a common single-nucleotide polymorphism (SNP) in the Ataxia Telangiectasia Mutated gene (ATM) and improved glycemic response to metformin (GoDARTS et al. 2011). These findings at ATM were later replicated in multiple populations (van Leeuwen et al. 2012; Zhou et al. 2014b).
ATM encodes a serine/threonine kinase of the phosphoinositide 3-kinase-related protein kinase family that has been proposed as a potential modulator of AMPK activity (GoDARTS et al. 2011; Pawlyk et al. 2014). AMPK activation mediates metformin's effects on liver metabolism, notably the inhibition of gluconeogenesis (Pawlyk et al. 2014). In the presence of double-stranded DNA breaks, ATM induces cell cycle arrest to enable DNA repair. In addition, reports show that patients with ataxia telangiectasia, a condition caused by homozygous loss of function mutations in ATM, have insulin resistance and an increased risk for diabetes (GoDARTS et al. 2011).
Based on findings from candidate gene studies, three genes encoding metformin transporters were also selected for our analysis. Promoter variants in the multidrug and toxin extrusion protein 1 and 2 genes (MATE1 and MATE2) have been associated with improved (p < 0.01) and dampened (p < 0.05) metformin response, respectively. MATE1/SLC47A1 and MATE2/SLC47A2 facilitate renal excretion of metformin with MATE1 playing an additional minor role in the liver (Stocker et al. 2013). A retrospective study among 253 patients with diabetes confirmed that those who were homozygous for the MATE2 promoter variant g.-130G>A showed significantly decreased relative change in HbA1c levels, in response to metformin treatment (p = 0.0073) (Choi et al. 2011).
A candidate gene study with 208 participants found that those with one or more reduced function OCT1/SLC22A1 alleles (R61C, G401S, M420del, and G465R) displayed dampened pharmacodynamic response to metformin (p < 0.05), and unlike those with only OCT1 reference alleles, they did not show a significant decrease in maximal glucose concentration following metformin treatment (p = 0.001) (Shu et al. 2007, 2008). Organic cation transporter (OCT1/SLC22A1) is the primary determinant of metformin cellular uptake in hepatocytes (Shu et al. 2008). Subsequent studies among women with polycystic ovary syndrome, healthy volunteers, and patients with diabetes confirmed the significantly reduced efficacy of metformin treatment for those with OCT1 variants and established a correlation between the number of reduced function SLC22A1 alleles and the absolute decrease in HbA1c (Tzvetkov et al. 2009; Gambineri et al. 2010; Christensen et al. 2011).
In this candidate gene study, we examined the role of genetic variation in predicting metformin response among children and adolescents with ASD taking mixed DSRAs by analyzing participant responses during the treatment phases of our RCT and open-label study. We selected five candidate genes for analysis and hypothesized that these genes previously associated with lower response to metformin would similarly influence variation in the metformin response in this population.
Methods
Design and participants
The background, methods, and primary outcomes of the metformin study have been previously described (Anagnostou et al. 2016; Handen et al. 2017). The study was approved by the institutional review boards at the four participating study sites and the clinical and data coordinating center. Caregivers and legal guardians signed informed consent documents and, if cognitively able to do so, participating youth assented to study participation. This trial was registered on
This was a randomized, double-blind placebo-controlled trial testing the efficacy and safety of a liquid formulation of metformin (Riomet®) in children and adolescents with ASD. A screening and baseline assessment was followed by a 16-week blinded phase and 16 weeks of open-label metformin for all participants. Participants were recruited at four academic sites participating in the Autism Speaks/Autism Treatment Network (Bloorview Research Institute, Ohio State University, University of Pittsburgh, and Vanderbilt University).
Children and adolescents were between 6 years and 17 years, 4 months of age and had a diagnosis of ASD based upon the DSM-IV-TR clinical interview (American Psychiatric Association 2000), and supported by the Autism Diagnostic Observation Schedule (Lord et al. 1999). In addition, participants had to be on a stable dose of a DSRA for a minimum of 1 month with no planned changes and have a documented ≥7% increase in BMI since starting a DSRA (within past 12 months), or, if they had a BMI ≥85th percentile, they were required to have a greater than 5% body weight increase per year since starting the medication, as documented by previous weight records. All other medications, with the exception of metformin, were held at constant doses.
Metformin was dispensed in a liquid formulation of 100 mg/mL, with placebo matching the appearance, smell, and taste of metformin. For 6- to 9-year olds, initial dosing began at the evening meal (250 mg) and remained consistent for 1 week. During week 2, the dose increased by another 250 mg at breakfast. At the week 2 visit, if the previous dose was well tolerated, it was increased to 500 mg twice daily. For 10-to-17-year olds, the initial dosing began following a similar schedule, but at the week 4 visit, if well tolerated, the dose was increased to 850 mg twice daily. Study physicians could decrease doses in multiples of 50 mg if participants experienced adverse events (AEs). Once AEs resolved, participants could be rechallenged with higher doses in multiples of 50 mg units.
Collection and purification of samples
Blood samples for DNA extraction were collected at the baseline visit, when possible, or at the time of a subsequent blood draw for safety monitoring. One participant did not consent to the genetic portion of the study. For 15 participants, blood was mistakenly spun and the cellular pellet discarded, with plasma saved for later analysis. Blood or plasma was stored at −80°C and shipped on dry ice until the time of DNA extraction using the Gentra Puregene Blood Kit protocol for frozen blood (Qiagen, Germantown, MD). A nanodrop spectrophotometer was used to quantify the amount of DNA extracted to dilute samples, to a common 10 ng/μL.
Genotyping
Based on previous studies, eight SNPs were selected for our genotyping analysis. Five of the eight SNPs, rs12943590, rs8192675, rs11212617, rs122088357, and rs3405950, were analyzed with available TaqMan Assays on Demand, while custom TaqMan Assays by Design were developed to analyze the three remaining SNPs, rs2252281, rs35191146, and rs34130495 (Applied Biosystems, Foster City, CA) (Supplementary Table S1). Genotypes were obtained with the Step-One Plus real-time PCR system and the TaqMan Genotyper Software (Applied Biosystems). No polymorphism deviated from Hardy–Weinberg equilibrium (p > 0.10).
Statistical analysis
Genotypes were analyzed in groupings based upon previously published results. For ATM (rs11212617), participants with the AA genotype were compared to those with the AC or CC genotypes (GoDARTS et al. 2011; van Leeuwen et al. 2012; Zhou et al. 2014b). For SLC2A2 (rs8192675), all three genotypes (CC, CT, and TT) were compared (Zhou et al. 2016). For MATE1 (rs2252281), participants with the CC genotype were compared to those with the CT or TT genotypes (Stocker et al. 2013). For MATE2 (rs12943590), participants with the AA genotype were compared to those with the AG or GG genotype (Choi et al. 2011; Stocker et al. 2013). For OCT1, participants with the reference haplotype (M420del GG, R61C CC, and G465R GG) were compared to those with one or more variant alleles (Shu et al. 2007, 2008). The reference haplotype indicates the combination of more common alleles, of each polymorphism.
The primary analysis compared genotype groups on the change in BMI z-score during the first 16 weeks that a participant took metformin, whether that was during the initial randomized portion of the trial or during the open-label extension, for participants randomized to placebo. A sensitivity analysis compared genotype groups on the change in BMI z-score during the randomized trial, comparing response to metformin against response to placebo.
Both comparisons were addressed through estimates from shared-baseline linear mixed models with BMI z-score as the outcome, changes over time modeled as a two-phase partial linear spline, and random participant-specific intercepts and phase-specific slopes modeled with unstructured covariance. Phase-specific slopes were held at zero for screening and baseline visits. Fixed effects for the primary analysis included terms for phase-specific slopes, genotype, genotype × phase-specific slope interaction, baseline IQ, and baseline IQ × phase-specific slope interaction. The sensitivity analysis also included fixed effect terms for treatment × phase-specific slope interaction and treatment × genotype × phase-specific slope interaction. The shared baseline assumption, enforced by omitting a treatment main-effect term, reflected the true state of the population before randomization and adjusted for chance differences at baseline (Fitzmaurice et al. 2011).
To address potential confounders of genotype, we ran additional sensitivity analyses that adjusted separately for age, total drug exposure, and baseline weight z-score, in each case adding a main effect of the covariate and its interaction with phase-specific slopes. To address potential confounding by race, given limited racial diversity in our sample, we ran the primary and secondary models using only the subset of Caucasian participants as a sensitivity analysis. Analyses were performed using SAS (version 9.4; SAS Institute, Cary, NC) and R (version 3.3.2; R Development Core Team, Vienna, Austria). Two-tailed p < 0.05 was considered significant.
Results
DNA was successfully extracted and amplified from all 45 blood samples. Of the 15 plasma samples, only 8 had sufficient DNA to permit genotyping, yielding a total of 53 samples for analysis. Participant demographics, baseline characteristics, and total drug exposure are listed in Table 1.
Sample Characteristics
Mean ± SD or n (%).
Diagnoses by DSM-IV, allowing for autistic disorder, Asperger's disorder, or PDD-NOS.
p = 0.011.
DSM-IV; Diagnostic and Statistical Manual of Mental Disorders, 4th ed; PDD-NOS, pervasive developmental disorder not otherwise specified.
One rare OCT1 polymorphism (rs34130495) showed a lack of variation in our cohort. The MATE2 polymorphism only had two participants with the AA genotype and was therefore eliminated from further analysis (Table 2).
Allele Frequencies
SNP, single-nucleotide polymorphism.
Baseline BMI z-score did not differ significantly by genotype. In the primary analysis, both ATM and OCT1 showed significant effects of genotype on change in BMI z-scores. In comparison with those with the ATM AA genotype, participants with ATM AC or CC genotypes showed significantly greater decrease in BMI z-score during the first 16 weeks that participants took metformin (Fig. 1 and Table 3), whether that was in the randomized phase or the open-label extension (AA genotype BMI z-score change −0.05 ± 0.02, AC or CC genotype BMI z-score change −0.12 ± 0.03, p = 0.047; p = 0.048 to 0.064 in sensitivity analyses). While the association between ATM and BMI z-score change was nominally significant, the cross-sectional difference in BMI z-score by genotype group was not statistically significant at 16 weeks (p = 0.16) or at baseline (p = 0.32).
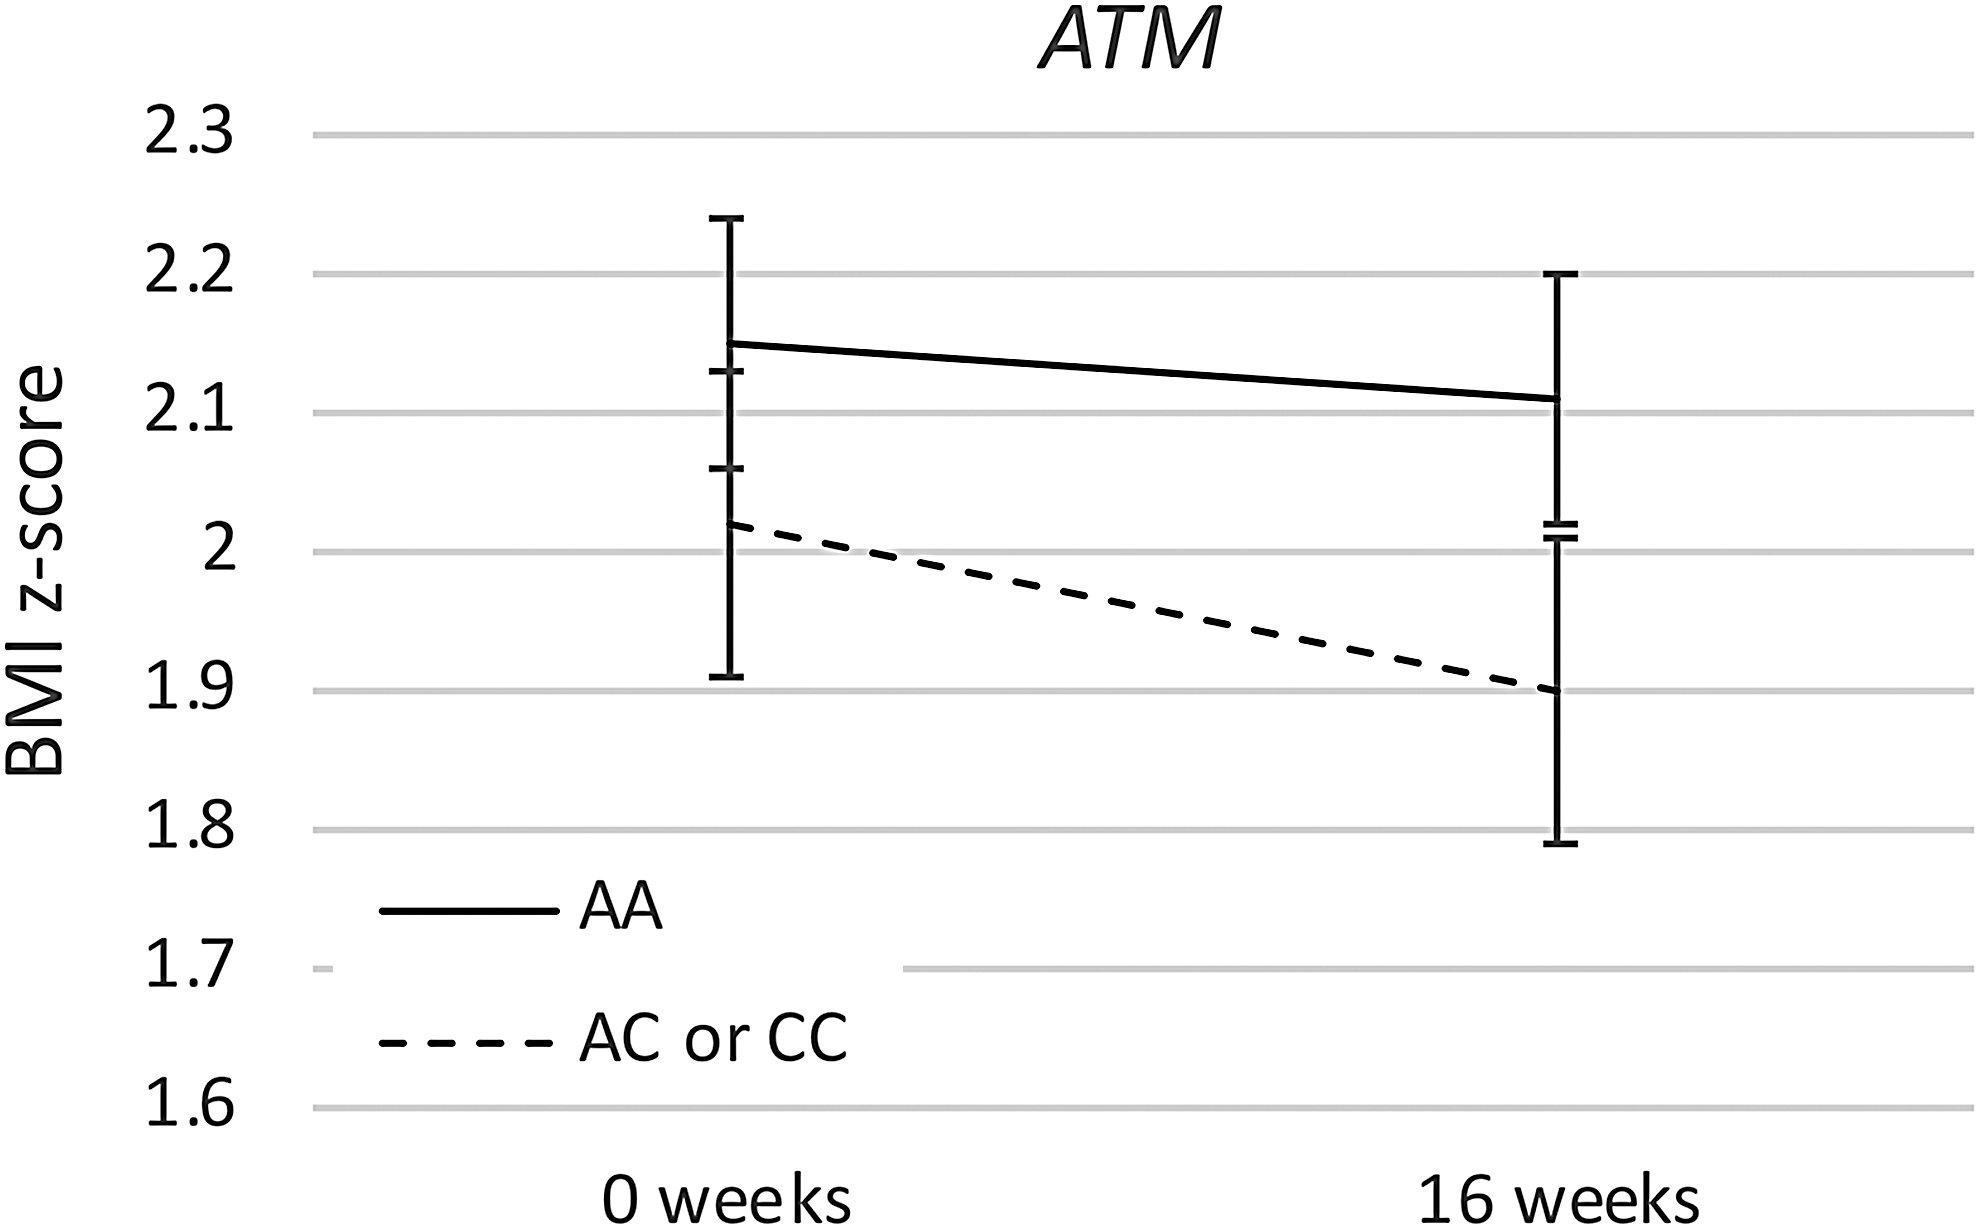
ATM genotype effect. Mean BMI z-score with standard deviation is shown at the start and at the completion of the first 16 weeks of treatment with metformin, either during the randomized or the open-label portion of the study. Participants with the ATM AA genotype were compared to those with the AC or CC genotypes. BMI, body mass index.
Body Mass Index z-Score During the First 16 Weeks on Metformin
Similarly, in comparison with those with the OCT1 reference haplotype, participants with one or more OCT1 variant alleles showed significantly greater decrease in BMI z-score during the first 16 weeks that participants took metformin (Fig. 2 and Table 3), whether that was in the randomized phase or the open-label extension (reference genotype BMI z-score change −0.04 ± 0.02, variant genotype BMI z-score change −0.15 ± 0.03, p = 0.002; p < 0.001 to 0.003 in sensitivity analyses). The difference in BMI z-score by genotype group was statistically significant at 16 weeks (p = 0.036), but not at baseline (p = 0.14). No other polymorphism showed a significant difference in BMI z-score change during the first 16 weeks of treatment. We did not correct for multiple comparisons because each gene hypothesis was based upon a published finding, but it is important to note that the ATM finding would not survive statistical correction.
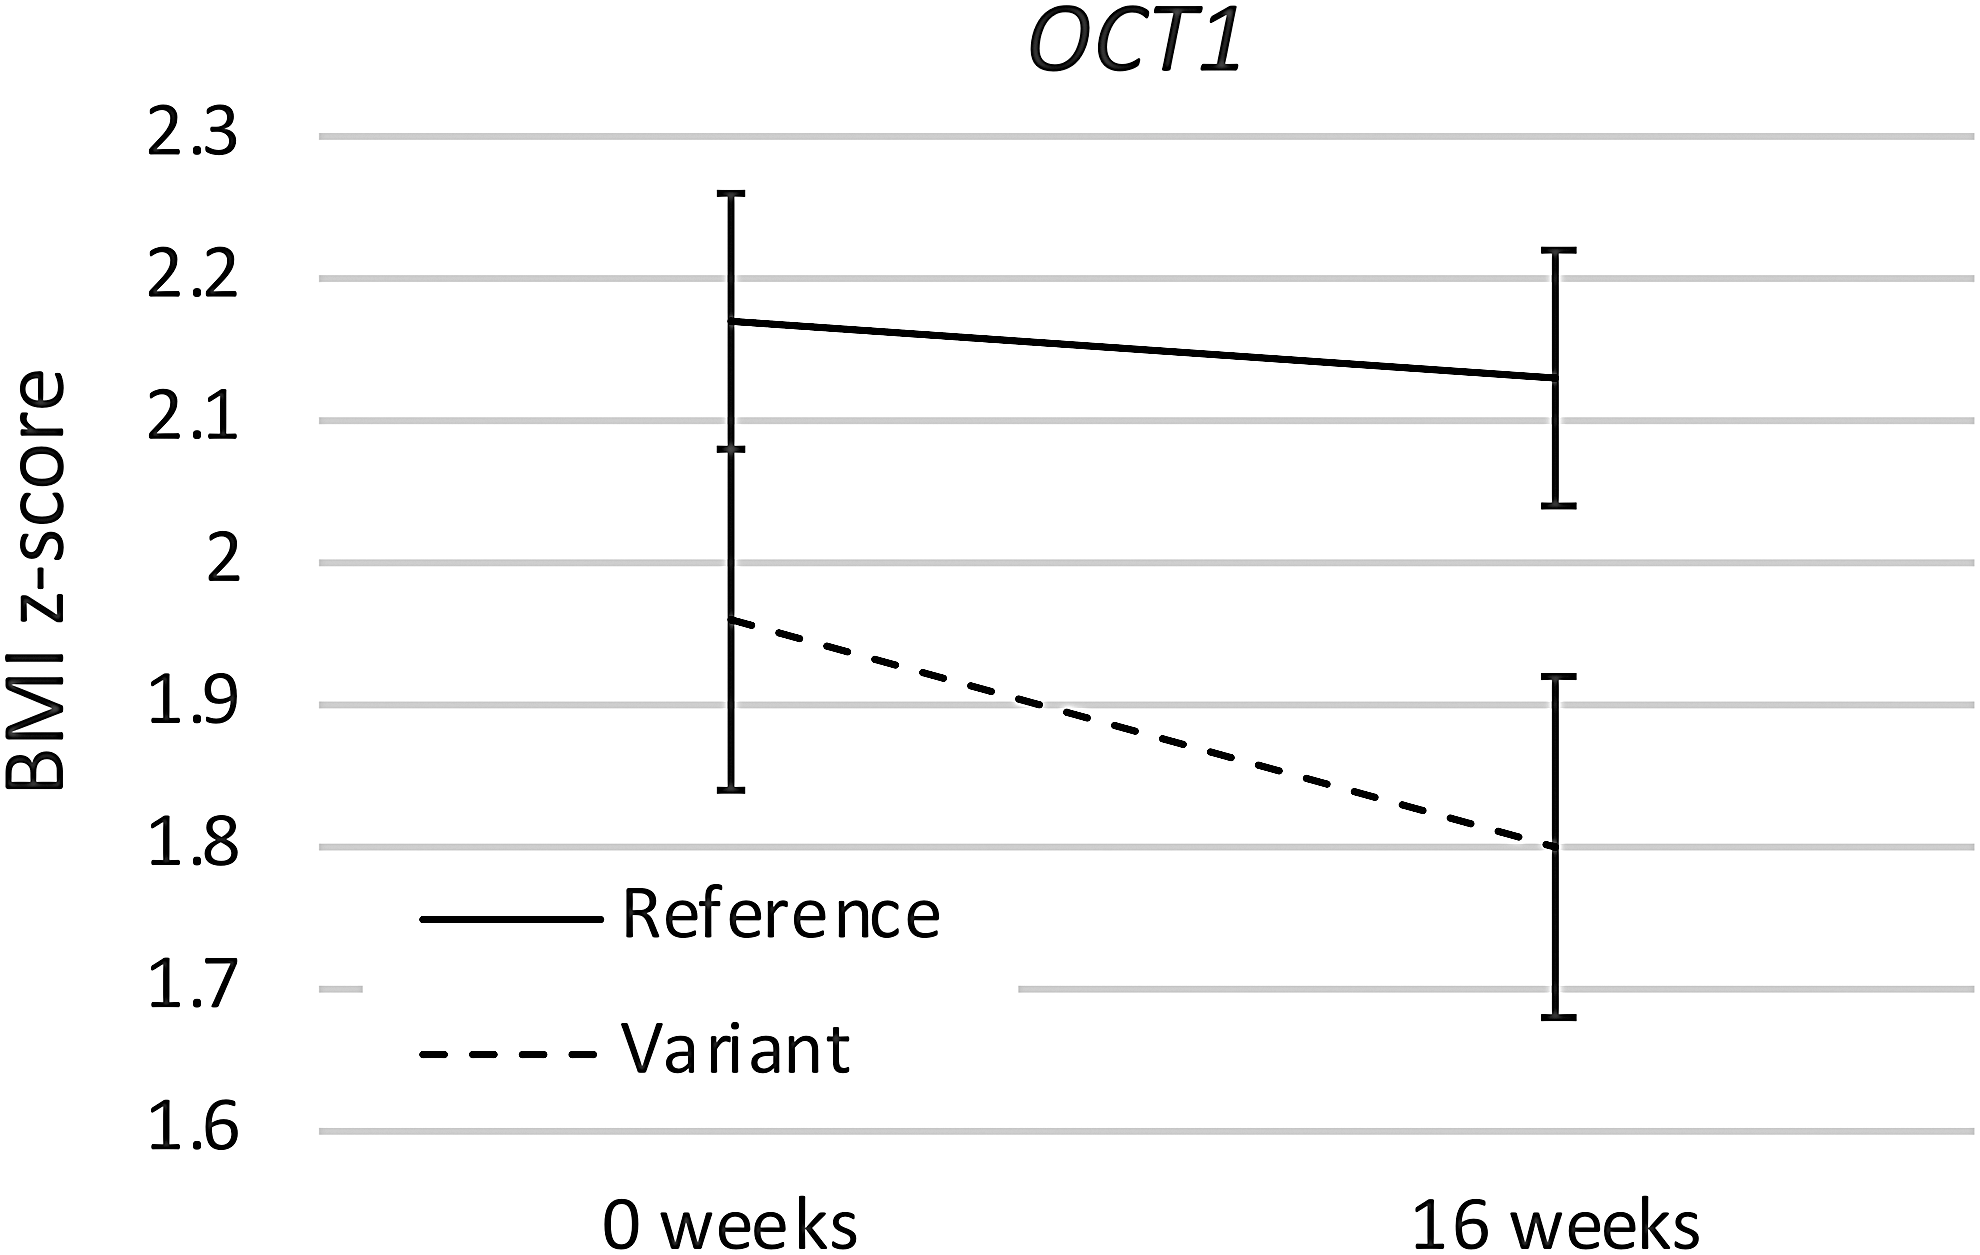
OCT1 genotype effect. Mean BMI z-score with standard deviation is shown at the start and at the completion of the first 16 weeks of treatment with metformin, either during the randomized or the open-label portion of the study. Participants with the OCT1 reference haplotype (M420del GG, R61C CC, and G465R GG) were compared to those with one or more variant alleles. BMI, body mass index.
In the secondary analysis that tested for the three-way treatment × genotype × time interaction, thereby reducing power by approximately half, ATM was associated with a similar genotype difference as was observed in the primary analysis, but it did not reach significance (p = 0.24, Table 4). In comparison to those with the OCT1 reference haplotype, participants with one or more OCT1 variant alleles showed a similar response to metformin versus placebo (Fig. 2 and Table 4) during the randomized phase of the study, but it was not significant (differential response of BMI z-score to metformin in the reference group −0.10 ± 0.04, variant group −0.23 ± 0.06, p = 0.07; p = 0.028 to 0.066 in sensitivity analyses). The change in BMI z-score was significantly different based upon OCT1 genotype for participants taking metformin (p = 0.007), but not for those participants taking placebo (p = 0.70).
Change in Body Mass Index z-score During the Randomized Placebo-Controlled Phase
Discussion
In this study, we found that metformin efficacy for weight gain in children and adolescents taking mixed DSRA medications was affected by variants in ATM and OCT1/3, which had previously been associated with metformin response. Participants with the ATM AC or CC genotypes and those with one or more OCT1 variant alleles showed significantly greater weight loss on metformin. For both genes, this was only numerically supported by the sensitivity analysis that compared metformin response to placebo response in the first phase of the study. In contrast, variants in MATE1 and SLC2A3 were not associated with significantly altered metformin response in this sample, despite previous associations found in GWA and candidate gene studies, and the variant in MATE2 was too rare to assess in this sample.
Of the two gene associations with improved BMI z-score during treatment, ATM, critical for downstream metformin signaling, was in agreement with previous reports, while OCT1, which impacts drug deposition, opposed previous study findings. In studies on type 2 diabetes patients treated with metformin, the presence of a C allele on the ATM gene was significantly associated with a better chance of treatment success and greater HbA1c reduction (van Leeuwen et al. 2012). However, additional studies among type 2 diabetics on metformin failed to replicate this finding (Florez et al. 2012; Shokri et al. 2016). Further research is needed to reveal the mechanism by which ATM variation alters metformin response.
The association of BMI z-score change with functional variants in the organic cation transporter (OCT1) gene likely relates to the role of OCT1 in the cellular uptake of metformin and its reciprocal impact on blood levels of the drug. Metformin is active across multiple cell types, resulting in suppression of hepatic glucose production and increase in muscle and gastrointestinal glucose uptake (Shu et al. 2007). In contrast, OCT1 is expressed strongly in hepatocytes, but has low expression in skeletal muscle and in the intestine (Shu et al. 2008).
Previous studies have reported conflicting results on the impact of OCT1 variants on metformin action. Shu et al. (2007) reported an association of OCT1 R61C, G401S, and G465R polymorphisms with reduced response to metformin on glucose tolerance tests. This association was further supported in three studies of metformin's effect on HbA1c (Tzvetkov et al. 2009; Gambineri et al. 2010; Christensen et al. 2011). In contrast, a later study by Shu et al. (2008) reported higher metformin concentrations in the blood for participants with the OCT1 reduced-function variants (R61C, G401S, M420del, and G465R) compared to the reference haplotype.
The opposite effects of OCT1 reduced-function variants on glucose tolerance and HbA1c versus metformin blood levels may simply relate to the impact of OCT1 on metformin levels in different cellular and tissue compartments (Shu et al. 2007, 2008). The reduced-function variants would be expected to cause less uptake of metformin into hepatocytes—presumably causing less impact on hepatic glucose production—but would thereby result in more metformin remaining in the blood to act on skeletal muscle and intestinal glucose uptake.
Unfortunately, we did not measure metformin blood levels in this trial. Previous pharmacogenetic studies of OCT1 have focused on effects on blood sugar levels, including HbA1c, which did not differ with metformin treatment in this trial, despite a significant impact on weight gain (Anagnostou et al. 2016). The direction of association with weight gain could suggest that impact of metformin on weight gain has a separate mechanism from its effects on blood sugar levels, but further work will be necessary to examine this possibility.
Although we were able to identify an impact of ATM and OCT1 variants on metformin response, our study also has significant limitations. Most importantly, our small sample size limits our ability to exclude a clinically meaningful effect of MATE1 and SLC2A3 polymorphisms, and further study of these genes focusing on effects on weight gain would be needed to fully evaluate their impact among children with ASD using DSRAs. There were also no significant differences in laboratory parameters between participants taking metformin and those taking placebo in this RCT, which could be due to limited power and a lack of baseline laboratory abnormalities in this sample population. Due to our limited sample size, we were also unable to isolate the effects of the OCT1 R61C, G401S, and G465R polymorphisms. In future studies, it would be beneficial to analyze these alleles separately.
In addition, we chose to focus only on polymorphisms with previous support for association with metformin response, and future studies could include a broader range of polymorphisms to fully evaluate functional variation in these genes. This initial study focused on individual analyses of variants in single genes, but future work could consider whether a combined analysis of multiple gene variants is more predictive than individual analyses of single polymorphisms.
We specifically examined weight change after metformin or placebo is added to DSRA medication, but other studies have shown associations between gene variants and weight gain while taking DSRA medication alone, including associations with polymorphisms in MC4R and HTR2A (PMID 27217270, 23799528, and 22566560). Future studies could examine such pharmacogenetic effects in concert, either from the time point when the DSRA medication is first initiated or from the time point when metformin is added. Finally, we did not measure metformin levels in the blood, preventing us from assessing the effect of genetic variants on the absorption or pharmacokinetics of metformin.
Conclusions
We found that variants in ATM and OCT1 significantly affect metformin efficacy as a weight control agent in children and adolescents with ASD, who are taking DSRA medications. If these findings replicate in an independent retrospective study, such as studies of metformin use in adults with mood or psychotic disorders, who are taking DSRA medications, then a prospective study could be conducted to evaluate whether genotype-based treatment, including dose adjustment, improves outcomes when metformin is used for weight control in this context.
Clinical Significance
If replicated, these data would suggest that genotyping for variants in OCT1 and ATM could be useful to predict response to metformin and, potentially, to adjust dosing based upon predicted response. Furthermore, it is possible that genotyping might even be useful before prescribing a mixed DSRA medication that is likely to cause weight gain, with the expectation that metformin might become standard of care for many patients taking these medications, much as benztropine is commonly used in concert with potent dopamine receptor antagonist medications such as haloperidol.
Footnotes
Acknowledgments
The authors would like to thank the participants and families, without whom this work would not have been possible. This project was funded by the HRSA of the U.S. Department of Health and Human Services (HHS) under cooperative agreement grant UA3 MC11054—Autism Intervention Research Network on Physical Health. Ranbaxy Laboratories Ltd. donated both metformin and placebo for the purposes of this study. This work was conducted through the Autism Speaks Autism Treatment Network serving as the Autism Intervention Research Network on Physical Health.
Disclaimer
This information or content and conclusions are those of the authors and should not be construed as the official position or policy of, nor should any endorsements be inferred by, HRSA, HHS, or the U.S. government.
Disclosures
Ranbaxy Laboratories Ltd. donated both metformin and placebo for the purposes of this study. E.A. has received consultation fees and served on advisory boards for Roche; industry funding from SynapDx and Sanofi-Aventis; royalties from APPI, Springer International Publishing; and other funding from Canadian Institutes of Health Research, Ontario Brain Institute, Department of Defense, Autism Speaks, National Centers of Excellence, and National Institute of Health and Physician Services Incorporated. M.G.A. has received consultation fees and research contracts, served on advisory boards, and provided investigator training for AMO Pharma Ltd., Bristol-Myers-Squibb, CogState, Ltd., Confluence Pharmaceutica, Coronado Biosciences, Forest Research, Roche, Janssen Pharmaceuticals–Johnson and Johnson, Lumos Pharma, MedAvante, Inc., Novartis, Ovid Therapeutics, ProPhase LLC, and Supernus Pharmaceuticals. B.L.H. has received funding from Lilly, Curemark, and Roche, National Institute of Mental Health, National Institute of Aging, and Autism Speaks. K.B.S. is currently an employee of Roche and has previously received research funding from Roche, Forest, Curemark, Sunovion, and Stemina, as well as other funding from Autism Speaks, Health Resources and Services Administration (HRSA), and National Institute for Child Health and Human Development. E.M. is a Data Safety Monitoring Board member of Acorda Therapeutics and Shire Human Genetic Therapies and has received grant support from Autism Speaks, Adolph Coors Foundation, ALS Association, ALS Therapy Development Initiative, ALS Therapy Alliance, Biotie Therapies, Michael J. Fox Foundation, Muscular Dystrophy Association, HRSA, and National Institutes of Health. J.V.-V.W. has consulted for or served on the advisory boards of Roche, Novartis, and SynapDx; received research funding from Roche, Novartis, Seaside Therapeutics, Forest, and SynapDx; received editorial stipends from Springer and Wiley; and received other funding from the Sackler Foundation, the Simons Foundation, New York Collaborates for Autism, Autism Speaks, Landreth Family Discovery Grant, Vanderbilt University, Columbia University, National Institute of Mental Health, National Institute for Child Health and Human Development, HRSA, and the Agency for Health Research and Quality. D.G. and J.C. have no competing financial interests.
Supplementary Material
Supplementary Table S1
References
Supplementary Material
Please find the following supplemental material available below.
For Open Access articles published under a Creative Commons License, all supplemental material carries the same license as the article it is associated with.
For non-Open Access articles published, all supplemental material carries a non-exclusive license, and permission requests for re-use of supplemental material or any part of supplemental material shall be sent directly to the copyright owner as specified in the copyright notice associated with the article.