
Abstract
Background:
It has been hypothesized that attention-deficit/hyperactivity disorder (ADHD) and substance use disorders (SUDs) share common neurobiological features. When abnormalities in the mesolimbic reward system are characteristic of children with ADHD, it is unclear whether youth at particularly elevated risk for SUD may exhibit any further disturbances. The objective of this pilot study is to examine possible neurobiological differences among youth with different levels of SUD risk before exposure to any abusable substances.
Methods:
We recruited 47 drug-naive children aged 8–13 divided into (1) Low Risk (LR)—ADHD only (n = 16); (2) High Risk (HR)—ADHD+familial SUD (n = 17); and (3) healthy controls (HC, n = 14) who underwent one functional magnetic resonance imaging scan while performing a hybrid task. We used the omnibus analysis of covariance model to assess for group differences in brain activation in regions linked to the brain reward and behavioral control systems.
Results:
Behavioral analysis showed significant Cue and Flanker main effects, but no significant main effect for Group. Whole-brain analysis showed significant differences in widely distributed networks related to both reward processing and behavioral control. Region of interest (ROI) activations showed that the HR group had the highest activation in the right putamen during both expected rewards and unexpected nonreward outcomes and in the anterior cingulate cortex (ACC) during unexpected nonreward outcomes, while LR and HC youth showed similarly low activation during these contrasts. Furthermore, the LR and HR groups showed lower activation than HC in the right ACC and the right caudate during flanker contrasts.
Conclusions:
These are the first preliminary results to demonstrate that the magnitude of activation during reward notification differs as a function of reward outcome in youth at high versus LR for SUD, such that youth at LR for SUD exhibit the highest activation for positive rewards, whereas those at HR for SUD exhibit the highest activation during negative rewards.
Introduction
The neurobiology of substance use disorders (SUDs) is thought to be related to functional abnormalities of the brain motivation-reward system; however, it is unknown whether this represents a causal factor or the neural sequelae of substance use. While both of these possibilities have received support from human neuroimaging studies (Bjork and Pardini 2015), the majority of studies to date have recruited individuals already exposed to drugs of abuse—which only permits retrospective assessment of risk. The optimal way to examine functional responsiveness of the reward system as a risk factor is to study individuals before exposure to substances of abuse. Examining the consequences of exposure to psychotropic medications, which are potentially abusable and are known to affect reward processing (e.g., psychostimulants), provides a controlled way to conduct such research. However, the few studies that have utilized this approach have not focused on reward processing (e.g., Herting et al. 2011; Wetherill et al. 2012, 2013).
Risk factors for the development of SUD include childhood attention and disruptive behavior disorders (e.g., oppositional defiant disorder, conduct disorder, and attention-deficit/hyperactivity disorder [ADHD]) (Knop et al. 2009, Lee et al. 2011; Serra-Pinheiro et al. 2012; De Alwis et al. 2014), as well as family history of SUD (Ducci and Goldman 2012). Both ADHD and SUD have been linked to abnormalities in mesolimbic motivation-reward circuitry (Wilens 2006), which might represent a shared pathway to later substance abuse (Nymberg et al. 2013). The hypothesis that ADHD and SUD might share common neurobiological features is supported by the finding that parents of children with ADHD have elevated rates of SUD (Chronis et al. 2003; Farokhzadi et al. 2012). When abnormalities in the mesolimbic reward system are characteristic of children with ADHD, it is unclear whether youth who are at particularly elevated risk for SUD may exhibit any further disturbances. This has clinical implications for understanding whether existing or novel interventions may mitigate or further elevate SUD risk in vulnerable youth. For instance, it is well known that stimulants have a strong influence on mesolimbic dopamine tone (Volkow et al. 2001, 2012). As low dopamine levels have been hypothesized to be linked to the development of ADHD as well as risk for SUD (i.e., reward deficiency syndrome), a question of considerable importance is whether treatment with stimulants in childhood may contribute to the later development of SUD. While the majority of research to date has found stimulants to have no effect (Humphreys et al. 2013) or even protective effects (Quinn et al. 2017), a few reports have found a positive link between stimulant treatment and later substance use (e.g., Lambert and Hartsough 1998), particularly when family history for SUD or coexistent conduct problems are not accounted for. More research is required to better understand the relationship of ADHD and familial SUD to risk for SUD and the potential moderating role of the brain reward system.
This pilot study aims to identify neurobiological differences among youth with different levels of SUD risk before exposure to any abusable substances. Toward that end, we recruited drug-naive children with ADHD only (defined as “low risk”), ADHD+Family history of SUD (defined as “high risk”), and compared them to healthy controls (HC) on a task that indexes brain activation for reward anticipation and outcome. We hypothesized that drug-naive youth at high risk (HR) for SUD would show a different activation profile than controls and/or low-risk (LR) youth during reward processing, and that this might represent the neurobiological underpinning of SUD risk.
Methods
We recruited 47 children aged 8–13 (mean = 10.4; standard deviation ±1.6) who were divided into three groups: (1) LR
Demographics
Bold value indicates the significant finding.
Post hoc analyses show no significant differences for gender between HC versus LR, HC versus HR and LR ns. HR groups; HC also has significantly lower ADHD-RS scores than both LR and HR.
AA, African American; ADHD-RS, attention-deficit/hyperactivity disorder rating scale; F, female; FSIQ, full scale intelligence quotient; H, Hispanic; HC, healthy controls; HR, high risk; LR, low risk; M, male; SUD, substance use disorder; W, White.
Initial assessments included vital signs measurement and a full medical, developmental, and family history, as well as assessment of contraindications for magnetic resonance imaging (MRI). Current and past psychiatric histories were evaluated using the Kiddie-Schedule for Affective Disorders and Schizophrenia (SADS) Present and Lifetime Version (Kaufman et al. 1997), which was administered to both the parent and the child. All children met Diagnostic and Statistical Manual of Mental Disorders, 4th ed. (American Psychiatric Association 2000) criteria for ADHD combined or inattentive type. Additional instruments included Conners' ADHD Parent Rating Scale (Conners 1997), the Child Behavior Checklist (CBCL) (Achenbach and Ruffle 2000), and the Matrix Reasoning and Vocabulary subtests of the Wechsler Abbreviated Scale of Intelligence (WASI) (Ryan et al. 2003). Major psychotic, bipolar and mood disorders, and low full scale intelligence quotient (FSIQ <75) were exclusionary, as were prior stimulant treatment, any drug use/experimentation and possible in utero exposure to drugs (determined by history and toxic screen). Parental history of substance abuse was assessed using a semistructured interview administered to the presenting parent/caregiver. The Michigan assessment-screening test for alcohol and drugs (MAST/AD (Westermeyer et al. 2004), which inquires about past and present substance use for each biological parent, was also obtained. Parents were queried on the type of drug used, the length of abuse, and when it occurred. When a positive report was elicited, additional questions were asked to determine whether (1) the drug use represented a persistent pattern of behavior, (2) if it caused functional impairment, and (3) if treatment was deemed necessary. In all cases of reported substance abuse, the reporting parent described the abuse as being a “serious drug problem” and indicated that the affected parent needed “treatment.” Positive family history for SUD was defined as having at least one biological first degree relative with a history of drug use that was considered impairing, and which may have required treatment. All participants had no known prior exposure to any alcohol, nicotine, drugs of abuse, as well as no history of exposure to drugs during pregnancy and no prior treatment with stimulant agents.
Anticipation-conflict-reward paradigm
The anticipation-conflict-reward (ACR) task used an event-related design with three temporally distinct probes of reward anticipation, conflict resolution, and reward outcome, respectively. A pilot study using the task in 16 healthy adults showed that reward and target components of the task engaged components of the motivation-reward and behavioral inhibition systems as originally hypothesized (Ivanov et al. 2008). The ACR was modified to be developmentally appropriate for the current study, using animation images for the cues, targets, and outcomes, and embedding these into a child-friendly narrative (Supplementary Data; Supplementary Fig. S1).
The ACR consisted of four 6-minute and 20-second runs, including 30-second fixation periods at the beginning and the end of each block. Each run included 32 trials, which all began with a cue presented at fixation for 500 mseconds, followed by a 2000 mseconds fixation period. The target was then displayed at fixation for 750 mseconds, followed by a 2000 mseconds response window. Finally, the reward outcome was displayed at fixation for 750 mseconds. The intertrial interval was jittered from 1750 to 6750 mseconds, with a mean of 4000 mseconds in each block. There were two cue events, nonreward and reward cue, which were depicted as moneybags which were either blank or which contained a “$,” respectively. Targets consisted of right- or left-pointing central airplanes that were flanked by double airplanes, which were either congruent or incongruent in direction with the central plane.
Children were instructed to respond in the direction of the central airplane as quickly as possible. Reward outcomes were defined in relationship to the preceding cues and subject responses as follows: (1) expected reward (reward cues followed by $1 win for correct responses), (2) expected nonreward (nonreward cues followed by $0 for correct responses), (3) unexpected nonreward (reward cue followed by $0 for correct responses), and (4) punishment (either cue followed by $1 loss for errors). Since the ACR is a performance-dependent task, all errors were linked to punishment outcomes. Trial types were determined by counterbalancing across the two cues (reward vs. nonreward), four targets (left vs. right, congruent vs. incongruent), and three reward outcomes (not including punishment). Participants were told that if they responded correctly to the target that followed a reward cue they could receive a one dollar reward. They were also instructed that if they did not respond, or if the response was incorrect or slow, a dollar would be taken away. The reward outcome was depicted by an image of a dollar bill; expected and unexpected nonreward outcomes were portrayed by the grayed-out shape of a dollar bill, and punishment was depicted as a hand grabbing a dollar bill. The maximum win possible for the whole task was $32. The running total was presented at the end of each block of the task. It is noteworthy that the rewards in this task were virtual; children were shown the amount of money they won during the task, but did not actually win any money. This virtual reward paradigm was designed to be developmentally appropriate and familiar to children who play video games.
Image Acquisition
All participants were scanned on a 3.0 Tesla Siemens Allegra (Siemens Medical Systems) head dedicated MRI scanner using a high-performance head gradient system. Participants were fitted with headphones, and their heads were stabilized with firm foam padding. A high-resolution T2-weighted anatomical brain scan was acquired with a turbo spin-echo pulse sequence with a repetition time (TR) of 4050 mseconds, echo time (TE) of 99 mseconds, flip angle of 170°, 210 mm field of view (FOV), and 512 × 336 matrix. Forty axial slices were acquired at a thickness of 4 mm with no gap and an in-plane resolution of 0.47 × 0.47 mm. This sequence was obtained to register and align the functional images with a reference brain. Functional T2*-weighted images depicting the blood oxygenation level-dependent (BOLD) signal were acquired at the same 40 slice locations using gradient-echo echo-planar images with a TR of 2500 mseconds, TE of 27 mseconds, flip angle of 82°, FOV of 240 mm, and an acquisition matrix of 64 × 64. Each functional image comprised a brain volume of 40 axial slices, each 3 mm thick with 1mm gaps and an in-plane resolution of 3.75 × 3.75 mm. All images were acquired with slices positioned parallel to the anterior commissure–posterior commissure line. All the participants completed 4 runs of 380 seconds each, yielding data from 152 time points per participant.
Statistical analysis
Behavioral analyses
Three-way Group (HR, LR, and Controls) × Cue (reward and nonreward) × Flanker (congruent and incongruent) analyses of variance (ANOVAs) were performed with reaction time (RT) and accuracy as dependent variables. The alpha level for these analyses was set at s < 0.05 Bonferonni corrected. Post hoc pairwise t-tests were performed to compare RT for reward, unexpected nonreward, and punishment trials between groups.
Functional magnetic resonance imaging analyses
Functional magnetic resonance imaging (fMRI) data processing was carried out using FEAT (FMRI Expert Analysis Tool) Version 6.00, part of FSL (FMRIB's Software Library). Standard preprocessing of the four functional time series was performed individually for each subject. The functional scans were slice scan time-corrected, realigned to the first volume to correct for interscan motion, coregistered to the T2 image, normalized to a standard template (Montreal Neurological Institute), and spatially smoothed with an 8 × 8 × 8 mm3 full-width at half-maximum Gaussian kernel. Standard high-pass filtering was applied with a cut of >0.01 Hz. We applied rigid-body transformation for head motion correction. Data with >2.5 mm displacement along x-, y-, or z- direction were excluded from the group-level analyses.
First level (within-subject) analyses were conducted individually for each participant with a general linear model to quantify the relationship between the observed event-related BOLD signals and regressors encoding expected trial-specific responses. Minimum of 15 events from each condition were required to generate the images for each participant. We used convolving a train of time-locked delta functions, encoding the occurrence of each trial type, with the canonical hemodynamic response (Friston et al. 1998) to create the following design matrix: two cue regressors modeling the main effect of reward versus nonreward cue over all trials with linear contrasts of the parameter estimates for the reward cue minus nonreward cue; four flanker regressors modeling the main effect of congruency by contrasting incongruent versus congruent flankers as well as the interaction with the preceding reward versus nonreward cue; four reward outcome regressors modeling the following effects: reward after reward cue, nonreward after reward cue, nonreward after nonreward cue, and punishment for an incorrect or missing response. The outcome-related effects were tested with the following contrasts: the effect of reward was estimated by subtracting the expected nonreward from the expected reward. The effect of surprising nonreward was assessed by subtracting the expected nonreward from the unexpected nonreward. Punishment was estimated by contrasting nonreward that followed incorrect responses minus expected nonreward. six movement estimates created during motion correction were entered as covariates of no interest (Johnstone et al. 2006).
Hypothesis testing
To test our hypotheses regarding activation due to reward and conflict, we used the usual summary statistic approach for second level (between-subject) inference. First level (subject-specific) contrast images of the above effects, for high-risk and low-risk participants and controls, were entered into separate second-level (random-effects) analyses of covariance (ANCOVAs). In addition to group (HR, LR, HC) effects, the omnibus ANCOVA model was supplemented with the following covariates: FSIQ, age, and gender—to remove potential effects of these variables from those of group differences. Group matching for ADHD severity score, age, and gender assured that these variables were orthogonal to the Group variable.
The resulting statistical voxel-based activation maps were used to test for activation differences within and between groups. We applied a cluster correction method with Z (Gaussianised T/F) statistic images threshold at the commonly used level of at Z > 3.0 and a corrected cluster significance threshold of p = 0.05. The cluster correction method for multiple comparison correction would not require a threshold for number of voxels, as it uses the a priori Z threshold for all voxels and then finds critical cluster sizes (k) based on a permutation test (Worsley 2001; Nichols 2012). The anatomical location of each region of interest (ROI) was determined based on locations of the clusters identified from the voxel-based analyses. For ROI-based analyses, we used false discovery rate (FDR) for multiple comparisons, which offers more power and is conventionally used in these types of analyses, with a corrected threshold of p = 0.05.
All voxel-based analyses were conducted using FSL. The ROI detection and activation magnitude analyses were conducted using FSL utility tools, The group-level comparisons of the ROI-based measures were conducted using SPSS. We extracted parameter estimates from those regions, and these were plotted to illustrate the differences in activation among the three groups for individual components of the ACR task.
Results
Demographics
We initially recruited 56 subject; of those 9 were excluded due to excessive head motion during the scan. Sample characteristics are presented in Table 1. The three groups did not differ significantly on age, sex, and FSIQ. As expected, LR and HR groups had significantly higher ADHSRS scores, however, the LR and HR did not differ in ADHDRS scores.
Participants from both at-risk groups had predominantly combined versus inattentive type ADHD (e.g., LR 5/16 = 28%, HR 4/17 = 23%, respectively), however, participants in the HR group had higher rates of comorbid oppositional defiant disorder/conduct disorder (e.g., 7/17 = 39%) compared to LR participants (e.g., 2/16 = 13%).
Behavioral results
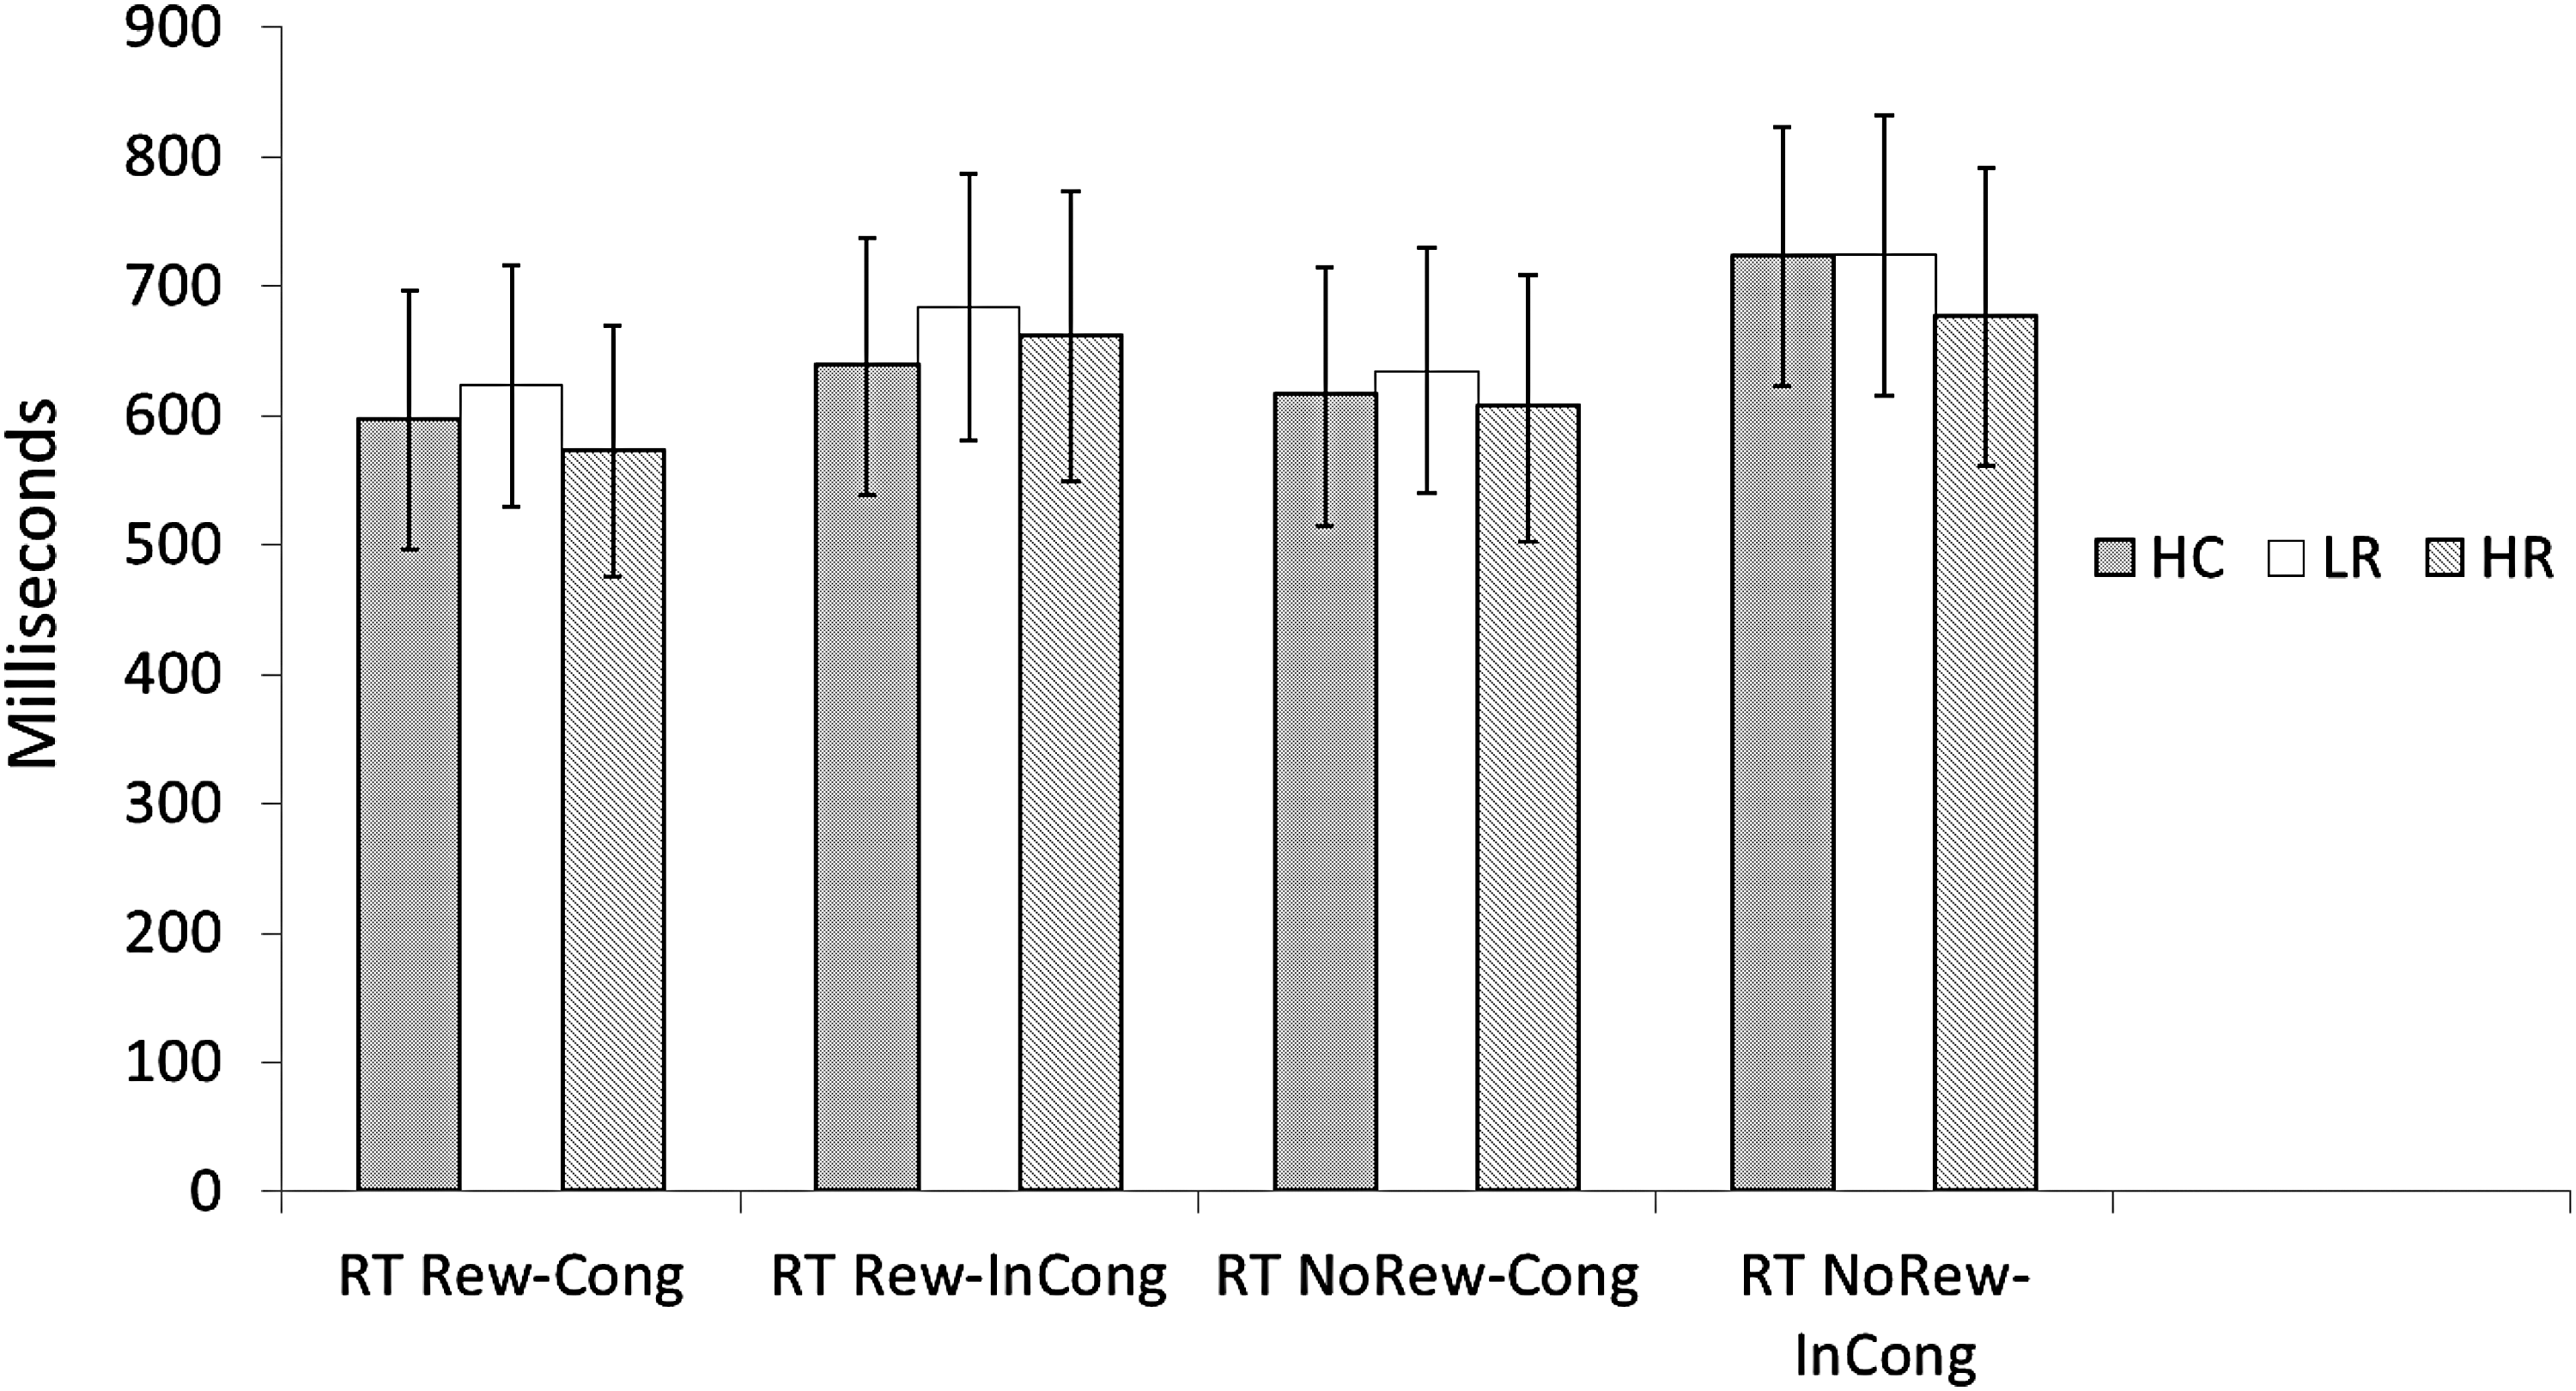
Accuracy did not differ between groups (p > 0.10). The three-way ANOVA showed significant Cue main effects during congruent trials (F = 17.326, p < 0.05) and close to significant Cue main effect during incongruent trials (F = 4.001, p = 0.052), such that participants responded faster following reward cues. There was a significant Flanker main effects for both nonreward (F = 63.907, p < 0.05) and reward (F = 10.117, p < 0.05) trials, such that participants responded faster on congruent versus incongruent flankers (Table 2 and Figs. 1 and 2). However, there was no significant main effect for Group, and there were no Group by Cue or Group by Flanker interactions.

Reward effects of the ACR task: there was a significant effect for Reward versus Nonreward Cues (bars 2 and 4) during Incongruent flankers. All three groups showed faster RT with Reward Cues during the Incongruent flanker condition; RT during Congruent flankers approached significance (p = 0.052); that is, faster RT with Reward Cues. Congruence effect of the ACR task: There was a significant effect during Congruent versus Incongruent flankers following both Reward (bars 1 and 2) and Nonreward (bars 3 and 4). All three groups showed significantly faster RT for Congruent versus Incongruent flankers. There were no significant main effects of Group (HC vs. LR vs. HR) for any of the ACR conditions (also see Table 1 and Fig. 2). ACR, anticipation-conflict-reward; HC, healthy controls; HR, high risk; LR, low risk; RT NoRew-Cong, reaction time during no reward cue/congruent flanker trial; RT NoRew-InCong, reaction time during no reward cue/incongruent flanker trial; RT Rew-Cong, reaction time during reward cue/congruent flanker trial; RT Rew-Incong, reaction time during reward cue/incongruent flanker trial.
For each condition of the ACR task, the behaviors for the three groups were not significantly different. ACR, anticipation-conflict-reward; HC, healthy controls; HR, high risk; LR, low risk; RT NoRew-Cong, reaction time during no reward cue/congruent flanker trial; RT NoRew-InCong, reaction time during no reward cue/incongruent flanker trial; RT Rew-Cong, reaction time during reward cue/congruent flanker trial; RT Rew-Incong, reaction time during reward cue/incongruent flanker trial.
Anticipation-Conflict-Reward Behavioral Results
There were significant main effects for RT in the Reward–No Reward contrast; all groups responded faster in the reward versus nonreward conditions (p < 0.05). Similarly, there were significant main effects for congruence in the Congruent–Incongruent contrasts; all groups responded faster for the congruent versus incongruent conditions (p < 0.05).
HC, healthy controls; HR, high risk; LR, low risk.
Imaging Results
Reward anticipation
During the Anticipation contrast (Reward–nonreward cue) the HR group showed lower activation than both the LR group and HC in overlapping regions of a narrowly distributed network, including the inferior and middle frontal gyri. No significant difference in activation was detected between the LR and HC groups.
Reward outcome trials
We found significant differences in brain activation between the groups in two types of reward outcome trials: Expected Reward and Unexpected Nonreward. During the Expected Reward contrast (expected reward–expected nonreward) the LR group showed higher activation than the HR and HC groups in a narrowly distributed network that included the right anterior insula (Table 3, rows A and B). In addition, the HR group showed higher activation than the HC group in a more distributed network, including the right middle frontal and right middle temporal gyri, the right putamen, and the left thalamus (Table 3, row C).
Between-Group Comparison of Activation During the Expected Reward Outcome Condition of the Anticipation-Conflict-Reward Task in the Reward Cue/Reward Outcome–Nonreward Cue/No Reward Outcome Contrasts in Identified Regions of Interest
BA, Brodmann area; MNI, Montreal Neurological Institute.
During the Unexpected Nonreward contrast (unexpected nonreward–expected nonreward), the HR group exhibited higher activation than the LR and HC groups in a network of brain regions that largely constituted the reward/motivation system. More specifically, the HR groups showed higher activation than the HC group in bilateral putamen, left insula, bilateral anterior cingulate cortex (ACC), multiple prefrontal regions, as well as precuneus (Table 4, row A). The HR group also showed greater activation than the LR group in the putamen and the insula bilaterally, as well as right ACC (Table 4, row B).
Between-Group Comparison of Activation During the Unexpected Nonreward Condition of the Anticipation-Conflict-Reward Task in the Reward Cue/Unexpected Nonreward–Nonreward Cue/No Reward Outcome Contrasts in Identified Regions of Interest
ACC, anterior cingulate cortex; BA, Brodmann area; MNI, Montreal Neurological Institute.
Plotting activation in the selected ROIs showed that the HR group had the highest activation in the right putamen during both expected reward and unexpected nonreward outcomes, whereas the LR and HC groups showed similar levels of activation. HR youth also showed elevated activation in ACC during unexpected nonreward outcomes, while LR and HC youth showed similarly low activation during this contrast. Activation in insula followed a different pattern—the LR group showed the highest activation for expected reward outcomes, while the HR group showed the lowest activation for reward; for this analysis, controls fell in-between the two risk groups. In contrast, this order was reversed during the unexpected nonreward outcomes; whereas the HR group showed the highest activation, the LR group had the lowest activation, and controls were in-between the two risk groups (Figs. 3 and 4).
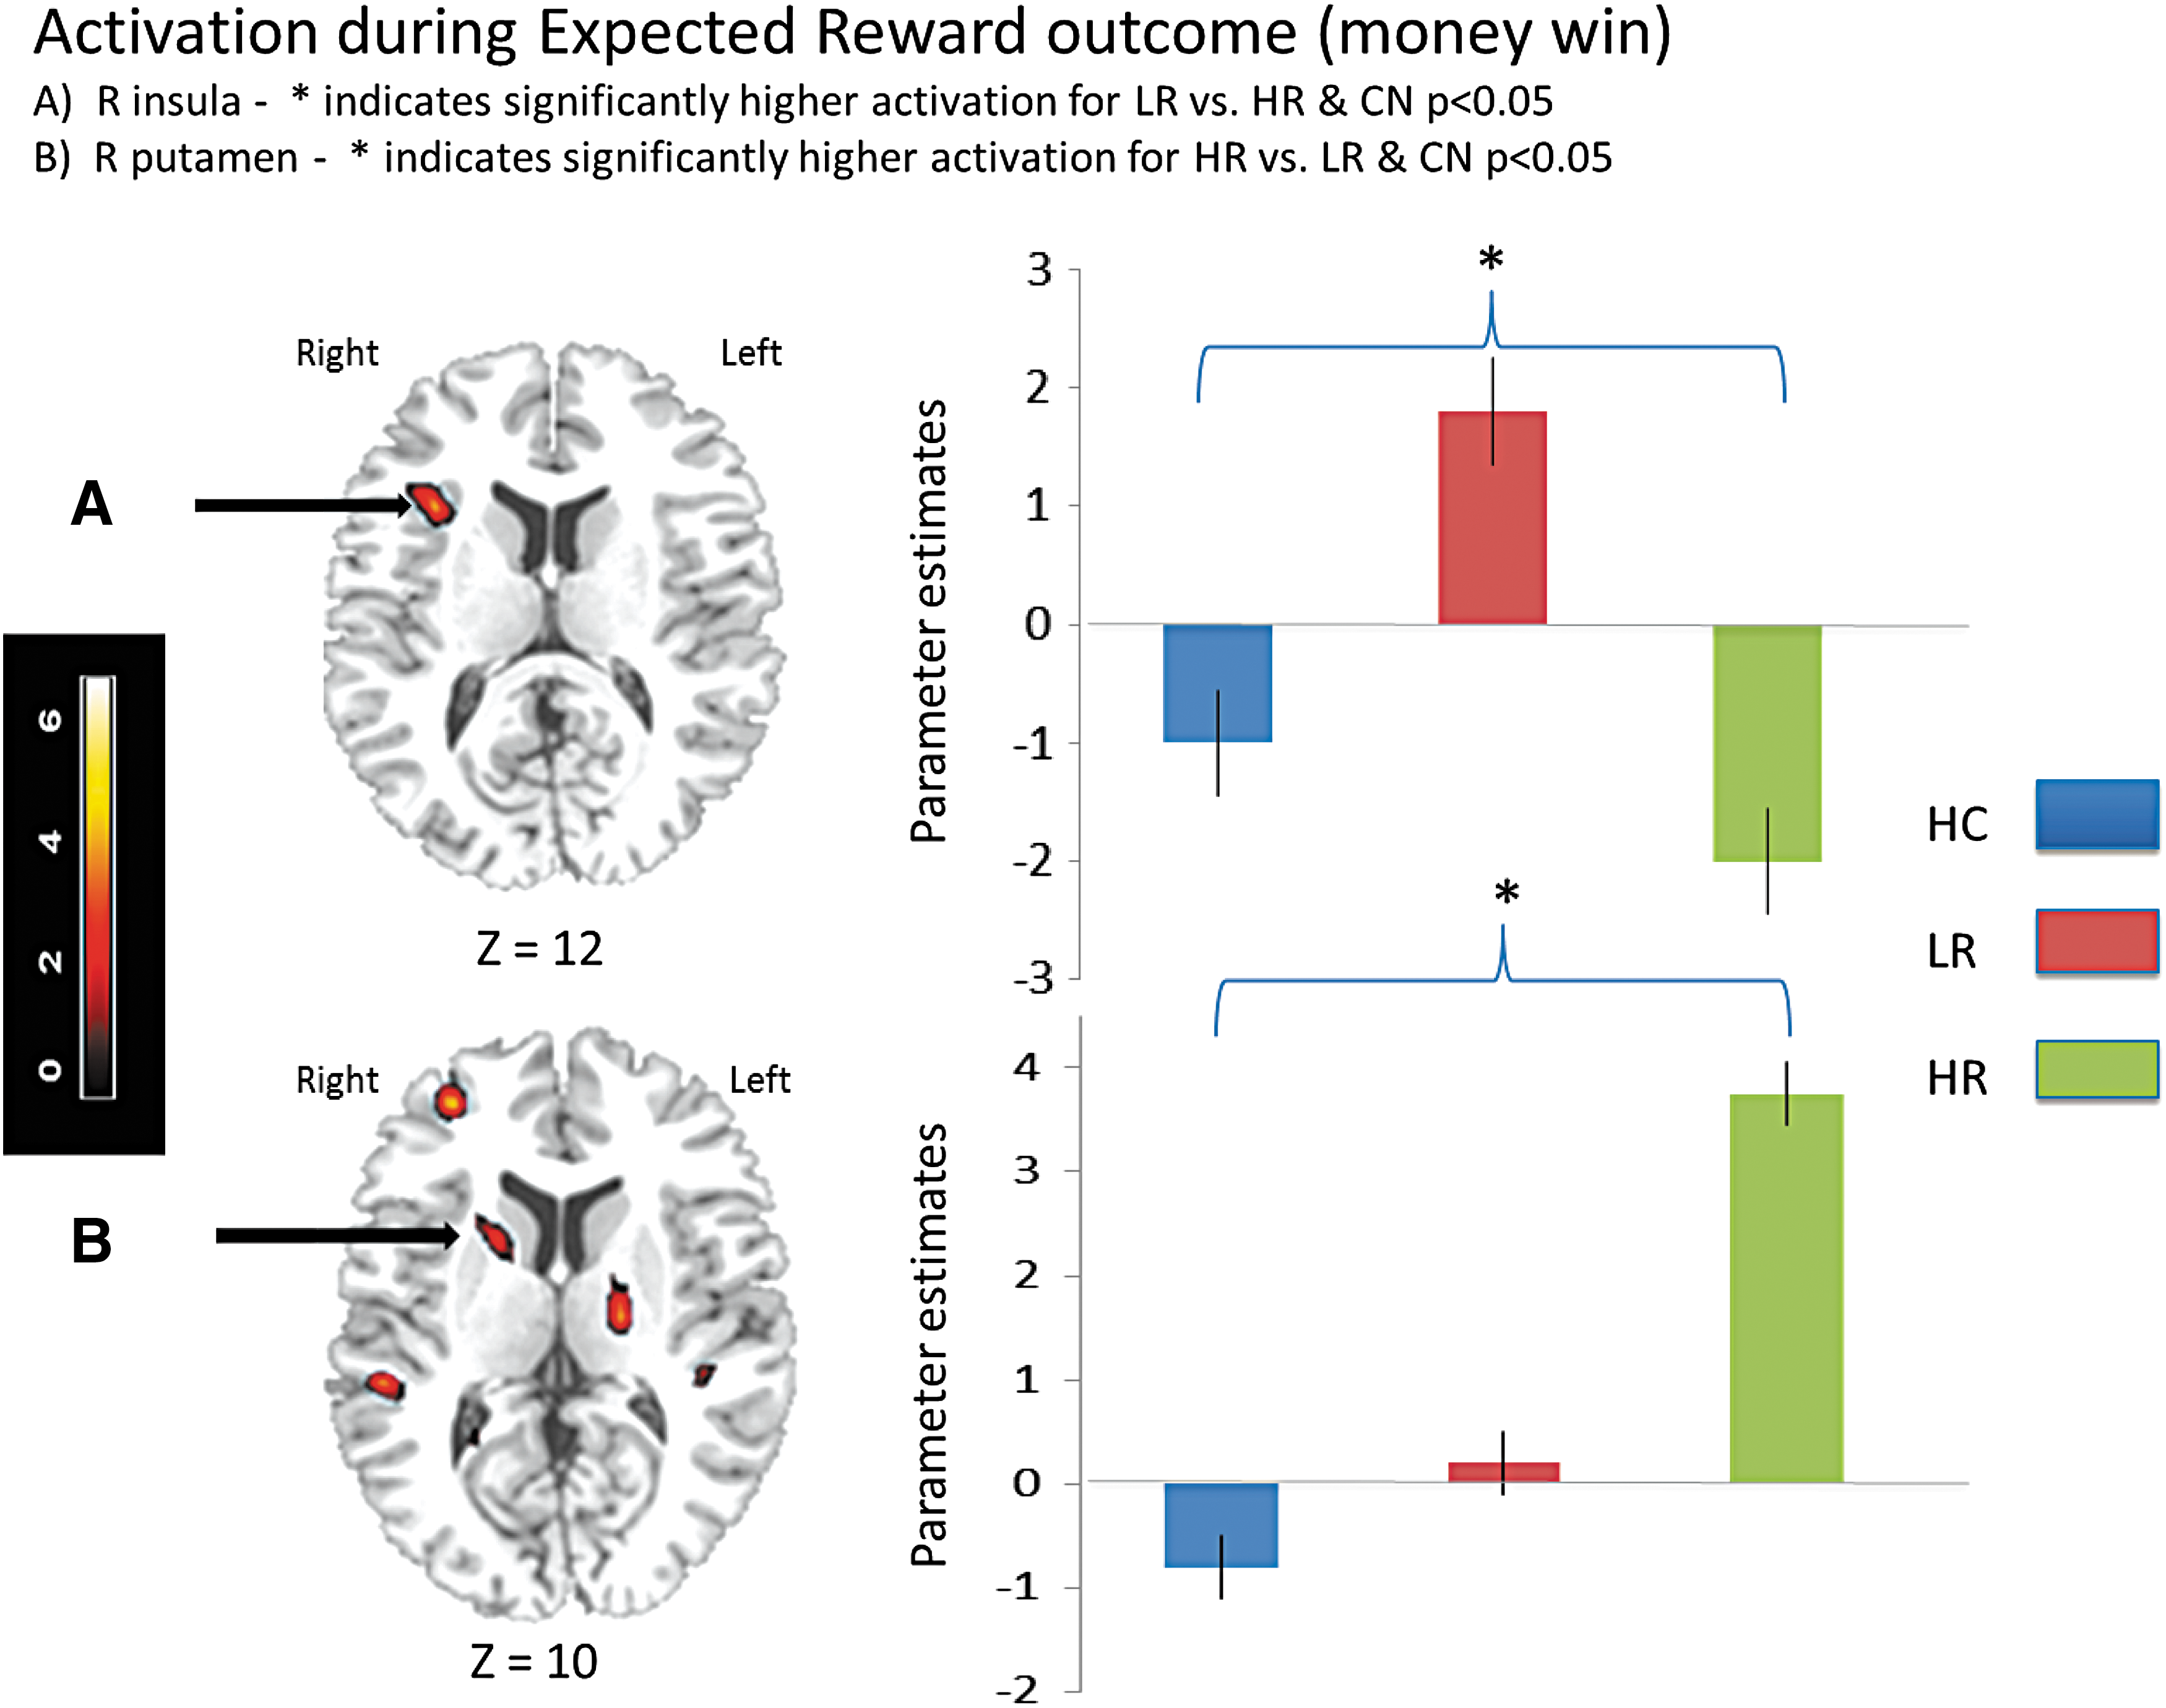
Activation during Expected Reward outcome (money win).
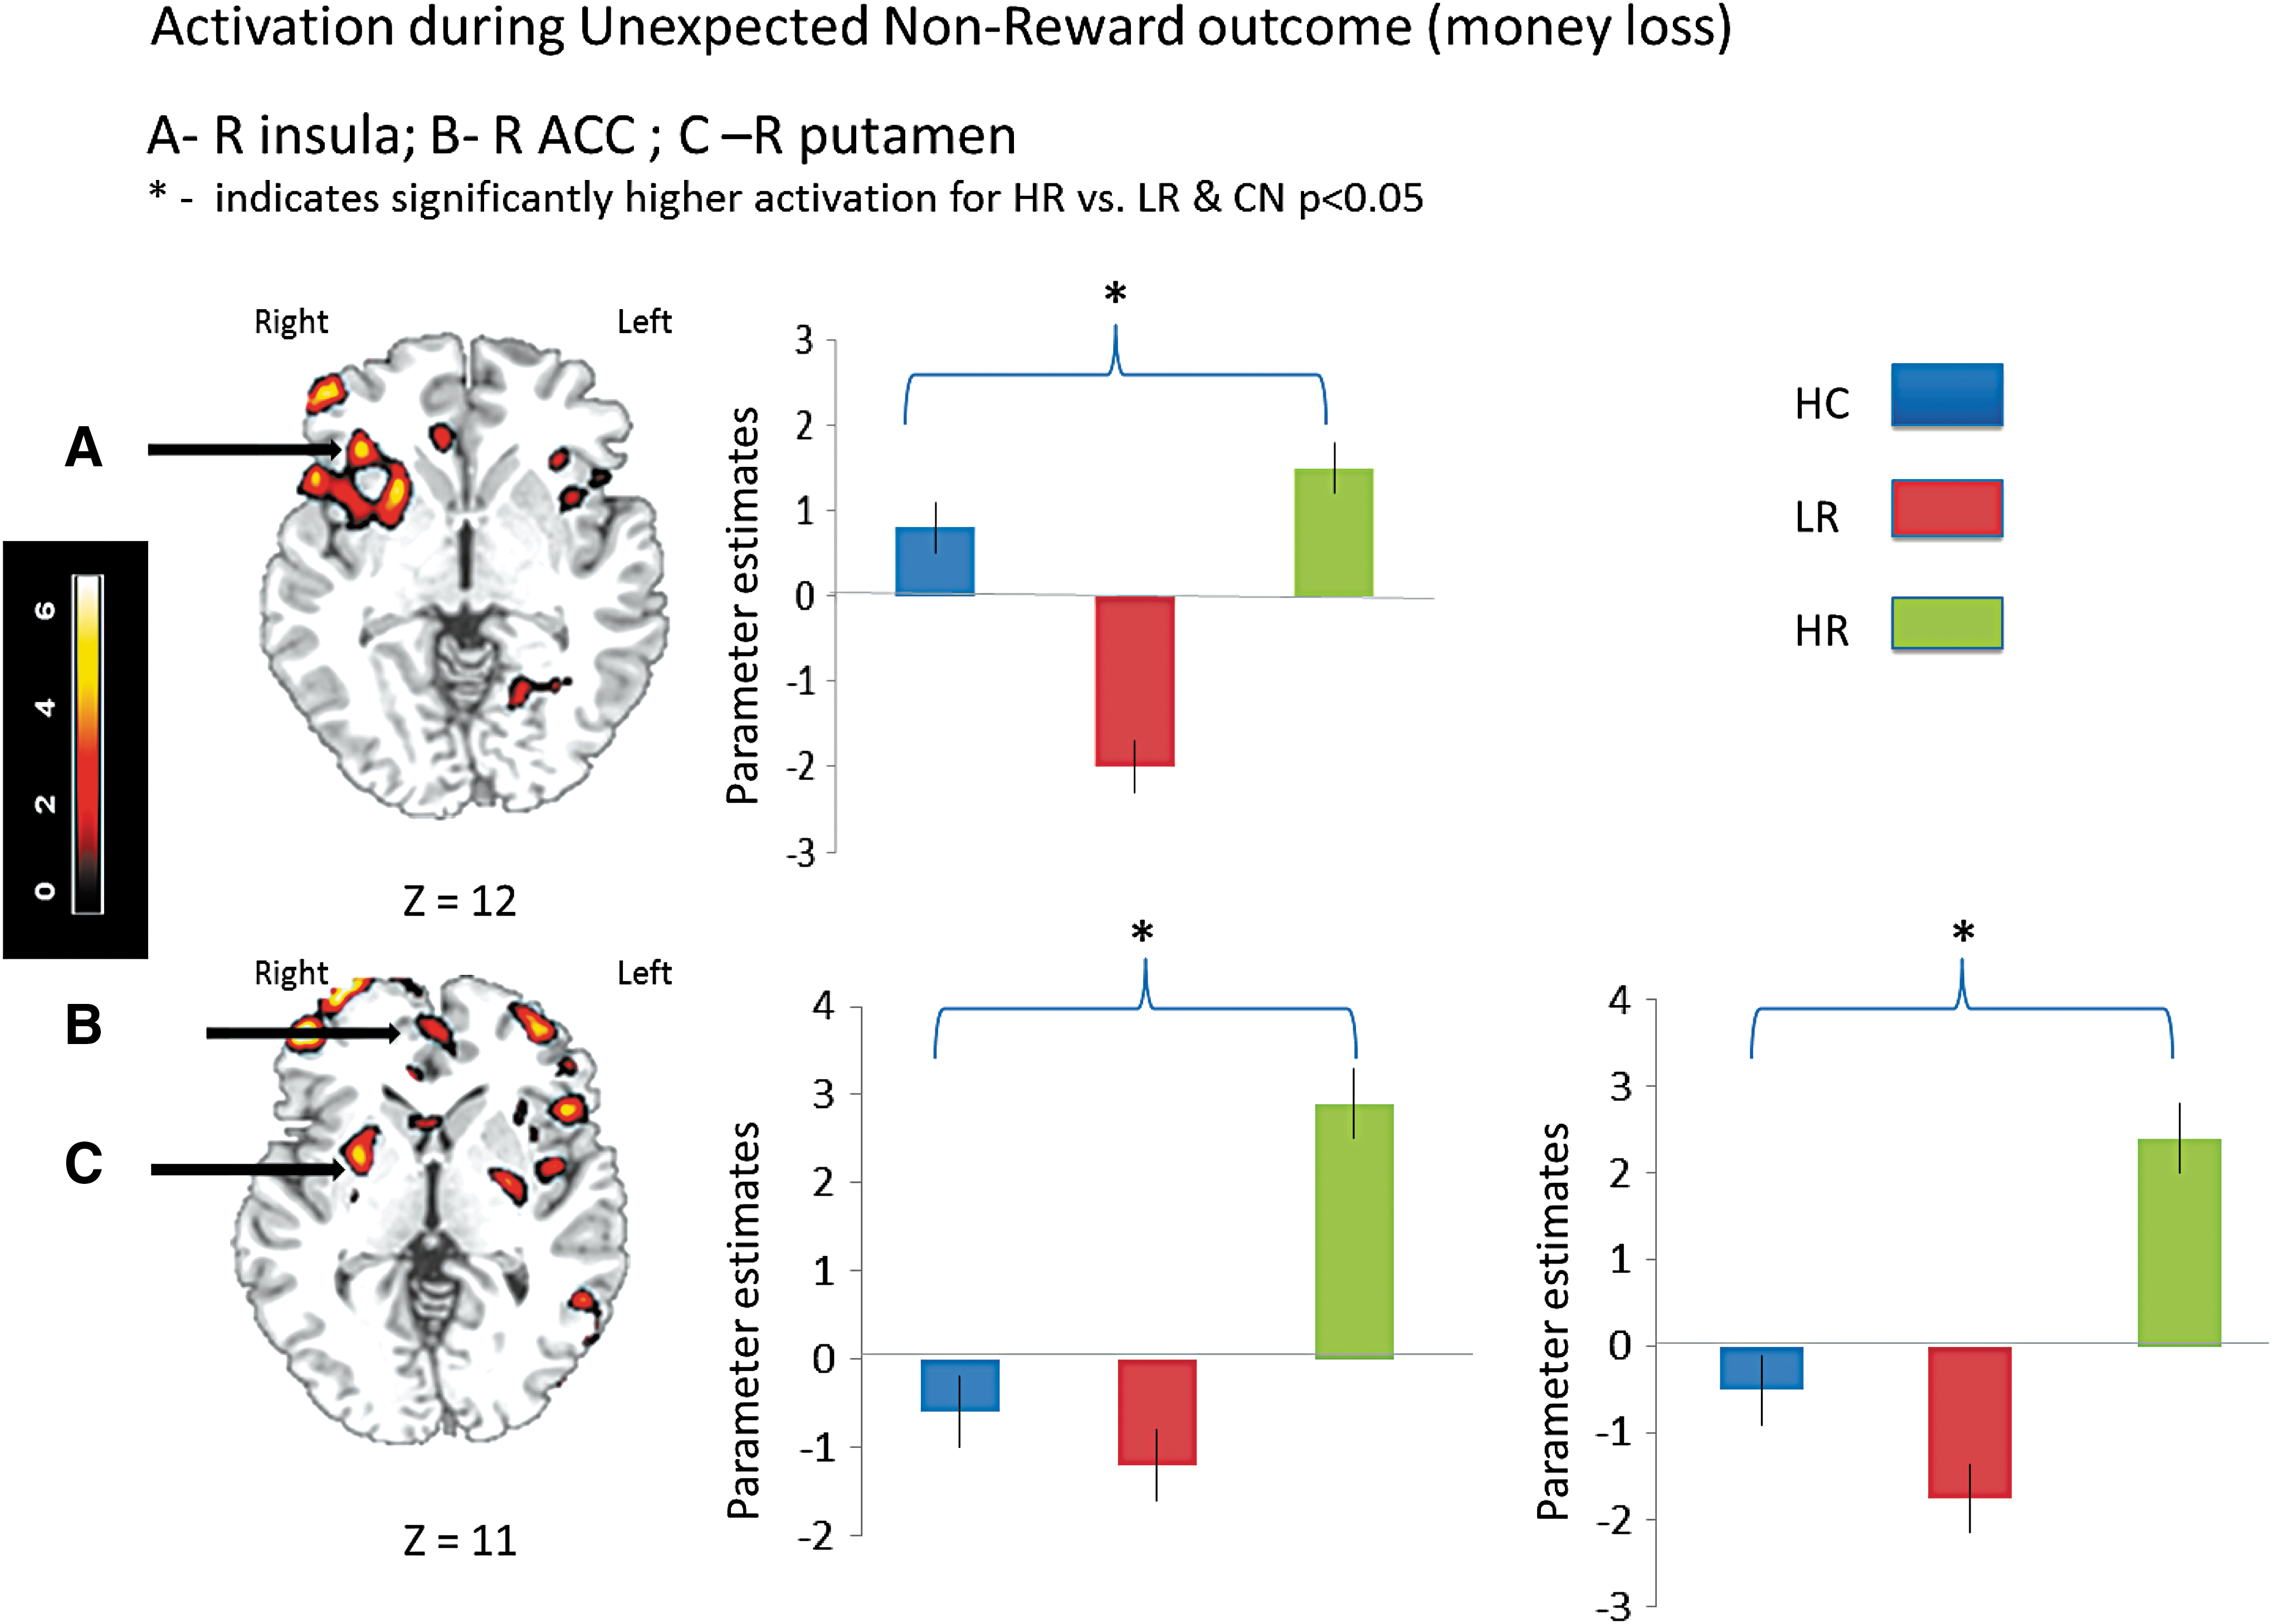
Activation during Unexpected Nonreward outcome (money loss).
Flanker trials
During the flanker contrasts (incongruent–congruent flanker) the LR and HR groups showed lower activation than the control group in a widely distributed network. More specifically the LR group showed lower activation than controls in right ACC, right posterior cingulate cortex, and right caudate (Table 5, row A), while the HR group showed lower activation than controls in right caudate, right superior middle frontal gyrus, and right ACC (Table 5, row B). Also, the HR group showed higher activation than the LR group in the right pre- and postcentral gyrus (Table 5, row C).
Between-Group Comparison of Activation During the Flanker Component of the Anticipation-Conflict-Reward Task in the Incongruent–Congruent Flanker Contrasts in Identified ROIs
ACC, anterior cingulate cortex; BA, Brodmann area; MNI, Montreal Neurological Institute; PCC, posterior cingulate cortex.
No additional activation differences were ascertained when FSIQ and sex were introduced as covariates.
Discussion
These preliminary results show that the expected reward event and the unexpected absence of a reward event elicited different patterns of activation in regions of the brain reward system as a function of risk for SUD in children. The activation pattern for the different task components in the HC group was used as the baseline bench mark in the interpretation of activation in the two risk groups. The most consistent finding of this study was that the HR youth with no prior exposure to drugs of abuse showed significantly higher activation in right putamen for expected reward events and unexpected absence of reward events when compared to LR youth and controls. Furthermore, we found that insula activation was greatest in the LR group for expected reward outcomes (i.e., money win), but was highest for unexpected nonrewards (i.e., prediction error) in the HR group. Finally, the HR group showed lower inferior and middle frontal responses to cues predicting reward outcomes compared to the LR and control groups, despite comparable improvements in RT for reward cues.
How can one interpret these different activation patterns during reward outcomes for the LR versus HR groups? One possibility is that these differences were influenced by the nature of the outcome (money win vs. no money win). It is possible that different regions of the brain reward system that underlie different reward-related functions activate differently depending on the nature of the reward-related signal. As shown in this study, insula activation differed in the LR and HR groups, such that children with ADHD and no family history of SUD (i.e, LR) seemed most sensitive to the positive effect of reward—a finding that is in line with recent reports showing that individuals with ADHD demonstrate higher brain activation than controls during anticipation of the monetary incentive delay (MID) task (von Rhein et al. 2015; Wilbertz et al. 2017). In contrast, the absence of an expected reward, which reflects an error in prediction, seems to have the strongest effect on children with ADHD who also have familial SUD (e.g., HR). As it has been shown that insula activates during notification for negative outcomes (Ivanov et al. 2012b; Palminteri et al. 2012, 2015), our findings provide new evidence that hypersensitivity to unexpected negative outcomes may be characteristic of drug-naive youth at HR for later SUD.
Moreover, the HR group showed the highest activation during both positive and unexpected or negative outcomes in the right putamen. Emergent evidence indicates that the putamen is part of a neuronal circuit for action selection in relationship to history of reward acquisition (Muranishi et al. 2011) and mediates important aspects of decision-making, in particular, encoding action—outcome associations for goal-directed behavior and action selection based on reward value (Balleine et al. 2007). These results are consistent with previous findings of increased limbic system sensitivity to negative reward outcome in individuals with SUDs (Bjork et al. 2008). Furthermore, elevated caudate and putamen response to monetary reward has been found to predict substance use onset in adolescents at 1-year follow-up (Stice and Yokum 2014). Of interest is recent evidence linking morphological abnormalities in putamen to compulsive behaviors in adults—as described in a report by Kubota et al. (2016), showing a positive relationship between scores on the Maudsley Obsessive Compulsive Inventory (MOCI) and bilateral putamen volumes. Such findings provide additional support for a hypothesis linking diseases that affect the basal ganglia and obsessive compulsive disorders (Maia et al. 1999) and for a hypothesis proposing that the transition from recreational drug use to compulsive drug-seeking is neurally underpinned by a transition from prefrontal to striatal control over drug seeking and taking (Hyman et al. 2006; Everitt and Robbins 2016). Thus, our finding of elevated putamen activation in drug-naive youth at HR for later SUD may represent a marker of vulnerability for the development of compulsive behaviors that may further mediate the transition from use to abuse.
The HR group also showed significantly higher activation for the absence of expected reward outcomes in ACC regions implicated in encoding prediction error and signaling surprise (Jahn et al. 2014; Alexander and Brown 2019). The elevated ACC activation seen in drug-naive youth at HR for later SUD in the current study may reflect enhanced sensitivity to cues signaling conflicts between expected and observed events. We hypothesize that pathological error signaling in ACC may leave HR children vulnerable to the reinforcing properties of drugs of abuse (Keiflin and Janak 2015).
Our results did not show engagement of the ventral striatum (VS) for reward anticipation (reward–nonreward cue). In contrast, cue-related activation in the current study may reflect the level of engagement and preparation for responding to the ensuing target (e.g., flanker). Our behavioral results clearly demonstrated a reward effect for all three groups, as all participants exhibited faster responses on targets following reward than nonreward cues. The brain activation maps, however, showed that the HR group exhibited significantly lower activation than the LR and control groups, which demonstrated similar activation patterns in frontal and parietal attention networks. Reduced inferior and middle frontal activation for the anticipation of upcoming reward in high-risk children may reflect a failure to mobilize the attentional and cognitive resources required to prepare a response.
It is also worth mentioning that when the behavioral results clearly captured differences among the different components of the ACR task, there were no significant behavioral differences among groups. We suggest that in light of this, the activation differences detected by fMRI reflect intrinsic biological alterations particular to each group. This suggestion is based on (1) the assertion that detecting true differences in brain activation between individuals with psychological abnormalities and controls may be possible only if their performance of imaging tasks is compatible to each other (Price and Friston 1999) and (2) suggestions that sensitivity to reward is primarily reflected on the level of neuronal activation and less so via behavioral measures (Robinson and Berridge 2000).
These results should be considered in the context of several limitations. First, the sample size studied here is relatively small; however, the size of the groups is in line with reports from other pilot studies that examine novel tasks (Cortese et al. 2012; Hart et al. 2013; Rubia 2018). Moreover, our sample also has advantages, by virtue of being young in age and drug naive. Second, we acknowledge that we used a liberal threshold of p < 0.05 to identify significant group differences in activation. This was based on the following rationale: (1) this is a pilot study using a novel task and novel methodology, with the main goal to quantify differences in brain activation that will be used to guide and power larger scale research protocols; and (2) we used cluster correction analyses with a well-established threshold of Z-values (e.g., Z > 3) and used the FDR method for multiple comparison that provides more power than family-wise error rate for fMRI studies (Nichols 2012). Third, this report presents preliminary data that, while in line with recent reports in the literature (von Rhein et al. 2015; Wilbertz et al. 2017), still need to be further confirmed. Fourth, the sample is predominantly male and while it reflects the generally accepted male to female ratio in ADHD, it is possible that results will vary in samples that are more balanced with respect to sex. Fifth, the relationship of our findings to other known risk factors for SUD is yet to be determined. Sixth, the task used in this study differed from the most widely used reward task (e.g., MID task), although each task has relative advantages and disadvantages. An advantage of the task used in this study is that the task outcomes were not predetermined, and we did not have the same reward/nonreward ratio (i.e., 66% vs. 34%) as in the MID. While the MID task is most reliable for indexing activation in the VS during reward anticipation, our task seems to most reliably engage the reward system for reward notifications, with differences observed between positive and negative outcomes. Seventh, as the ACR task offers multiple contrasts for both reward and conflict processing, we limited our ROI analyses to contrasts of reward processing for two reasons: (1) the main objective of this report is to investigate purported differences in reward processing between drug-naive participants at different levels of SUD risk and (2) to diminish the use of multiple comparisons in this relative small sample. Finally, it is possible that our sample contained highly resilient youth, and that this might have affected the current findings. However, many other factors could also relate to the development of resilience, not simply activation on our reward-related task. The issue of how much resilience may have contributed to the current results would be challenging to assess in this experimental paradigm mainly because resilience is best studied in longitudinal studies, in which a multiplicity of potential risk and protective factors are measured.
Conclusions
In summary, these findings delineate the underlying neurobiology in drug-naive children with ADHD and different levels of risk for SUD, and consider these in relationship to brain activation during a reward paradigm that involves both positive (e.g., expected reward) and negative (e.g., unexpected nonreward) outcomes. To our knowledge, these are the first results to demonstrate that the magnitude of activation during reward notification differs as a function of reward outcome in youth with ADHD at high versus LR for SUD, such that youth at LR for SUD exhibit the highest activation for positive rewards, whereas those at HR for SUD exhibit the highest activation during negative rewards. If replicated, these findings would contribute to our understanding of the mechanisms of SUD onset, and could aid in the development of preventive strategies to reduce SUD risk in children even before exposure to drugs of abuse.
Clinical Significance
What is the clinical relevance of our findings? First, it is extremely important to consider the possibility that youth with ADHD at HR and LR for SUD might differ with regard to key neurobiological and neurocognitive measures. In addition, and following from this, one could speculate as to whether pharmacological agents may differentially influence the brain reward system in drug-naive youth at HR and LR for later SUD. Our group has shown that psychostimulants improve accuracy on the ACR task while decreasing activation in brain regions related to behavioral control and reward processing in adult volunteers (Ivanov et al. 2012a). If stimulants have similar effects on brain activation in individuals with ADHD, they may alter the risk for later SUD, which is in line with reports that psychostimulant treatment in ADHD patients may decrease SUD risk (Quinn et al. 2017). Alternatively, nonstimulant agents, which are known to have minimal effects on reward processing and sensitization, would be the prudent treatment choice if heightened reward-related activation is an intrinsic feature of ADHD, and is further enhanced by the presence of familial SUD. Studies that can more definitively address these hypotheses wait to be conducted in the future.
Footnotes
Disclosures
K.S. and X.L. declare that they have no competing financial interests. I.I. is a member of the Data Safety Monitoring Committee at Lundbeck. J.N. is an advisor/consultant for Akili Interactive, Cingulate Therapeutics, Enzymotec, Medice, NLS Pharma, Rhodes, Shire, Supernus.
Supplementary Material
Supplementary Data
Supplementary Figure S1
References
Supplementary Material
Please find the following supplemental material available below.
For Open Access articles published under a Creative Commons License, all supplemental material carries the same license as the article it is associated with.
For non-Open Access articles published, all supplemental material carries a non-exclusive license, and permission requests for re-use of supplemental material or any part of supplemental material shall be sent directly to the copyright owner as specified in the copyright notice associated with the article.