
Abstract
Objectives:
To evaluate the clinical and neurochemical effects of 12-week fish oil, a source of omega-3 polyunsaturated fatty acids (n-3 PUFAs), in depressed adolescents with a family history of bipolar I disorder.
Methods:
Adolescents with a current Diagnostic and Statistical Manual of Mental Disorders, 4th edition, Text Revision diagnosis of Major Depressive Disorder or Depressive Disorder not otherwise specified, a Childhood Depression Rating Scale-Revised (CDRS-R) Version raw score of ≥40, and at least one biological parent with bipolar I disorder were randomized to double-blind treatment with fish oil (2100 mg/day) or placebo for 12 weeks. The primary outcome measure was change in CDRS-R total score, and secondary outcomes measures were change in manic symptoms (Young Mania Rating Scale), global symptom and functioning measures (Clinical Global Impression-Severity [CGI-S] /CGI Improvement [CGI-I], Children's Global Assessment Scale, and Child Behavior Checklist), safety and laboratory measures, and anterior cingulate cortex (ACC) and bilateral ventrolateral prefrontal cortex neurometabolite concentrations using proton magnetic resonance spectroscopy at 4 T.
Results:
Fifty-six patients were randomized, and 42 completed the 12-week trial (placebo: n = 21; fish oil, n = 21). Subjects randomized to fish oil, but not placebo, exhibited a significant baseline to endpoint increase in erythrocyte n-3 PUFAs. Reductions in CDRS-R scores did not differ between treatment groups (p = 0.15), and similar remission (p = 0.58) and response (p = 0.77) rates were observed. Fish oil produced a significantly greater decrease in CGI-S (p = 0.0042) and CGI-I (p = 0.036) scores compared with placebo. Baseline to endpoint change in ACC creatine (p = 0.004) and ACC choline (Cho) (p = 0.024) differed significantly between groups. Baseline ACC Cho levels were inversely correlated with baseline and baseline to endpoint change in CDRS-R scores, and baseline to endpoint change in ACC Cho correlated with baseline-endpoint change in CDRS-R scores and n-3 PUFA. There were no group differences in safety and tolerability ratings or laboratory measures.
Conclusions:
Fish oil monotherapy was not superior to placebo for reducing depressive symptoms in high-risk youth as assessed by the CDRS-R, but was safe and well tolerated and superior to placebo on clinician ratings of global symptom improvement. Associations among ACC Cho levels, depression symptom severity, and n-3 PUFA warrant additional investigation.
Introduction
The initial onset of mania, and by definition bipolar I disorder, most frequently occurs during late childhood and adolescence (Perlis et al. 2009). Having a family history of bipolar I disorder robustly increases the risk of offspring developing psychiatric disorders, including bipolar I disorder, and is associated with an earlier age at onset (DelBello and Geller 2001; Mortensen et al. 2003; Goodwin and Jamison 2007; Post et al. 2014, 2015, 2019). Mood symptoms, including episodic subsyndromal depressive symptoms, and major depressive disorder (MDD) frequently precede the initial onset of mania (Egeland et al. 2000; Skjelstad et al. 2010; Howes et al. 2011; Correll et al. 2014). In youth with a family history of bipolar I disorder, depressive symptoms are associated with an increased risk for developing manic, mixed, or hypomanic episodes (Strober and Carlson 1982; Axelson et al. 2015; Ratheesh et al. 2017). While prospective evidence further suggests that a familial history of bipolar I disorder and depressive symptoms in youth increases risk of bipolarity (Bechdolf et al. 2014), associated risk and resilience mechanisms remain poorly understood.
Antidepressants are the first-line psychopharmacologic treatment for moderate to severe depressive and anxiety symptoms in youth irrespective of familial history of bipolar I disorder. However, antidepressant treatment may be associated with serious psychiatric adverse events (AEs), including manic or hypomanic symptoms and suicidal ideation (Cicero et al. 2003; Faedda et al. 2004; Martin et al. 2004; Baumer et al. 2006; Findling et al. 2008; Chang et al. 2010; Strawn et al. 2014). Importantly, youth with a family history of bipolar I disorder may be more vulnerable to antidepressant-related adverse psychiatric events (Baumer et al. 2006; Findling et al. 2008; Strawn et al. 2014). For example, in a naturalistic treatment study, we found that 57% of youth with a family history of bipolar I disorder exhibited antidepressant-induced manic symptoms (e.g., irritability, aggression, impulsivity, and hyperactivity) (Strawn et al. 2014). Therefore, the potential for antidepressant-induced manic symptoms in youth with a family history of bipolar I disorder highlight an urgent need to evaluate alternative first-line interventions to treat depressive symptoms in this high-risk population.
Evidence from cross-national and cross-sectional studies suggests that lower intake of fish and seafood, which contain high levels of the omega-3 polyunsaturated fatty acids (n-3 PUFAs), eicosapentaenoic acid (EPA) and docosahexaenoic acid (DHA), is associated with increased prevalence rates of MDD (Hibbeln 1998; Peet 2004; Grosso et al. 2016) and bipolar disorder (Noaghiul and Hibbeln 2003). Furthermore, meta-analyses indicate that both MDD (Lin et al. 2010) and bipolar I disorder (McNamara and Welge 2016) are associated with low blood n-3 PUFA levels compared with healthy subjects. Erythrocyte EPA + DHA deficits, and associated increases in the ratio of arachidonic acid (AA) to EPA + DHA (AA/EPA + DHA), coincide with the initial onset of mania and are evident in adolescents with a family history of bipolar I disorder and depressive symptoms (McNamara et al. 2015, 2016). Meta-analyses of controlled trials indicate that supplementation with fish oil is superior to placebo for reducing depression in adults with MDD (Sublette et al. 2011; Grosso et al. 2014; Appleton et al. 2015; Mocking et al. 2016) or bipolar disorder (Sarris et al. 2012). Some preliminary controlled and open-label trials (Nemets et al. 2006; Wozniak et al. 2007; Clayton et al. 2009; McNamara et al. 2014; Trebatická et al. 2017), but not all (Gabbay et al. 2018), have found that fish oil is safe and efficacious for reducing depressive and/or manic symptoms in pediatric and adolescent patients. Other studies further suggest that combining fish oil supplementation with psychoeducational psychotherapy reduces mood symptoms and behavioral problems, and may improve executive function, in youth with mood disorders (Fristad et al. 2015, 2019; Young et al. 2017; Vesco et al. 2018). This and other translational evidence suggest that n-3 PUFA deficiency may represent a modifiable risk factor for progressive mood dysregulation.
Despite growing evidence for beneficial effects of fish oil for treating depression, the central mechanisms of action remain poorly understood. Emerging preclinical evidence suggests that DHA is required for the structural and functional maturation of glutamatergic synapses (Cao et al. 2009; Moreira et al. 2010) and modulates astrocyte glutamate transporter activity and expression (Berry et al. 2005; Grintal et al. 2009; Harbeby et al. 2012). Using proton magnetic resonance spectroscopy (1H MRS), we found that n-3 PUFA biostatus is associated with astrocyte glutamate transporter expression and glutamate concentrations in the prefrontal cortex of adult rats (McNamara et al. 2017). Importantly, meta-analytic evidence from 1H MRS studies indicates dysregulated glutamate homeostasis in frontal regions of patients with MDD (Moriguchi et al. 2019) and bipolar disorder (Gigante et al. 2012), and increases in glutamate levels were observed in the anterior cingulate cortex (ACC) of drug-free bipolar patients following 6-week treatment with lithium (Machado-Vieira et al. 2015). These and other findings suggest that n-3 PUFA supplementation may impact mood, in part, by altering frontal glutamate homeostasis.
To extend these findings, this study combined a randomized double-blind placebo-controlled trial with 1H MRS imaging to evaluate the clinical and neurochemical effects of 12-week fish oil monotherapy in depressed adolescents with a family history of bipolar I disorder. The primary hypothesis was that fish oil supplementation would be more effective than placebo for reducing depressive symptoms. A secondary exploratory hypothesis was that reductions in depressive symptoms following fish oil supplementation would be associated with changes in prefrontal glutamate concentrations.
Methods
Study design
This was a 12-week randomized, double-blind, parallel-group, placebo-controlled fixed-dose trial. Patients, and if ≤18 years their legal guardians, provided written informed assent and consent, respectively, after study procedures were explained. Patients who were ≥18 years of age provided written informed consent. Eligible patients were randomized to treatment by an investigational pharmacist using a schedule stratified by presence versus absence of attention-deficit/hyperactivity disorder (ADHD), presence versus absence of concomitant stimulant treatment (within the ADHD group), and prepubescent versus postpubescent (as determined by the Tanner Questionnaire with scores of 1–2 representing prepubescent and scores of 3–5 indicating postpubescent) (Duke et al. 1980). During the 12-week treatment phase, patients participated in weekly visits to perform symptom and safety ratings, and fasting serum laboratory measures were obtained at baseline and endpoint. 1H MRS scans were performed at baseline and week 12. This study was approved by the Institutional Review Boards of University of Cincinnati Medical Center and was registered at
Study participants
Adolescents (9–21 years of age) with a current Diagnostic and Statistical Manual of Mental Disorders, 4th edition, Text Revision (American Psychiatric Association 2000) diagnosis of MDD, or Depressive Disorder not otherwise specified (NOS) (operationalized as four of five criteria for a major depressive episode or meeting all MDD criteria, except duration), determined by the Washington University at St. Louis Kiddie Schedule for Affective Disorders and Schizophrenia (WASH-U-KSADS) (Geller et al. 2001), a Childhood Depression Rating Scale-Revised Version (CDRS-R (Poznanski et al. 1979, 1983) raw score of ≥40, and at least one biological parent with bipolar disorder, type I, as determined by the Structured Clinical Interview for DSM Disorders (First et al. 1996) were randomized to double-blind treatment. Diagnostic instruments were administered by a trained psychiatrist or qualified clinician with established diagnostic reliability (κ and intra-class correlations >0.9).
Subjects were excluded by mood symptoms resulting from acute medical illness or acute intoxication or withdrawal from drugs or alcohol as determined by medical evaluation; psychotic symptoms; any lifetime history of a manic or hypomanic episode; any lifetime diagnosis of bipolar disorder NOS or cyclothymia; a current diagnosis of dysthymia was not exclusionary if the subject also had a current diagnosis of MDD or Depressive Disorder NOS; a history of a major medical (e.g., diabetes), neurological illness, laboratory abnormalities, or a significant episode (>10 minutes) of loss of consciousness; any history of alcohol or substance dependence (nicotine dependence was permitted) as determined with the WASH-U KSADS in conjunction with the Timeline Follow-Back Interview (Sobell and Sobell 1992); intellectual disability (full scale IQ <70) as determined by the Wechsler Abbreviated Scale of Intelligence (Wechsler 1997); a positive serum pregnancy test; a history of intolerance, hypersensitivity, or nonresponse to omega-3 fatty acids; shellfish or seafood allergy; any history of a clotting disorder that increases risk for bleeding in themselves or a first-degree relative; concomitant use of medications with anticoagulant effects (e.g., aspirin); and use of antipsychotics, other mood stabilizers, stimulants (if opting to discontinue), or atomoxetine within 72 hours (aripiprazole within 2 weeks was exclusionary because of its long half-life) or antidepressants within 5 days (fluoxetine within 1 month was exclusionary because of its long half-life). Subjects diagnosed with ADHD and taking a stable dose of stimulants for the previous month were permitted to continue if it was determined necessary by the subject, their primary caregiver, or their treating clinician in conjunction with the study physician; concomitant use of other psychotropic medications or medications with central nervous system (CNS) effects within five half-lives from baseline or prior treatment with a medication with CNS effects that requires more than 5 days of a screening period; requiring psychiatric admission, as determined by the study physician; and initiation of psychotherapy within 2 months of the screening visit, or plans to initiate psychotherapy during study participation.
Intervention
Fish oil and placebo capsules were provided by the Inflammation Research Foundation, Marblehead, MA. All patients took three placebo or fish oil capsules daily, which were identical in size, shape, and color to protect the blind. The fatty acid composition of capsule oils was assessed periodically by gas chromatography to ensure consistency over the course of the trial. Each fish oil capsule contained 450 mg EPA, 40 mg docosapentaenoic acid (DPA), and 260 mg DHA for a total daily dose of 2130 mg EPA + DHA (1.7:1 EPA/DHA ratio) or 2250 mg n-3 PUFAs (EPA + DPA + DHA). The selected fixed EPA + DHA dose was based on prior evidence that similar doses were safe and efficacious in youth with mood disorders (Wozniak et al. 2007; Clayton et al. 2009; McNamara et al. 2014; Trebatická et al. 2017). Each placebo capsule contained linoleic acid (92 mg), stearic acid (23 mg), palmitic acid (114 mg), and oleic acid (746 mg). The placebo oil was selected because it did not contain n-3 PUFAs and would minimally alter the fatty acid composition of the typical American diet. Patients were advised to take their capsules with daily meals to minimize potential gastrointestinal side effects, and were requested to maintain their current dietary habits over the course of the trial.
Assessments
Symptom ratings
At screening, baseline, and weekly visits, depression symptom severity was determined using the CDRS-R (Poznanski et al. 1979, 1983). Remission was defined as an endpoint CDRS-R total score of ≤28, and response was defined as a ≥50% baseline-endpoint decrease in CDRS-R total score after subtracting the 17-item base score (Emslie et al. 1997). Manic symptom severity ratings were obtained at screening, baseline, and weekly visits using the Young Mania Rating Scale (YMRS) (Young et al. 1978). During the 12-week treatment phase, patients were discontinued from study participation if they had a ≥9-point increase in CDRS-R score or ≥6-point increase in YMRS score from baseline at two consecutive visits. ADHD symptom ratings were obtained at screening, baseline, and each weekly visit using the ADHD Rating Scale (ADHD-RS-IV) (Farles et al. 2001). Overall functioning was assessed at baseline and each weekly visit using The Children's Global Assessment Scale (CGAS) (Shaffer et al. 1983). At screening, baseline, and weekly visits, subjects were rated using the Clinical Global Impression-Severity (CGI-S) Scale to assess overall change in illness severity (Guy 1970). The CGI-Improvement (CGI-I) Scale was administered at all postbaseline visits to assess overall illness change from baseline. Treatment response based upon the CGI-I was defined as ≤2 (i.e., very much improved or much improved). At baseline and weeks 4, 8, and 12, the primary caregiver was requested to complete the Child Behavior Checklist (CBCL) (Achenbach 1991). All clinician ratings were administered by a blinded child and adolescent psychiatrist or psychologist with established inter-rater reliabilities (κ > 0.9).
Safety assessments
A physical examination and a complete medical and treatment history were performed at baseline, and vital signs were collected weekly. AEs were recorded and a structured side-effect interview, the Side Effects Form for Children and Adolescents (SEFCA) (Klein et al. 1994), was administered at weekly visits. The SEFCA was modified to include the following bleeding-related items: “Bruising,” “Nosebleeds,” “Longer than usual bleeding,” and “Heavy bleeding associated with menstruation.” Suicidality symptom ratings were monitored at each study visit using the Columbia Suicide Severity Rating Scale (Posner et al. 2009).
Laboratory analyses
Fasting serum laboratory tests including renal profile, complete blood count, liver and thyroid profiles, lipids, and glucose levels, were performed at baseline and endpoint. To evaluate treatment effects on hemostasis, a platelet function assay (PFA) was performed at baseline and endpoint using collagen-/epinephrine- (normal range: 75–199 seconds) and collagen-/adenosine diphosphate-induced (normal range: 68–112 seconds) platelet aggregation tests (Böck et al. 1999). At baseline and endpoint, erythrocyte fatty acid composition (mg fatty acid/100 mg fatty acids) was determined by gas chromatography (Shimadzu GC-2010; Shimadzu Scientific Instruments, Inc., Columbia, MD), as described previously (McNamara et al. 2014). Fatty acid measure of interest included EPA + DHA, as well as n-3 PUFA (EPA + DPA + DHA), AA (20:4n-6), the AA/EPA + DHA ratio. All laboratory tests were performed by a technician blinded to group assignment.
Proton Magnetic Resonance Spectroscopy
All patients underwent 1H MRS scanning on a Varian 4T whole-body scanner, equipped with a 1H TEM (Transverse ElectroMagnetic) volume head coil. A three-dimensional whole head magnetic resonance imaging using Modified Driven Equilibrium Fourier Transform (MDEFT) pulse sequence was acquired in the sagittal orientation with repetition time (T R) = 13.0 ms, echo time (T E) = 5.3 ms, magnetization preparation time (T MD) = 1.1 ms, data matrix = 256 × 192 × 96, field of view = 256 × 256 × 192 mm, slab thickness = 192 mm, and 32 segments (Lee et al. 1995). We positioned three MRS voxels (20 × 20 × 20 mm) in the right and left ventrolateral prefrontal cortex (VLPFC) and in the ACC. The ACC voxel included Brodmann areas 9, 10, 24, 32, and 47, and VLPFC voxels included Brodmann areas 44, 45, and 46. Details of methods to ensure accurate voxel placement are described elsewhere (Strawn et al. 2012). After MRS voxel positioning, Fast Automatic Shimming Technique by Mapping Along Projections was used to optimize magnetic field homogeneity (Gruetter et al. 1993). A typical linewidth at half height of water signal in the MRS voxel was 10–12 Hz. Spectra were collected using a Point RESolved Spectroscopy pulse sequence. The spectra were acquired T R = 2000 ms, T E = 23 ms, and 128 averages. Water signal was suppressed by the VAriable Pulse powers and Optimizing Relaxation delays method (Tkac et al. 1999).
Tissue segmentation of voxels was determined in MDEFT images, using SPM8 (Statistical Parametrical Mapping). Metabolite levels were corrected using tissue segmentation data (Provencher 1993). Metabolite levels (N-acetyl-aspartate, phosphocreatine plus creatine [PCr + Cr], choline [Cho]-containing compounds, myo-inositol, and glutamate) were determined by analyzing spectra using the software Linear Combination of Model spectra (LCModel) with the water reference in unsuppressed water spectra (Provencher 1993). All metabolite levels were corrected for tissue water concentration and T 1 and T 2 relaxation times, except glutamate. Glutamate was corrected for water concentration only, because T 1 and T 2 relaxation times for glutamate were unavailable at 4 T (Hetherington et al. 1994). Metabolite levels are presented in concentrations (mmol/L). Metabolites with a Cramer-Rao Lower Bound >15% were excluded from further analysis.
Statistical analysis
Statistical analyses were performed using the Statistical Analysis System (SAS Institute, Cary, NC). An intent-to-treat (ITT) approach was used. For longitudinal assessments of YMRS, CDRS-R, CGAS, and CGI-S, mixed linear regression models on postbaseline scores were performed, using baseline scores as a covariate and an autoregressive time series structure to account for temporal dependence among the repeated measures. The treatment-by-time interaction (difference of linear trends over time) was the measure of treatment effect. Age and sex were considered possible covariates in each analysis. Age- and/or sex-adjusted results are presented only if these variables were found to significantly correlate with the outcome (p < 0.05). 1H MRS metabolite concentrations were assessed with a two-way analysis of variance (treatment × time), and group differences in baseline to endpoint change were assessed with unpaired t-tests. Pearson correlations were performed to evaluate associations among selected outcome measures and erythrocyte fatty acid levels. Categorical response variables were compared using Fisher's exact test. All hypothesis tests and confidence intervals are α = 0.05, two sided.
Results
Subject characteristics
A CONSORT diagram illustrating subject recruitment and attrition is presented in Figure 1. A total of 63 patients were screened, and 56 met entrance criteria and were randomized to treatment (placebo, n = 29 and fish oil, n = 27). A total of 42 patients completed the 12-week trial (placebo n = 21 and fish oil n = 21). Six patients were lost to follow-up postrandomization (placebo n = 4 and fish oil n = 2), two patients were withdrawn before completing the study due to a perceived lack of efficacy (placebo n = 1, week 3 and fish oil n = 1, week 2), and six patients withdrew consent due to difficulties attending weekly study visits (placebo n = 3, weeks 6, 7, and 8, and fish oil n = 2 weeks 1, 2, and 10) or difficulty swallowing capsules (fish oil n = 1, week 1). Demographic and clinical characteristics of the ITT sample are presented in Table 1. There were no significant differences in demographic, anthropomorphic, or clinical characteristics of patients randomized to placebo and fish oil. The overall mean age of participants was 14.1 ± 3.0 years, a majority were girls (80%) and white (65%), and the mean baseline CDRS-R score was 47 ± 7.6 (range: 30–67).

Diagram illustrating the flow of subject recruitment and attrition.
Demographic and Clinical Characteristics
Values are group mean ± SD or number of subjects (n) and percent (%).
t-tests or χ 2.
SD, standard deviation; BMI, body mass index; PUFA, polyunsaturated fatty acid; WASI, Wechsler Abbreviated Scale of Intelligence; MDD, major depressive disorder; NOS, not otherwise specified; CDRS-R, Childhood Depression Rating Scale-Revised; YMRS, Young Mania Rating Scale; ADHD, attention-deficit/hyperactivity disorder; CGAS, Children's Global Assessment Scale; CGI-S, Clinical Global Impression-Severity; CBCL, Child Behavior Checklist; RBC, red blood cell; TTL, total.
Fatty acid analyses
At baseline, there were no significant group differences in erythrocyte n-3 PUFA (Table 1), and no group differences were observed for EPA + DHA (p = 0.92) or the AA/EPA + DHA ratio (p = 0.47). The mean baseline erythrocyte EPA + DHA composition was 3.2 ± 0.7%. The group by visit (baseline, week 12) interaction was significant for EPA (p ≤ 0.0001), DPA (p = 0.0001), DHA (p ≤ 0.0001), EPA + DHA (p ≤ 0.0001), n-3 PUFA (p ≤ 0.0001), AA (p = 0.02), and the AA/EPA + DHA ratio (p ≤ 0.0001) (Table 2). At week 12, n-3 PUFA composition increased significantly from baseline in the fish oil group (+45%, p ≤ 0.0001), but not in the placebo group (−5%, p = 0.29), and EPA + DHA composition increased significantly from baseline in the fish oil group (+48%, p ≤ 0.0001), but not in the placebo group (−9%, p = 0.12). The AA/EPA + DHA ratio decreased significantly in the fish oil group (−50%, p ≤ 0.0001), but not in the placebo group (+9%, p = 0.06). At week 12, the mean erythrocyte EPA + DHA composition of fish oil-supplemented patients was 6.3 ± 1.7% versus 3.0 ± 0.4% in the placebo group (p ≤ 0.0001), and n = 19 (91%) participants in the fish oil group and n = 1 (5%) in the placebo group had an EPA + DHA value of ≥4.0% (p ≤ 0.0001).
Erythrocyte Fatty Acid Composition
Values are group mean composition (mg fatty acid/100 mg fatty acids) ± SD.
Group × time interaction (two-way ANOVA).
p ≤ 0.01, *** p ≤ 0.0001, pre vs. post within group t-test.
SD, standard deviation; ANOVA, analysis of variance; AA, arachidonic acid; EPA, eicosapentaenoic acid; DPA, docosapentaenoic acid; DHA, docosahexaenoic acid.
Efficacy
For the longitudinal mixed linear regression assessments, there were no group differences for the CDRS-R (treatment-by-time interaction, p = 0.414) (Fig. 2A), and similar baseline to endpoint reductions in CDRS-R scores were observed in both groups (placebo: −16.1 ± 9.4 and fish oil: −19.3 ± 10.1, p = 0.15). Remission (CDRS-R ≤28) was achieved by 50% of patients in the placebo group and 60% in the fish oil group (odds ratio [OR] = 1.5, 95% confidence interval [CI], 0.5–4.5, p = 0.58). Response (≥50% decrease) was achieved by 67.9% of patients in the placebo group and 72% in the fish oil group (OR = 1.2, 95% CI, 0.4–3.7, p = 0.77). There were no group differences for the YMRS (treatment-by-time interaction, p = 0.273) (Fig. 2B), and similar baseline to endpoint reductions in YMRS scores were observed in both groups (placebo: −4.99 ± 5.2 and fish oil: −6.2 ± 5.1, p = 0.39). There were no group differences for the ADHD-R (p = 0.646), CBCL Total (p = 0.676), CBCL Internal (p = 0.569), or CBCL External (p = 0.603). CGAS scores increased (treatment-by-time interaction, p = 0.0082) (Fig. 2C), and CGI-S (p = 0.015) (Fig. 2D) and CGI-I (p = 0.013) scores decreased, at a greater rate in the fish oil group. Treatment response based on the CGI-I (≤2) was achieved by 35.7% of patients in the placebo group and 64% in the fish oil group (OR = 3.2, 95% CI, 1.0–9.85, p = 0.056).
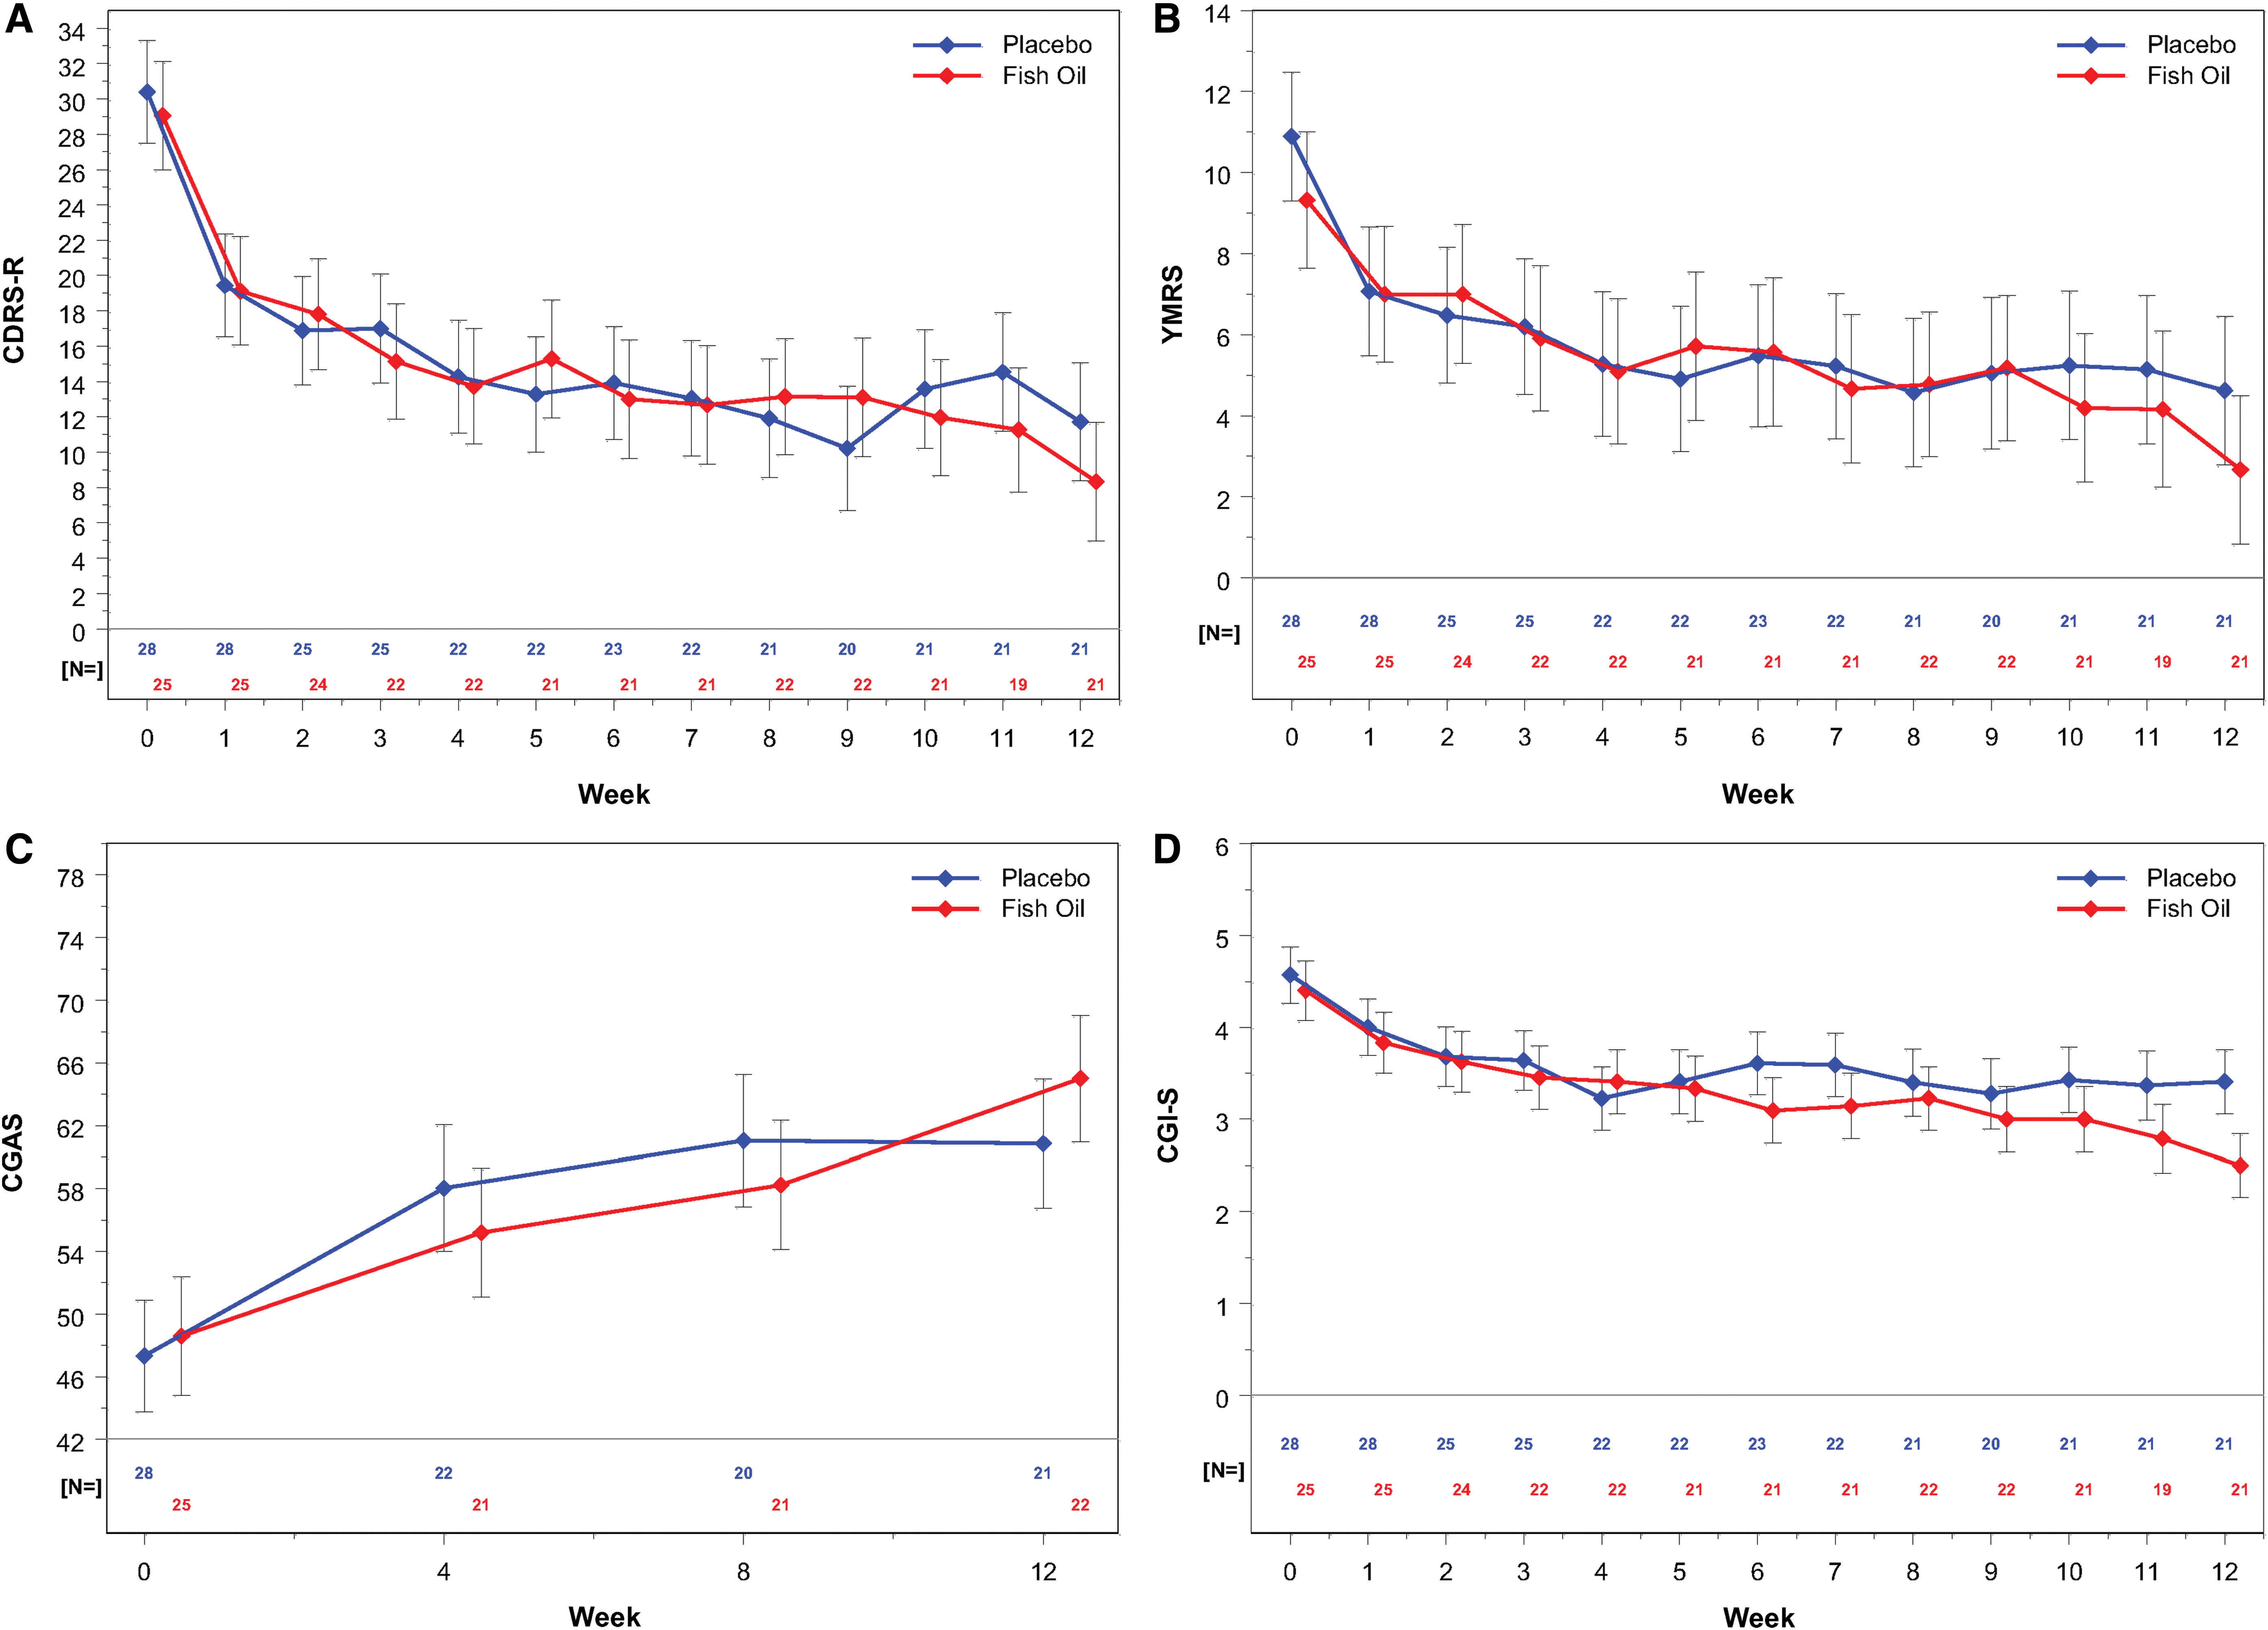
Changes in CDRS-R (after subtracting the 17-item base score)
Relationship with fatty acids
Adding high versus low baseline EPA + DHA levels, determined by a median split, to the mixed model analysis did not yield significant group × time × level interactions for CDRS-R (p = 0.89), YMRS (p = 0.77), CGAS (p = 0.49), or CGI-S (p = 0.89). Using the baseline EPA + DHA levels as a continuous variable interacting with the group × time effect did not change the results. There was a trend for an inverse correlation between baseline CDRS-R scores and n-3 PUFA levels (r = −0.23, p = 0.09), but not EPA + DHA (r = −0.08, p = 0.52) or the AA/EPA + DHA ratio (r = 0.01, p = 0.94). The individual n-3 PUFA DPA (r = −0.30, p = 0.03), but not DHA (r = −0.05, p = 0.71) or EPA (r = −0.15, p = 0.26), was inversely correlated with baseline CDRS-R scores. Among all subjects, but not within treatment groups, the baseline erythrocyte AA/EPA + DHA ratio (r = −0.31, p = 0.023), but not EPA + DHA (r = 0.21, p = 0.14), was inversely correlated with baseline-endpoint change in CDRS-R score. Baseline-endpoint changes in the AA/EPA + DHA ratio and EPA + DHA, as well as the endpoint AA/EPA + DHA ratio and EPA + DHA, were not significantly correlated with baseline to endpoint change in CDRS-R scores. The baseline erythrocyte AA/EPA + DHA ratio was positively correlated (r = 0.40, p = 0.01), and baseline EPA + DHA inversely correlated (r = −0.36, p = 0.02), with baseline-endpoint change in CGI-S scores. There were trends for associations between the endpoint AA/EPA + DHA ratio (r = −0.30, p = 0.056) and EPA + DHA (r = 0.27, p = 0.089) and baseline-endpoint change in CGI-S scores. Baseline-endpoint changes in the AA/EPA + DHA ratio and EPA + DHA were not significantly correlated with baseline-endpoint change in CGI-S scores.
Safety and tolerability
There were no serious adverse events (SAEs) in the ITT group, and there were no group differences in AEs reported by the SEFCA, with the exception of muscle cramps, which were more frequently reported in the fish oil group (50% vs. 21%, p = 0.03), although this would likely not be statistically significant after correcting for multiple comparisons (Supplementary Table S1). There were no significant group differences in bleeding-related AEs although longer than usual bleeding occurred in 11.5% of the fish oil group and 0.3% in the placebo group (p = 0.3). There were no group differences in baseline-endpoint change in any laboratory, vital sign, or anthropomorphic measure (Table 3). While no group differences in baseline-endpoint change in PFA measures of hemostasis were observed (adenosine diphosphate [ADP], p = 0.11 and epinephrine, p = 0.54), at week 12, n = 4 (19%) patient in the fish oil group and n = 0 in the placebo group had ADP values that exceeded the normal upper limit (>112 seconds). At week 12, n = 1 (5%) patient in the fish oil group and n = 1 (5%) in the placebo group had EPA values that exceeded the normal upper limit (>199 seconds).
Vital Signs and Labs
Values are group mean ± SD.
Group × time interaction (two-way ANOVA).
ANOVA, analysis of variance; ADP, adenosine diphosphate; ALP, alkaline phosphatase; ALT, alanine transaminase; AST, aspartate transaminase; BMI, body mass index; EPI, epinephrine; RBC, red blood cell; SD, standard deviation; TSH, thyroid stimulating hormone; VLDL, very low density lipoprotein; WBC, white blood cell.
Proton Magnetic Resonance Spectroscopy
Baseline to endpoint changes in prefrontal metabolite levels are presented in Figure 3. Significant treatment × time interactions were observed for ACC Cr (p = 0.03) and ACC Cho (p = 0.03) only. The baseline to endpoint change in ACC Cr (p = 0.0042) and ACC Cho (p = 0.024) differed significantly between groups. Baseline to endpoint change in ACC Cr was inversely correlated with change in n-3 PUFA (r = −0.46, p = 0.0053) and EPA + DHA (r = −0.56, p = 0.0005), and positively correlated with change in the AA/EPA + DHA ratio (r = 0.58, p = 0.0003), but was not correlated with change in CDRS-R scores (r = −0.17, p = 0.32). Baseline ACC Cho levels were positively correlated with baseline to endpoint change in CDRS-R scores (r = 0.34, p = 0.03), and the baseline-endpoint change in ACC Cho levels were inversely correlated with baseline-endpoint change in CDRS-R scores (r = −0.36, p = 0.034). Among all subjects, the baseline-endpoint change in ACC Cho levels was inversely correlated with baseline-endpoint change in n-3 PUFA (r = −0.43, p = 0.009), EPA + DHA (r = −0.51, p = 0.002), and positively correlated with change in the AA/EPA + DHA ratio (r = 0.53, p = 0.001). Within the fish oil group, the baseline-endpoint change in ACC Cho was inversely correlated with change in EPA + DHA (r = −0.47, p = 0.050).
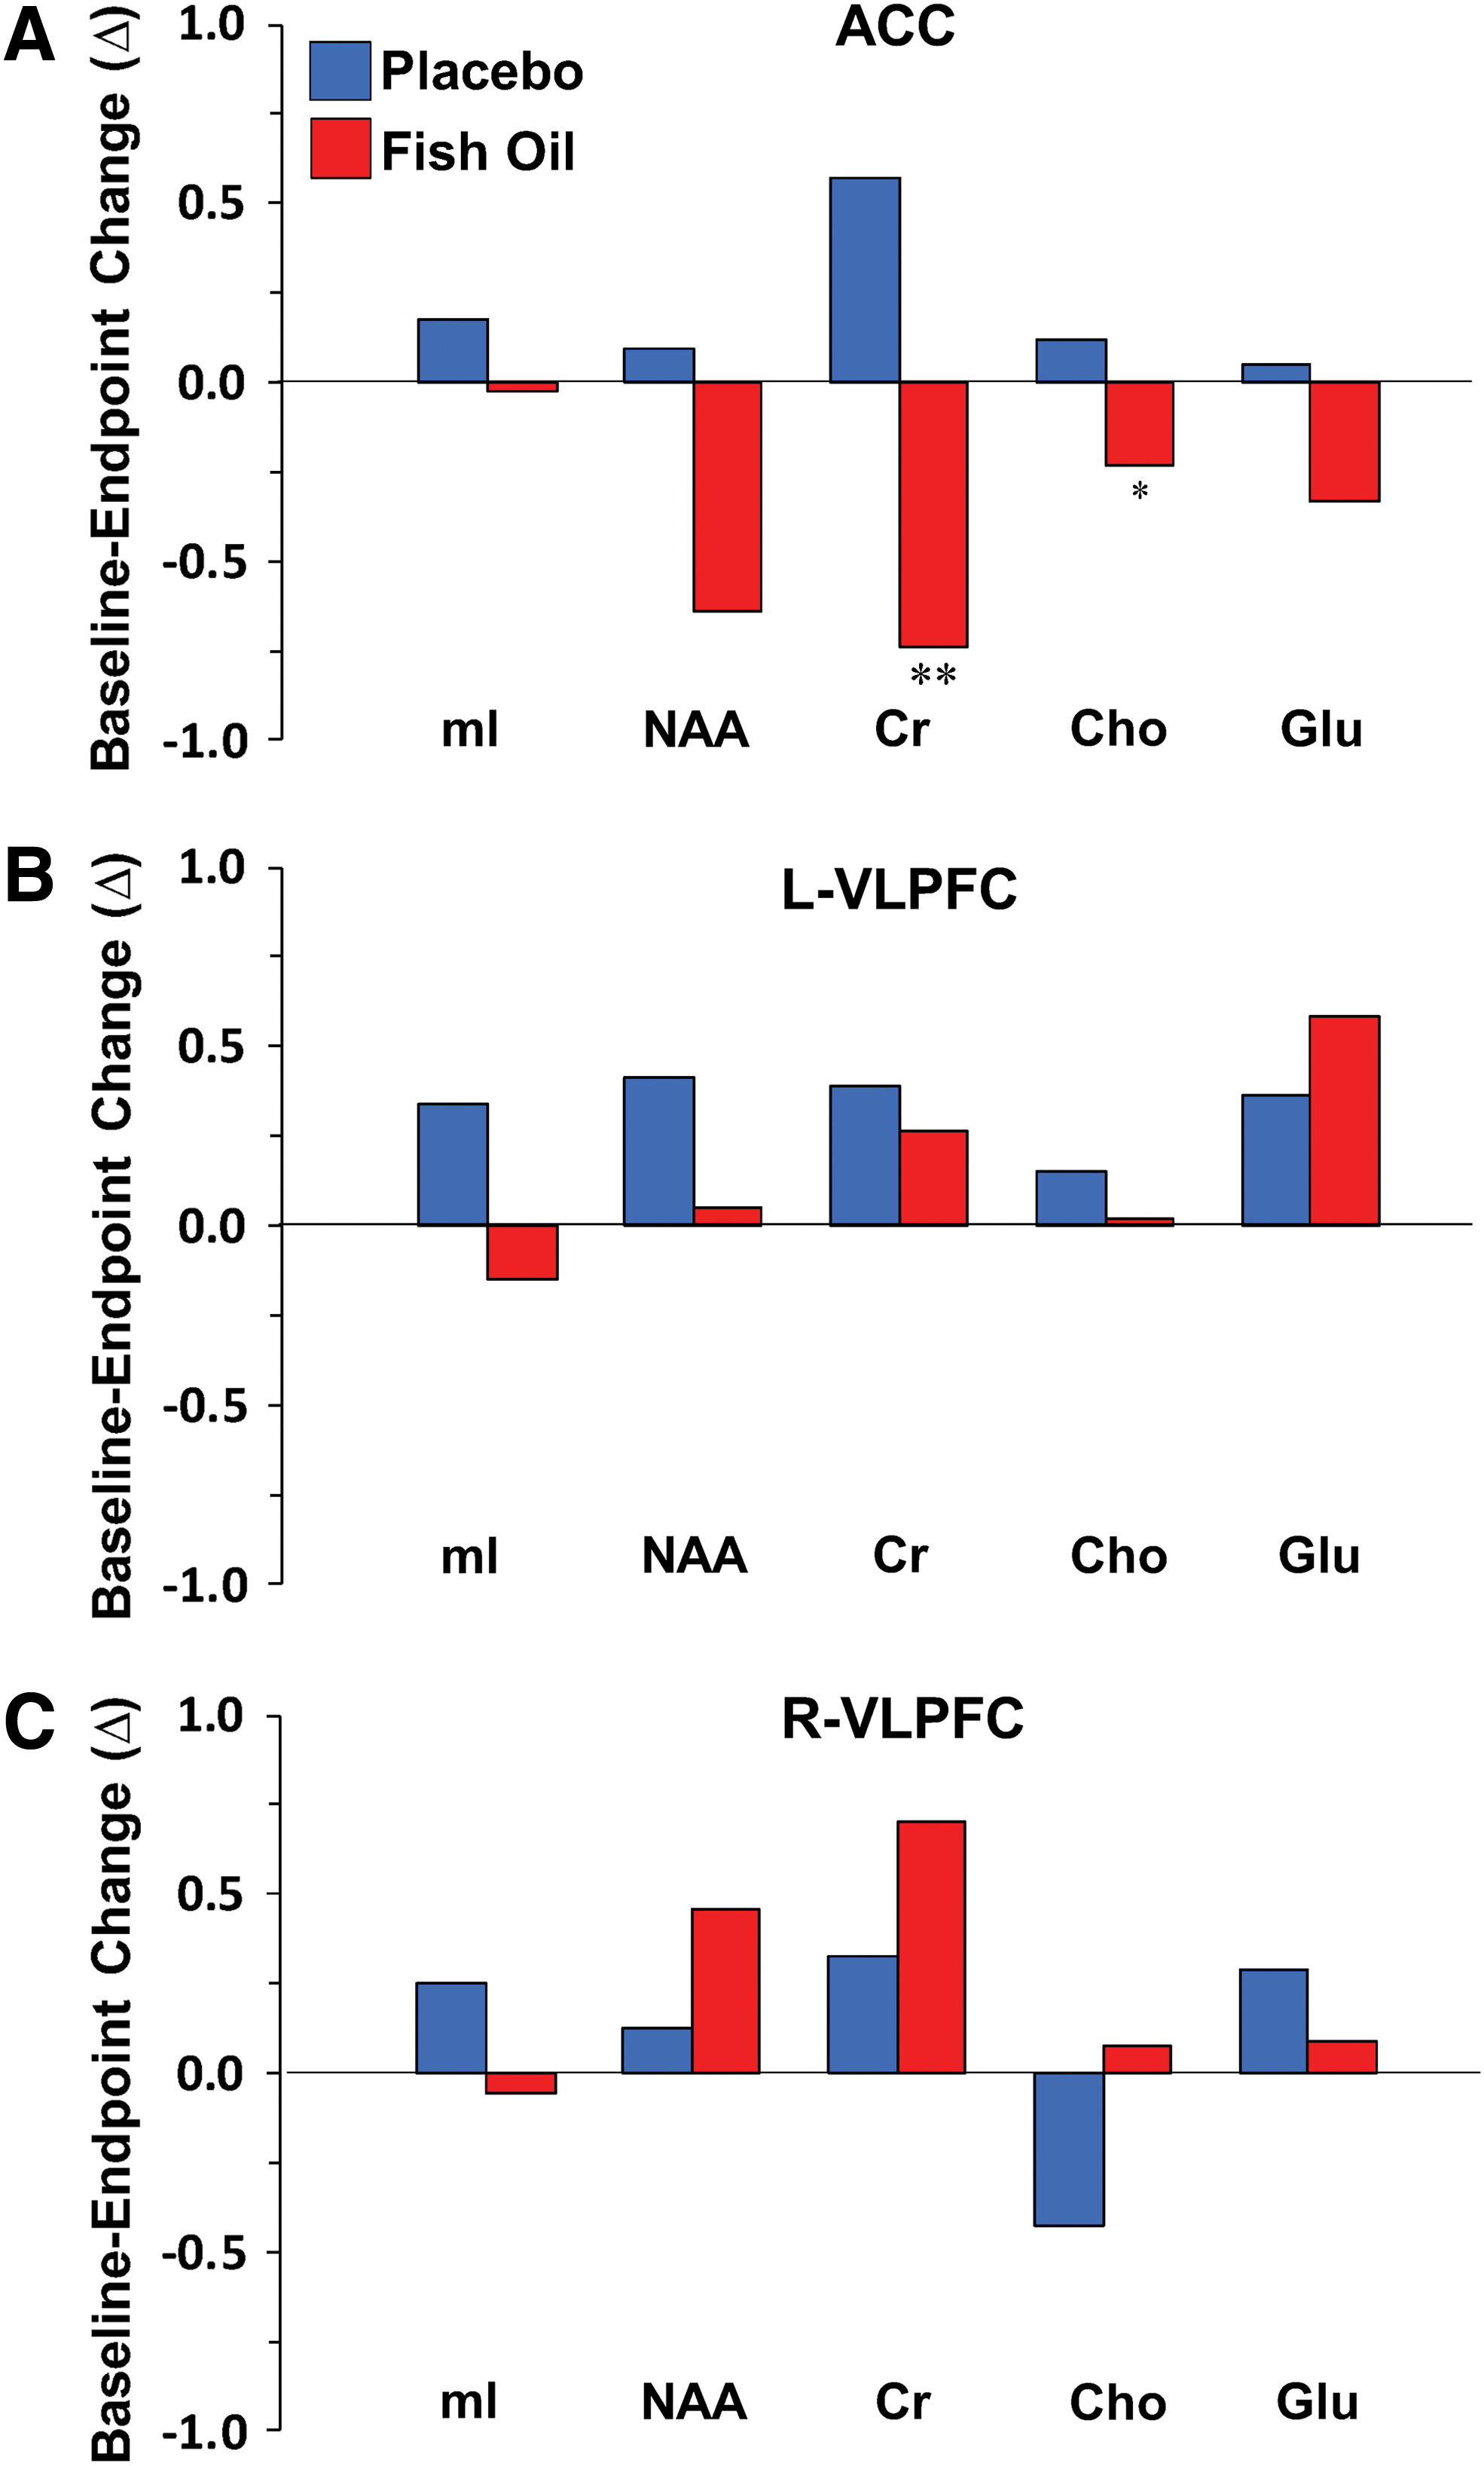
Baseline to endpoint changes in metabolite levels in the ACC
Discussion
This study combined a randomized double-blind placebo-controlled trial with 1H MRS imaging to evaluate the clinical and neurochemical effects of 12-week fish oil monotherapy in youth at high risk for developing bipolar I disorder. Patients receiving fish oil, but not placebo, exhibited a significant baseline-endpoint increase in erythrocyte n-3 PUFA and a reduction in the AA/EPA + DHA ratio. Both treatments resulted in significant and similar reductions in depression symptom severity, and similar remission and response rates, as assessed by the CDRS-R. Reductions in YMRS, ADHD-RS, and CBCL scores were also similar in both groups. Fish oil produced significantly greater decreases in CGI-S and CGI-I scores compared with placebo. Higher baseline EPA + DHA levels were associated with greater baseline-endpoint reductions in CGI-S scores across groups, and a lower baseline erythrocyte AA/EPA + DHA ratio was associated with greater reductions in CDRS-R and CGI-S scores. There were no group differences in AEs, with the exception of muscle cramps, which were more frequently reported in the fish oil group. No group differences were observed for baseline-endpoint changes in vital signs, anthropomorphic measures, or any laboratory measure. While the exploratory assessment of prefrontal neurochemical changes did not support our prediction of differential changes in glutamate, we did observe significant group × time interactions for Cho and Cr concentrations in the ACC. Moreover, baseline and baseline-endpoint change in ACC Cho levels correlated with baseline and baseline-endpoint change in CDRS-R scores. Together, these findings demonstrate that fish oil monotherapy is not superior to placebo for reducing depressive symptoms in high-risk youth as assessed by the CDRS-R, but was safe and well tolerated and superior to placebo on clinician ratings of global symptom improvement. Associated changes with ACC Cho levels warrant additional investigation.
The mean erythrocyte EPA + DHA composition exhibited by all patients at baseline was 3.2%, which is numerically lower than levels observed in healthy adolescents (4.3%) in our previous cross-sectional study (McNamara et al. 2016) and a cohort of healthy adolescents residing in the United States (4.5%) (Harris et al. 2013). At baseline, neither erythrocyte EPA + DHA composition nor the AA/EPA + DHA ratio were significantly correlated depression symptom severity scores, although there was a trend for an inverse correlation with n-3 PUFA. Erythrocyte n-3 PUFA composition increased significantly in patients receiving fish oil, but not placebo. At study endpoint, the mean erythrocyte EPA + DHA composition in patients receiving fish oil was 6.3%, which is numerically higher than levels commonly observed in healthy adolescents (Harris et al. 2013; McNamara et al. 2016). Among all patients, but not within treatment groups, the baseline AA/EPA + DHA ratio, but not EPA + DHA, was inversely correlated with baseline to endpoint change in CDRS-R scores (i.e., smaller baseline ratios were associated with greater improvement). Moreover, higher baseline EPA + DHA levels, and to a similar extent, endpoint EPA + DHA levels, were associated with greater baseline to endpoint reductions in CGI-S scores. The latter findings are in general agreement with a prior study finding that higher erythrocyte EPA + DHA levels, and lower AA/EPA + DHA ratios, at baseline were associated with greater reductions in depression following adjunctive fish oil, although this relationship was not observed in patients receiving placebo (Carney et al. 2016). Together, these findings demonstrate that 12-week supplementation with fish oil is sufficient to robustly increase initially low erythrocyte membrane n-3 PUFA levels in high-risk youth, and suggest that higher baseline EPA + DHA levels favor greater treatment response.
Consistent with prior open-label studies conducted in children and adolescents with MDD or bipolar disorder (Wozniak et al. 2007; Clayton et al. 2009; McNamara et al. 2014), fish oil supplementation resulted in a significant baseline to endpoint reduction in depression symptom severity as assessed by the CDRS-R. Contrary to our hypothesis, fish oil monotherapy was not superior to placebo for reducing depression severity as assessed by the CDRS-R. While this negative finding is not consistent with prior meta-analytic evidence from placebo-controlled trials in adults with MDD (Sublette et al. 2011; Grosso et al. 2014; Appleton et al. 2015; Mocking et al. 2016), it is consistent with a recent controlled trial, which found that 10-week fish oil monotherapy with flexible dosing was not superior to placebo for reducing depressive symptoms in medication-free adolescents with MDD (Gabbay et al. 2018). However, in this study fish oil produced significantly greater decreases in clinician-rated measures of global symptom severity and improvement compared with placebo as assessed by the CGI. The latter observation is consistent with a prior open-label fish oil trial in adolescent bipolar patients (Clayton et al. 2009), whereas Gabbay et al. (2018) did not observe group differences in CGI-I in adolescents with MDD. It is notable that a similar discrepancy in treatment effects on categorical versus continuous measures of symptom severity has been found in other studies of pharmacologic interventions in youth with mood and anxiety disorders (Walkup et al. 2008; Strawn et al. 2015), and meta-analyses of antidepressants in pediatric patients have demonstrated that categorical measures more consistently separate from placebo (Dobson et al. 2019). This discrepancy may relate to CGI scores incorporating additional components of psychopathology that are not assessed by the CDRS-R, and significantly greater changes in CGAS scores in the fish oil group suggest that functional improvements may have contributed to CGI scoring.
A second study objective was to evaluate the general safety and tolerability of fish oil supplementation. There were no group differences in baseline-endpoint change in any laboratory measure, including liver and thyroid function tests, lipid profile and glucose, vital signs, or anthropomorphic measures, including body mass index. There were no SAEs and no group differences in AEs, with the exception of muscle cramps, which were reported more frequently in the fish oil group. Gastrointestinal AEs, which are commonly reported during fish oil supplementation (Chang et al. 2018), were reported at a similar frequency in both treatment groups. Consistent with prior evidence that chronic high-dose fish oil (Harris 2007) or elevated n-3 PUFA blood levels (Salisbury et al. 2012) are not associated with clinically significant increases in bleeding time in adult patients with cardiovascular diseases, we did not observe significant group differences in bleeding-related AEs or baseline-endpoint changes in laboratory measures of hemostasis. It is notable, however, that four patients in the fish oil group, and none in the placebo group, had ADP values exceeding the normal upper limit at week 12, although this was not observed using the EPA test. Nevertheless, assessment of hemostasis during fish oil supplementation is advisable, particularly in patients with a personal or family history of a clotting disorder.
A third objective was to investigate potential neurochemical correlates of antidepressant response to fish oil supplementation. Contrary to our original prediction, we did not observe significant changes in prefrontal glutamate concentrations. We did, however, observe significant group × time interactions for ACC Cr (PCr and Cr) and Cho, which both decreased by ∼10% in the fish oil group, but not the placebo group. While the mechanisms mediating the reductions in ACC PCr + Cr levels following fish oil supplementation are not known, DHA preferentially accumulates in mitochondrial membranes (Suzuki et al. 1997) and the decrease in PCr + Cr levels may reflect a reduction in ACC mitochondrial bioenergetics. Interestingly, a phosphorous MRS study found that unmedicated adolescents with bipolar disorder exhibited elevated frontal PCr levels compared with medicated patients (Shi et al. 2012). The observation that ACC Cho levels were inversely associated with depression symptom severity at baseline is also of interest in view of prior evidence for elevated frontal Cho levels in treatment-naive pediatric and adolescent MDD patients compared with healthy controls (Farchione et al. 2002; Macmaster and Kusumakar 2006). It is notable that Cho is required for the biosynthesis of the structural phospholipid phosphatidylcholine, and a phosphorous MRS study found that erythrocyte EPA + DHA levels were inversely associated with indices of phospholipid catabolism in healthy subjects (Richardson et al. 2001). In addition or alternatively, Cho is required for the biosynthesis of the acetylcholine, and regional acetylcholine levels are highly correlated with Cho signal in rat brain by 1H MRS (Wang et al. 2008). Therefore, reductions in ACC Cho after fish oil supplementation may reflect alterations in phospholipid metabolism and/or acetylcholine biosynthesis/neurotransmission. Additional studies using alternative methods will be required to formally evaluate these and other putative mechanisms.
This study has several notable limitations. First, the sample size was relatively small and the data obtained may not be representative of all high-risk patients. Second, we used a fixed dose of fish oil, and a different fixed dose or a flexible dosing schedule may have produced different results. Third, the duration of fish oil supplementation was relatively short (12 weeks), and greater reductions in depressive symptoms may require longer treatment. Consistent with this possibility, greater separation from placebo emerge at the end of the present 12-week trial. Fifth, we did not obtain measures of inflammation, which may have identified patients more likely to respond to fish oil supplementation (Rapoport et al. 2016). Sixth, we did not systematically assess whether patients became unblinded over the course of the study due to deliberate or accidental (e.g., fishy burbs) tasting of fish oil. Seventh, for the MRS assessments, no corrections were made for multiple comparisons to allow detection of group differences with medium effect sizes, and these findings should therefore be considered preliminary due to the increased risk for type I error. Eighth, the placebo was olive oil, which is a rich source of oleic acid and may have antidepressant effects (Perveen et al. 2013; Li et al. 2017), although the 12-week placebo treatment did not significantly alter any erythrocyte fatty acid, including oleic acid. Study strengths include a well-characterized cohort of high-risk youth, the randomized double-blind placebo-controlled study design, closely matched treatment groups, a relatively comprehensive panel of laboratory measures, including a membrane biomarker of n-3 PUFA biostatus, and 1H MRS assessment of prefrontal neurochemistry.
Conclusion
These results demonstrate that fish oil monotherapy is not superior to placebo for reducing depressive symptoms in high-risk youth as assessed by the CDRS-R, but may improve global symptoms and is safe and well tolerated. Because antidepressant medications may precipitate manic symptoms in this population, the observation that fish oil monotherapy reduced manic symptoms is also notable. These initial findings encourage additional research to evaluate whether adjunctive fish oil can mitigate antidepressant-induced mania and improve tolerability in high-risk youth. In addition, these findings identify associations among ACC Cho levels, depression symptom severity, and n-3 PUFA, which warrant additional investigation.
Clinical Significance
The potential for antidepressant-induced manic symptoms in youth with a family history of bipolar I disorder highlight an urgent need to evaluate alternative first-line treatments. This study found that fish oil monotherapy was not superior to placebo for reducing depressive symptoms in high-risk youth as assessed by the CDRS-R, but was safe and well tolerated and superior to placebo on clinician ratings of global symptom improvement. Additional research is needed to evaluate whether adjunctive fish oil can mitigate antidepressant-induced mania in high-risk youth.
Footnotes
Disclaimer
NIH had no further role in study design; in the collection, analysis, and interpretation of data; in the writing of the report; and in the decision to submit the article for publication.
Acknowledgments
The authors thank the Inflammation Research Foundation, Marblehead, MA, for providing the fish oil and placebo capsules.
Disclosures
R.K.M. has received research support from Martek Biosciences, Inc., Royal DSM Nutritional Products, LLC, Inflammation Research Foundation, Ortho-McNeil Janssen, AstraZeneca, Eli Lilly, NARSAD, and National Institutes of Health (NIH), and previously served on the scientific advisory board of the Inflammation Research Foundation. J.R.S. has received research support from Edgemont, Shire, Neuronetics, Otsuka, Allergan, and NIH, and received material support from and served as a consultant to Assurex/Genesight. He receives royalties from Springer Publishing and UpToDate and has received honoraria from CMEology and Current Psychiatry. M.P.D. receives research support from NIH, PCORI, Acadia, Allergan, Janssen, Johnson and Johnson, Lundbeck, Otsuka, Pfizer, and Sunovion. She is also a consultant, is on the advisory board, or has received honoraria for speaking for Alkermes, Allergan, Assurex, CMEology, Janssen, Johnson and Johnson, Lundbeck, Myriad, Neuronetics, Otsuka, Pfizer, Sunovion, and Supernus. The remaining authors do not have disclosures.
Supplementary Material
Supplementary Table S1
References
Supplementary Material
Please find the following supplemental material available below.
For Open Access articles published under a Creative Commons License, all supplemental material carries the same license as the article it is associated with.
For non-Open Access articles published, all supplemental material carries a non-exclusive license, and permission requests for re-use of supplemental material or any part of supplemental material shall be sent directly to the copyright owner as specified in the copyright notice associated with the article.