
Abstract
Background:
Cortico-striato-thalamo-cortical (CSTC) network alterations are hypothesized to contribute to symptoms of obsessive-compulsive disorder (OCD). To date, very few studies have examined whether CSTC network alterations are present in children with OCD, who are medication naive. Medication-naive pediatric imaging samples may be optimal to study neural correlates of illness and identify brain-based markers, given the proximity to illness onset.
Methods:
Magnetoencephalography (MEG) data were analyzed at rest, in 18 medication-naive children with OCD (M = 12.1 years ±2.0 standard deviation [SD]; 10 M/8 F) and 13 typically developing children (M = 12.3 years ±2.2 SD; 6 M/7 F). Whole-brain MEG-derived resting-state functional connectivity (rs-fc), for alpha- and gamma-band frequencies were compared between OCD and typically developing (control) groups.
Results:
Increased MEG-derived rs-fc across alpha- and gamma-band frequencies was found in the OCD group compared to the control group. Increased MEG-derived rs-fc at alpha-band frequencies was evident across a number of regions within the CSTC circuitry and beyond, including the cerebellum and limbic regions. Increased MEG-derived rs-fc at gamma-band frequencies was restricted to the frontal and temporal cortices.
Conclusions:
This MEG study provides preliminary evidence of altered alpha and gamma networks, at rest, in medication-naive children with OCD. These results support prior findings pointing to the relevance of CSTC circuitry in pediatric OCD and further support accumulating evidence of altered connectivity between regions that extend beyond this network, including the cerebellum and limbic regions. Given the substantial portion of children and youth whose OCD symptoms do not respond to conventional treatments, our findings have implications for future treatment innovation research aiming to target and track whether brain patterns associated with having OCD may change with treatment and/or predict treatment response.
Introduction
Obsessive-compulsive disorder (OCD) is characterized by obsessions and/or compulsions affecting ∼1%–3% of the general population (March and Leonard 1996; Ruscio et al. 2010). Despite the availability of pharmacotherapeutic and psychotherapeutic treatment options, a substantial percentage of individuals do not respond to treatment (Fineberg et al. 2015; Krebs et al. 2015). A better understanding of the neural correlates of illness and etiology is needed to develop novel interventions targeting illness mechanisms. As 50% of adult OCD cases begin in childhood, the study of pediatric OCD may be optimal to gain insights into brain features linked to illness symptoms, given the proximity to illness onset, reduced exposure to confounds (e.g., treatment) (Tibi et al. 2017; Osland et al. 2018), and in light of recent findings documenting detectable brain differences between medicated versus unmedicated individuals (Bruin et al. 2020).
The cortico-striato-thalamo-cortical (CSTC) network is hypothesized as a critical candidate circuit for regulating thoughts, and behaviors (Graybiel et al. 1994). As regulation of thoughts and behaviors is a central feature of OCD, the CSTC has been widely studied in the adult OCD literature (Harrison et al. 2009; Peters et al. 2016; Rădulescu et al. 2017). Meta-analytic studies of structural and task-based functional magnetic resonance imaging (fMRI) data have also implicated CSTC alterations in pediatric OCD (Brem et al. 2012; Boedhoe et al. 2017, 2018).
Recent resting-state fMRI studies have also reported on large-scale neural network alterations involving CSTC circuitry, in case–control pediatric OCD studies, although regions outside the CSTC have been implicated as well (Fitzgerald et al. 2010, 2011; Gruner et al. 2014; Weber et al. 2014; Armstrong et al. 2016; Bernstein et al. 2016). In particular, seed-based a priori approaches that have focused on CSTC regions have documented connectivity alterations (both increased and decreased) between striatum and ventral medial frontal cortex or rostral anterior cingulate cortex (ACC), medial dorsal thalamus and dorsal ACC, putamen and insular cortex and orbitofrontal cortex (OFC), and medial frontal cortex and posterior cingulate cortex (Fitzgerald et al. 2010, 2011; Bernstein et al. 2016).
However, brain-wide, hypothesis-free analyses have also found pediatric OCD-control differences in sensorimotor, auditory, and visual networks (Gruner et al. 2014; Weber et al. 2014; Armstrong et al. 2016). As children undergo a period of synaptic pruning that continues into late adolescence, extensive developmental remodeling of brain connections may contribute to the aberrant connectivity suggested to be present by the available literature in pediatric OCD, contributing to risk for illness (Huyser et al. 2009).
Despite studies indicating that medication treatment may have an effect on brain measures in OCD (Boedhoe et al. 2017, 2018; Bernstein et al. 2019), few studies have assessed resting-state connectivity in treatment-naive samples (Weber et al. 2014; Cyr et al. 2020, 2021; Tikoo et al. 2020). However, a recently published longitudinal study in youth with OCD, who were medication naive at baseline, showed increased resting-state fMRI-derived resting-state functional connectivity (rs-fc) within CSTC regions and beyond, following a 12-week course on a Selective Serotonin Reuptake Inhibitor course (Bernstein et al. 2019). Thus, studies of medication-naive pediatric OCD are necessary to examine how rs-fc relates with illness, closer to the timing of onset, and without the confounding effects of medications.
While most resting-state connectivity studies in children and youth with OCD have been conducted using fMRI, fewer studies have used magnetoencephalography (MEG) and electroencephalogram (EEG) to investigate neuronal activity in adult (Koh et al. 2018; Yazdi-Ravandi et al. 2018; Tan et al. 2019) and pediatric OCD (Amo et al. 2006; Korostenskaja et al. 2013; Mogadam et al. 2019) samples. MEG and EEG are neuroimaging techniques that measure extracranial magnetic and electrical fields, respectively (Lopes da Silva 2013).
Both MEG and EEG provide greater temporal resolution of brain activity compared to the blood oxygen level-dependent signal used as an indirect measure of brain activity in fMRI (Sharon et al. 2007; Proudfoot et al. 2014). However, MEG has superior spatial resolution of source localization compared to EEG, as MEG signals are less distorted by head tissue conductivity (Hari et al. 2010; Proudfoot et al. 2014). The combination of higher spatial and temporal resolution enables more accurate and real-time examination of functional connectivity in MEG. Furthermore, metrics such as weight phase lag index (wPLI) can provide a measure of synchronous activity between two brain regions (Vinck et al. 2011; Lau et al. 2012), and within specific frequency bands at which large groups of neurons fire.
Prior evidence has suggested that local and interregional synchronization in specific frequency bands are linked to different brain states and cognitive processes (van Wijk et al. 2012). Importantly, MEG and EEG studies have reported changes in alpha and gamma frequency band activity between adults with OCD and controls (Velikova et al. 2010; Koh et al. 2018; Yazdi-Ravandi et al. 2018; Tan et al. 2019). Such alterations may influence OCD symptoms, given the role of activity in these frequency bands in attention and higher-order cognition (Griffiths et al. 2010; Palva and Palva 2011; Ray and Maunsell 2011). Thus far, we are aware of four MEG studies that examined neural activity in response to cognitive tasks in children and youth with OCD (Amo et al. 2006; Korostenskaja et al. 2013; Mogadam et al. 2019; Nishat et al. 2021).
This includes one study by members of our team, which examined a medication-naive sample (Nishat et al. 2021). Of note, we are aware of just one study that has reported on MEG-derived rs-fc alterations in OCD in an adult majority-medicated sample (Koh et al. 2018). This study showed decreased MEG-derived rs-fc in OCD versus controls across all frequency bands, except for the delta band, in the cortical, subcortical, and limbic lobes (Koh et al. 2018).
In this study, we used MEG and magnetic resonance imaging (MRI) data acquired in participants from the same sample reported on in Nishat et al. (2021) to measure MEG-derived rs-fc in medication-naive children and youth with OCD compared to typically developing controls (TDC). We focused on examining MEG-derived rs-fc of alpha- and gamma-band frequencies, given prior preliminary findings of altered synchronization in these frequency bands measured with MEG in an adult OCD sample at rest (Koh et al. 2018), and based on findings from our pediatric OCD sample during Go/No-Go task performance (Nishat et al. 2021). Based on prior fMRI and MEG findings, we hypothesized that alterations in MEG-derived rs-fc would include both CSTC and non-CSTC circuit regions.
Due to the exploratory nature of this study, we did not hypothesize a specific direction of altered functional connectivity in unmedicated pediatric OCD for several reasons. First, although adult and pediatric OCD-control studies have shown similar spatial patterns of functional connectivity alterations within the CSTC and beyond in OCD (Fitzgerald et al. 2010, 2011; Sakai et al. 2011; Gruner et al. 2014; Ravindran et al. 2020), the direction of altered connectivity across studies remains inconsistent. Second, the paucity of prior rs-fc data examining the impact of serotonergic medications on rs-fc makes a specific prediction of the direction of altered connectivity difficult.
Materials and Methods
Participants and diagnostic criteria
Twenty medication-naive participants diagnosed with OCD were recruited from a tertiary care children's hospital (The Hospital for Sick Children [SickKids], Toronto, Canada; mean age = 11.9 years, standard deviation [SD] = 2.1, age range: 8–16 years, 11 M and 9 F). Fourteen TDC participants without any prior psychiatric diagnosis and no evidence of mental health symptoms based on unstructured self- and parent-report interview were also recruited (mean age = 12.3 years, SD = 2.1, age range 8–16 years; 7 M and 7 F).
Clinical diagnosis of OCD was made by a psychiatrist (P.D.A. or S.H.A.) or psychologist (S.M.) in accordance with the Diagnostic and Statistical Manual of Mental Disorders (DSM) IV-TR diagnostic criteria (Segal 2010) by trained raters using the Schedule for Affective Disorders and Schizophrenia for School-Age Children-Present and Lifetime version (K-SADS-PL) (Kaufman et al. 1997) and Children's Yale-Brown Obsessive Compulsive Scale (CY-BOCS) for assessment of symptom severity. Inclusion criteria for the OCD group were as follows: confirmed DSM-IV-TR OCD diagnosis and medication naive.
Exclusion criteria for both groups included prior psychopharmacological treatment exposure, a history of chronic neurological (other than tic) disorders, bipolar disorder, schizophrenia, or serious head injury resulting in loss of consciousness. Both groups were matched for age, sex assigned at birth, and handedness. The study was approved by the Sick-Kids Research Ethics Board (REB). Informed consent was obtained from all caregivers and assent from all participants. All participants underwent task and resting-state MEG scans followed by MRI scans (in sequence) at SickKids.
Clinical characterization in OCD
The CY-BOCS, a 19-item self-report symptom checklist, was used to rate the severity of obsessive-compulsive symptoms (Scahill et al. 1997). CY-BOCS total score is obtained by summing items 1–10 (each rated 0–4), with the sum of items 1–5 representing the obsession symptom subtotal and the sum of items 6–10 representing compulsion symptom subtotal. The severity of OCD in each participant was categorized based on the CY-BOCS total score (total score <5 = transient, 5–13 = mild, 14–24 = moderate, 25–30 = moderate-severe, and >30 = severe OCD symptoms) (Lewin et al. 2014). The Toronto Obsessive-Compulsive Scale (TOCS) is a parent or youth self-report 21-item scale that provided an additional dimensional quantitative measurement of obsessive-compulsive features (Park et al. 2016).
Neuroimaging measurement
MEG data were acquired at SickKids inside a magnetically shielded room on a whole-head 151 channel CTF MEG system, at a continuous rate of 1200 samples/s and filtered at 0.3–300 Hz. Participant head position relative to MEG sensors was continuously recorded by three fiducials (magnetic coils), placed at nasion, and left and right preauricular points.
Before acquisition of MEG scans, participants were instructed to remain still and to keep their eyes open and fixated on a black cross (2 × 2 cm) that was presented on a semitransparent screen placed 50 cm away. They were instructed to think of nothing in particular, relax with their eyes open. Three minutes of resting-state MEG data were acquired. Acquiring data during the “eyes open” condition allowed us to ensure minimal head and eye movements, by instructing participants to fixate on the black cross (a neutral stimulus). The electro-oculograms were placed distal to the lateral canthus of each eye, and one on the left mastoid process, to track eye-blinking and saccade movements, while a head-tracking system monitored continuous head movement.
After the MEG session, MRI scanning was undertaken on a 3.0T Siemens TIM Trio scanner located in the same research facility. MRI images were collected using a three-dimensional (3D) magnetization-prepared rapid acquisition gradient echo Grappa 2 protocol (repetition time/time to echo = 2300 per 2.96 mseconds, 192 contiguous sagittal slices, 1.0 mm thick, 256 × 256 matrix, and voxel size 1.0 × 1.0 × 1.0 mm) sequence. Participants watched videos using goggles during scanning to minimize head motion. The MEG fiducial points were kept in place for later co-registration of MEG and MRI data.
Data analysis
Data were analyzed with the Fieldtrip Toolbox and automated atlas parcellation software program using Montreal Neurological Automated Anatomical Labeling (AAL) in a MATLAB environment (Oostenveld et al. 2011). MEG data were first resampled at 600 Hz and co-registered with individual structural MRI images by using reference fiducial markers. A single-shell head model was constructed and normalized for each individual MRI image with SPM 8 (Litvak et al. 2011), which is freely available for download (
Power line contaminations were eliminated by applying a notch filter to remove 60 Hz harmonics (60, 120, and 180 Hz). A set of 164 nodes of interest was defined by combining 116 node coordinates of the AAL (Tzourio-Mazoyer et al. 2002) and 48 node coordinates representing resting-state networks from prior fMRI studies (Supplementary Table S1) (Brier et al. 2012; de Pasquale et al. 2012) for time series to be extracted and analyzed. The broadband time series were reconstructed for each participant based on 164 cortical and subcortical coordinates by a linear constraint minimum variance (LCMV) beamformer and were then band-pass filtered into different frequency bands: delta (1–3 Hz), theta (4–7 Hz), alpha (8–12 Hz), beta (12–29 Hz), gamma (30–59 Hz), and gamma2 (60–100 Hz) (Quraan and Cheyne 2010).
The LCMV beamformer or inverse-source modeling allowed an estimation of the reliable MEG signal from the sources of interest, including subcortical regions (the location of 164 nodes) (Quraan et al. 2011; Mills et al. 2012), while suppressing unwanted noise signals beyond the sources (Van Veen et al. 1997; Sekihara et al. 2001). In addition, ocular and nonocular artifacts such as cardiac and muscle activity were removed from the data by beamformer spatial filter, which is effective at suppressing noise signals without rejecting MEG data (Muthukumaraswamy 2013).
A functional connectivity analysis using wPLI was applied to filtered bandwidths. wPLI is weighted by the magnitude of the imaginary component of the cross-spectrum and the value of wPLI represented as an edge between sensors. Although both phase lag index (PLI) and wPLI have been shown to measure synchronous activity between brain regions, wPLI is superior for quantifying true changes in phase synchronization of small magnitude between two signals and is less sensitive to uncorrelated noise sources than PLI (Vinck et al. 2011; Lau et al. 2012).
The signal process Hilbert transform was applied to measure the instantaneous phase of the filtered time series corresponding to the virtual electro/sensor, which was labeled using AAL (Hillebrand et al. 2012). The degree of synchronous activity between two sources was computed by wPLI (value range = 0–1), where a value of 0 indicates no functional connectivity and 1 indicates the highest functional connectivity.
Statistical analysis
For each participant, an adjacent matrix that included the wPLI value as edge weight between 164 nodes of interest was generated, which resulted in a 164 × 164 (source × source × 6 frequencies) matrix of undirected graphs. Undirected adjacency matrices with wPLI values were further investigated using the Network Based Statistic (NBS) approach, which is a cluster-based statistical method on graph components to examine whole-brain network connectivity that are significantly different between groups (Zalesky et al. 2010). NBS first applies mass univariate testing to connections between two sources, such that each connection is assigned with a t-test value.
Any connection that survives the primary threshold tth , range tth = 2.0–4.4, is assembled into a set of supra-threshold connections. NBS further identifies connected graph components in topological space among the set of supra-threshold connections, in which a path can be found between two nodes. A connected graph component provides a measure of a given cluster and can be used to reject the null hypothesis at the network level. The size of each connected graph component is determined by the number of links that are found between connected sources.
NBS also controls for the family wise error rate (FWER) of each connected graph component with permutation testing. In this study, 5000 permutations were used to randomly shuffle group data, with each permutation repeating the steps detailed above, thereby generating the empirical null distribution of the largest component size. Graph components whose size survived a cutoff FWER corrected p < 0.05, indicating a statistically significant difference in MEG-derived rs-fc between OCD and matched TDC group. Functional connectivity networks were visualized by BrainNet Viewer (Xia et al. 2013).
Results
Participant characteristics
The initial sample size consisted of 20 OCD participants and 14 TDC; however, 2 OCD participants were excluded because of excessive head motion and incomplete MEG resting data, and 1 TDC participant was removed from the analysis because the head model could not be constructed. The final sample of 18 OCD and 13 TDC participants (characterized in Table 1) was included in the functional connectivity analysis. Seventeen percent (n = 3) of medication-naive participants with OCD were diagnosed with an additional psychiatric diagnosis. There was no significant difference in age or sex assigned at birth between the OCD and control groups (p > 0.05; Table 1). Nine OCD participants had CY-BOCS total scores in the moderate range (14–24), and six OCD participants had total scores in the moderate-severe range (25–30) at the time of study participation (Table 1).
Sample Characteristics and Behavioral Assessment of Participants with Obsessive-Compulsive Disorder and Typically Developing Control Participants
Note: N/A is used to indicate that CY-BOCS and TOCS scores were not available in the TDC group.
ADHD, attention-deficit/hyperactivity disorder; CY-BOCS, Children's Yale-Brown Obsessive Compulsive Scale; OCD, obsessive-compulsive disorder; SD, standard deviation; TDC, typically developing controls; TOCS, Toronto Obsessive-Compulsive Scale.
Alpha frequency network synchrony
Increased alpha network synchrony was found in the OCD group compared to controls, involving 16 nodes (Table 2) of varying degrees and strength (all p = 0.037, family-wise error [FWE] corrected, d = 0.64, see Table 3). Functional connectivity differences were identified between frontal and subcortical areas, as well as subcortical and cerebellar areas (Fig. 1). No other significant MEG-derived rs-fc difference was found in OCD versus controls.
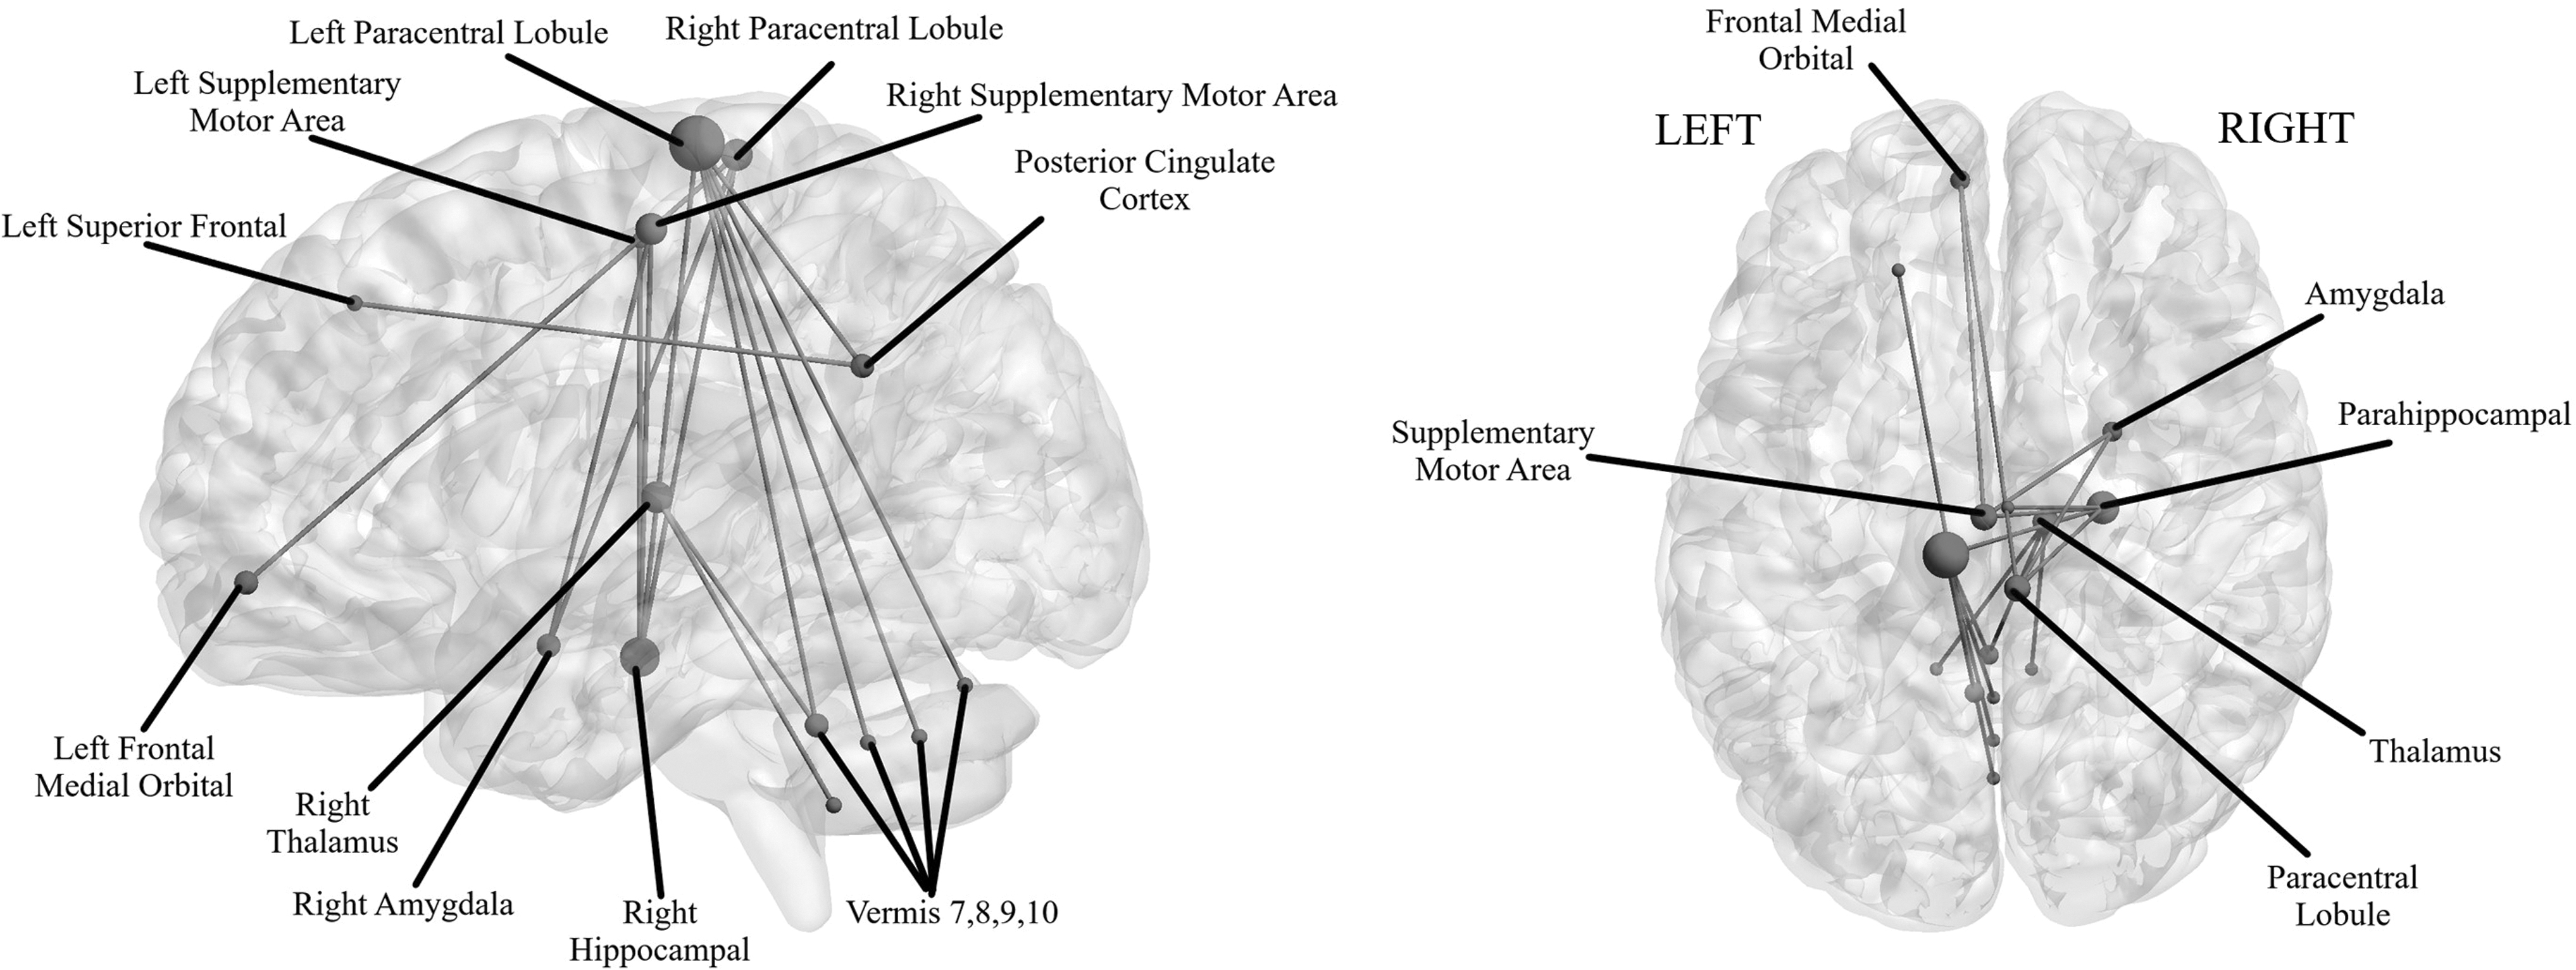
Sagittal (left) and inferior (right) views of resting-state network connectivity differences within the alpha band (8–12 Hz), for the OCD > Control contrast, across 164 nodes with t-threshold = 3.3 (p < 0.05, FWE-corrected). Node size is scaled to the number of connections, such that high degree nodes with more than two connections are larger in size. All images were derived from the NBS and BrainNet Viewer. FWE, family-wise error; NBS, Network Based Statistic; OCD, obsessive-compulsive disorder.
Regions Exhibiting Increased Functional Connectivity in Obsessive-Compulsive Disorder Versus Control Group
The t-Statistic of All Edges in the Connectivity Networks
Effect size for each edge was computed using the following equation: d = t-statistic/sqrt(n). Cohen's d (d) of the networks was calculated by averaging all effect sizes of all edges. The effect size of alpha network connectivity is 0.64 and gamma is = 0.81.
PCC, posterior cingulate cortex.
Gamma frequency network synchrony
Increased gamma network synchrony was also observed in the OCD group compared to controls (all p = 0.033, FWE-corrected, d = 0.81, see Table 3). This increased MEG-derived rs-fc was found between three nodes (Table 2) located across two distant regions; the right temporal and left frontal cortex (Fig. 2). No other significant MEG-derived rs-fc difference in the gamma-band frequency was observed between the OCD and control groups.

Sagittal (left) and inferior (right) views of resting-state network connectivity differences within the gamma band, for the OCD > Control contrast, across 164 nodes with t-threshold = 4.4 (p < 0.05, FWE-corrected). No scaling was applied because each individual node did not have more than two connections. All images were derived from the NBS and BrainNet Viewer. FWE, family-wise error; NBS, Network Based Statistic; OCD, obsessive-compulsive disorder.
Discussion
This study examines MEG-derived resting-state functional connectivity within the alpha- and gamma-band frequencies, in medication-naive children and youth diagnosed with OCD. Compared to controls, participants with OCD displayed altered network connectivity across alpha and gamma frequency bands. In the alpha band, connectivity was increased mainly between frontal, subcortical midline, and cerebellar regions, whereas in the gamma band, connectivity was increased between frontal and temporal regions.
Increased alpha synchronization in our OCD sample encompassed a number of regions that overlap with CSTC circuitry, including frontal and mid-line subcortical areas that have been previously implicated in fMRI studies of adult OCD (Beucke et al. 2013; Sha et al. 2020b). Our finding of increased alpha network connectivity aligns with previous brain-wide, hypothesis-free fMRI studies that suggest children and youth with OCD exhibit increased connectivity between frontal and cingulate cortices, and increased local connectivity within frontal, supplementary motor cortex, and sensorimotor cortices, at rest (Gruner et al. 2014; Armstrong et al. 2016). Alpha synchronization is thought to play a role in binding and coordinating segregated local neural activity into large-scale network communication to support complex cognitive processes, including planning, execution of movements, attention, and memory (Klimesch et al. 1999; Palva and Palva 2011).
The OFC and supplementary motor area (SMA) are among the most relevant regions of the CTSC network for OCD, given their roles in reward-learning, decision making, and error-processing (Ridderinkhof et al. 2004; Rushworth et al. 2011). The increased functional connectivity between left OFC and left SMA found in this study is noteworthy, as prior evidence has also pointed to higher local activity of these two regions in participants with OCD compared to controls (de Wit et al. 2012; Norman et al. 2019). Importantly, the SMA has been shown to be a successful target region for repetitive transcranial magnetic stimulation clinical trials aiming to treat OCD symptoms in individuals with treatment-resistant OCD (Mantovani et al. 2010).
Moreover, increased alpha network connectivity between the amygdala, thalamus, parahippocampus, paracentral lobule, and cerebellum in our OCD sample corroborates prior evidence suggesting that regions beyond the CSTC circuitry are also altered in OCD (Menzies et al. 2008; Milad and Rauch 2012). In particular, the increased cerebellar-thalamic and cerebellar-somatomotor connectivity have been associated with OCD symptoms as these regions play a role in regulating motor and executive control (Sha et al. 2020a).
In contrast to this study, which found hyperconnectivity among frontal, subcortical, and cerebellar regions, a recent MEG study in adults with OCD found decreased synchronous activity in cortical, subcortical, and limbic regions across beta, alpha, gamma, and theta frequency bands (Koh et al. 2018). This discrepancy could be driven by the effects of medication, age range, or compensatory mechanisms developed by adults over time to cope with OCD symptoms, which would differ in our medication-naive pediatric sample.
Cortical-cortical gamma synchronization is thought to modulate higher-order perceptual and cognitive processes (Traub et al. 1996; Debener et al. 2003). In this study, we found enhanced gamma connectivity between frontal and temporal regions in pediatric OCD. However, it is also important to note that alpha frequency bands often interact with other frequency bands, including high gamma. This cross-frequency interaction is necessary to convert segregated neuronal processing into coherent neural communications between brain regions (Canolty and Knight 2010). Therefore, our findings of both increased gamma and alpha network connectivity might reflect increased activity of local gamma in specific regions that relates to the increased alpha-band functional connectivity.
Given that the inferior temporal cortex plays an important role in maintaining active information of an object (Ranganath et al. 2004), our finding of gamma network alterations within the inferior temporal region may reflect the sustained activity that relates to the instruction our participants were given to maintain their attention on a fixed black cross. Of note, emerging evidence has found enhanced gamma synchrony within overlapping functional networks across individuals with a variety of neurodevelopmental disorders, including autism spectrum disorder and attention-deficit/hyperactivity disorder, in addition to OCD (Ye et al. 2014; Khadmaoui et al. 2016).
Although this is, to our knowledge, the first study to examine MEG-derived rs-fc in medication-naive children and youth with OCD, a number of limitations must be considered. Our small sample size limits the potential for generalizability. Available MEG studies in pediatric OCD have included small samples (i.e., n = 10–22) (e.g., see Korostenskaja et al. 2013; Mogadam et al. 2019; Nishat et al. 2021) reflecting the challenges associated with recruiting children with OCD. Thus, our study size is similar to other available MEG studies in pediatric OCD and a unique advantage of our study is that we are examining medication-naive sample.
To address the credibility and stability of our findings, the group differences in functional connectivity were run through 5000 permutations by NBS, an approach that minimizes the likelihood that a small subgroup within our sample is driving our results. The strengths of permutation testing include its ability to account for intersubject variability, small sample size, and greater sensitivity than the standard t-statistic (Nichols and Holmes 2002). This study also includes children across a large age range (8–16 years), across which developmental differences in brain activity and connectivity may influence the direction of results (Hoff et al. 2013; Schäfer et al. 2014; Brookes et al. 2018). We also did not assess specific OCD symptom dimensions due to power limitations and concerns regarding multiple testing in the small sample.
Our findings of altered MEG-derived rs-fc in the regions of the subcortex must also be interpreted with caution. Subcortical activity may not be measured as accurately as cortical activity due to its further distance from the MEG sensors. However, source space solution to the first 90 (including the thalamus and hippocampus, Supplementary Table S1) of 116 nodes provided by AAL used has shown reliability in studies of large-scale network functional connectivity (Doesburg et al. 2013; Dunkley et al. 2014, 2016; Safar et al. 2018).
The LCMV beamformer is an established approach to estimating MEG signals, including subcortical regions, while optimally suppressing noisy signals from unwanted sources and removing ocular and nonocular artifacts (Quraan et al. 2011; Dunkley et al. 2014; Safar et al. 2018). Computational models have shown that it is possible to detect subcortical MEG signals (Attal et al. 2007; Quraan et al. 2011; Meyer et al. 2017), and a recent article that used simultaneous stereoelectroencephalography (SEEG) and MEG shows direct evidence of measuring reliable subcortical activity (Pizzo et al. 2019). A general limitation of resting-state data is the variability in thought wandering across participants, while lying at rest (Mason et al. 2007; Christoff et al. 2009).
The 3 minutes of resting-state data acquired are a relatively short time frame to have a reliable MEG signal, which may minimize the effect of group differences on network connectivity. While detailed evaluation of resting-state behavior was not collected in this study, overall, participants were noted to be calm and relaxed during the scan procedure. Nonetheless, given the recent elevation of anxiety in the population at large (Twenge 2000), it would be prudent for future studies to include detailed evaluation of OCD symptoms as well as behavior before and following the MEG scan across all participants. Longer resting-state protocols are required to improve the reliability of the derived signal. Finally, future larger-scale (potentially multisite) studies with greater resources and ability to recruit a larger number of medication-naive participants are needed.
Conclusions
Our findings of neuroanatomical locations displaying increased network connectivity within the alpha and gamma frequency bands supported our hypothesis that regions within and beyond the CSTC would differ in medication-naive children and youth with OCD versus TDC. These findings (1) provide initial indication of the network alterations that may be present in medication-naive children and youth with OCD and (2) indicate that there may be differences in the direction of MEG-derived rs-fc alterations in pediatric OCD, compared to MEG findings in adults, which could be attributable to the developmental nature of our sample and/or proximity to illness onset or the absence of medication effects. Our work suggests that future larger-scale research using MEG in pediatric OCD that considers medication status and potentially tracks rs-fc change following exposure to conventional treatments for OCD is warranted.
Clinical Significance
While our findings of altered network connectivity in a medication-naive sample of children and youth with OCD support prior evidence of functional brain changes in OCD, free from the confounding effects of medication exposure, it is important to note the preliminary nature of our report and that direct clinical translation is as yet out of reach. Our report suggests the need for a future MEG investigation of whether increased alpha or gamma connectivity patterns at baseline may predict treatment outcomes in children and youth with OCD.
Future studies are also needed to replicate our findings and to determine if pharmacological treatment alters or normalizes broad connectivity alterations within the alpha frequency band and/or the more circumscribed connectivity alterations found within the gamma frequency band. Given the substantial portion of children and youth whose OCD symptoms do not respond to conventional treatments, our findings have implications for future treatment innovation research aiming to target and track whether brain connectivity patterns associated with having OCD may change with treatment, and to inform efforts to optimize and personalize our interventions.
Data Availability Statement
The raw data supporting the conclusions of this article will be made available by the corresponding author, S.H.A. The data are not publicly available because we do not have the participant consent. Request to assess this data set should be directed to S.H,A., stephanie.ameis@camh.ca
Ethics Statement
All procedures performed in studies involving human participants were reviewed and approved by the Hospital for Sick Children REB. Written informed consent to participate in this study was provided by participants' legal guardian/next of kin.
Footnotes
Authors' Contributions
V.T. organized and completed all preprocessing, statistical analysis, and wrote the article. S.H.A., P.D.A., and D.J.M. contributed to conceptualization, investigation, resource provision, funding acquisition, and supervision for the study. C.D. assisted with conceptualization, participant recruitment, supervision, data analysis, and interpretation. A.A. contributed to organizing the original dataset. I.M.-E., S.M., R.S., M.C., A.N.V., E.N., D.J.M., P.D.A, and S.H.A. contributed to editing and providing critical revisions of the article. All authors read and approved the submitted version.
Disclosures
The authors declare that the research was conducted in the absence of any commercial and financial relationship that could be construed as a potential conflict of interest.
Supplementary Material
Supplementary Table S1
References
Supplementary Material
Please find the following supplemental material available below.
For Open Access articles published under a Creative Commons License, all supplemental material carries the same license as the article it is associated with.
For non-Open Access articles published, all supplemental material carries a non-exclusive license, and permission requests for re-use of supplemental material or any part of supplemental material shall be sent directly to the copyright owner as specified in the copyright notice associated with the article.