
Abstract
Background:
With evolving understanding of psychiatric diagnosis and treatment, demand for biomarkers for psychiatric disorders in children and adolescents has grown dramatically. This study utilized quantitative electroencephalography (qEEG) to develop a predictive model for adolescent major depressive disorder (MDD). We hypothesized that youth with MDD compared to healthy controls (HCs) could be differentiated using a singular logistic regression model that utilized qEEG data alone.
Methods:
qEEG data and psychometric measures were obtained in adolescents aged 14–17 years with MDD (n = 21) and age- and gender-matched HCs (n = 14). qEEG in four frequency bands (alpha, beta, theta, and delta) was collected and coherence, cross-correlation, and power data streams obtained. A two-stage analytical framework was then used to develop the final logistic regression model, which was then evaluated using a receiver-operating characteristic curve (ROC) analysis.
Results:
Within the initial analysis, six qEEG dyads (all coherence) had significant predictive values. Within the final biomarkers, just four predictors, including F3-C3 (R frontal) alpha coherence, P3-O1 (R parietal) theta coherence, CZ-PZ (central) beta coherence, and P8-O2 (L parietal occipital) theta power were used in the final model, which yielded an ROC area of 0.8226.
Conclusions:
We replicated our previous findings of qEEG differences between adolescents and HCs and successfully developed a single-value predictive model with a robust ROC area. Furthermore, the brain areas involved in behavioral disinhibition and resting state/default mode networks were again shown to be involved in the observed differences. Thus, qEEG appears to be a potential low-cost and effective intermediate biomarker for MDD in youth.
Introduction
Depression is common and debilitating in children and adolescents, causing an increase in risk of suicide, problematic peer relationships, and school and home difficulties (Copeland et al, 2021; Hankin et al, 1998; Mendelson and Tandon, 2016; Patalay and Fitzsimons, 2018). The difficulty in diagnosis, access to care, and morbidity associated with adolescent depression speaks to a need for improved diagnostic tools for depression in youth (Foundation, 2022; Runkle et al, 2022).
Currently, major depressive disorder (MDD) is diagnosed and monitored by mental health professionals utilizing a holistic biopsychosocial approach (Malik and Azeem, 2017). While monitoring can rely on clinical judgment alone, it is often augmented with the help of objective questionnaire-type measures such as the Nine-Item Patient Health Questionnaire (PHQ-9) (Moore et al, 2012). Such metric-based approach to psychiatric care has been shown to improve outcomes and has been the subject of repeated investigation and validation (Gondek et al, 2016; Malik and Azeem, 2017). Despite the utility of these tools, given the continued subjectivity and delay in diagnosis and treatment, there continues to be an unmet need for evidence-based biomarkers in pediatric MDD.
Previous work by our group has focused on readily deployable biomarker modalities such as electroencephalography (EEG), specifically quantitative EEG (qEEG) (McVoy et al, 2019). Before our work, there has been promising data in adult depressed patients (Bachmann et al, 2018; de Aguiar Neto and Rosa, 2019). Before our work, no research has investigated qEEG in adolescents with depressive disorders.
One advantage of qEEG has been the ability to derive useful resting-state data, where no active participation by patients is required to collect data (Olejarczyk et al, 2017; Smitha et al, 2017). This is not to say that resting-state data produce a “quiet brain” image; quite oppositely, these paradigms have yielded new insight into activity in the default mode network (DMN) and other brain regions responsible for internal mentation, self-redirection, and behavioral inhibition (Imperatori et al, 2019; Mason et al, 2007; Winter et al, 2019). Data are accumulating that pathology and dysfunction of resting state networks are associated with the development of mood and anxiety disorders (Imperatori et al, 2019; Palmwood et al, 2017). These data have primarily been in adults with psychiatric illness, highlighting the need for further studies in children and adolescents.
Our preliminary work with qEEG showed activity differences between depressed and healthy teens. Our preliminary work showed a correlation between both the diagnosis of depression and the severity of depressive symptoms and altered connectivity (as measured by coherence) in several frontal brain regions. Interestingly, while this was not initially hypothesized, our study yielded results that suggested altered functional connectivity to the frontal cortex, right prefrontal cortex, and the left parietal cortex—areas commonly implicated in behavioral inhibition (Chumachenko et al, 2015; Dalwani et al, 2014) and the DMN.
Despite its promising use in depressed patients as a biomarker (Olbrich et al, 2015), coherence is only one measure within qEEG with other metrics readily available, including frequency domain “power” analysis (i.e., direct measure of EEG activity in different frequency bands), as well as more complex time domain, or other approaches such as correlation and cross-correlation analysis (Duan et al, 2020).
As such, given our promising coherence pilot findings, we expanded our analysis within the sample used in our previous work to a multifactorial, unified predictive biomarker, incorporating coherence, power, and cross-correlation to allow for a richer analysis. We performed a cross-sectional comparative investigation, collecting coherence, cross-correlation, and power, and utilized these data to create a singular, unified predictive model for adolescent MDD. A unified predictive model using qEEG will allow for better utilization in other samples of adolescents with MDD and more broad applicability in the diagnosis of youth with MDD, speaking to the unmet need of a broadly usable biomarker for adolescents with MDD. We hypothesized that this unified model would produce a classifier that performs better than chance in differentiating MDD from healthy controls (HCs). No diagnostic classifier exists for differentiating youth with MDD from healthy youth, and this report focuses on the development of such a classifier using measures from qEEG.
Methods
Overall study design
EEG and patient psychometric data were collected cross-sectionally from a longitudinal study involving adolescents with MDD. This sample utilized 35 adolescents aged 14–17: 21 with MDD and 14 age- and gender-matched HC youth. Clinical assessments completed during an initial intake session included a diagnostic evaluation by a licensed child psychiatrist, several standardized measures of depression, anhedonia, and anxiety, as well as medication treatments (if deemed required). EEG data were collected during the same visit. The primary outcome was overall coherence, power, and cross-correlation of qEEG measures from each of the 18 node dyads within a total of 2536 ten-second epochs.
Participants
The study and all physical and social media recruitment materials were approved by the local Institutional Review Board, and all subjects and their caregivers provided written consent. MDD participants and HCs were recruited through referral from clinical providers within the department of psychiatry at an urban outpatient clinic, and through community outreach using physical study flyers. Inclusion criteria for MDD cases included: (1) Diagnostic and Statistical Manual of Mental Disorders, 5th edition (DSM-5; American Psychiatric Association [2013]) criteria for MDD based on intake evaluation, (2) confirmed MDD diagnosis by MINI-KID (Sheehan et al, 1998), and (3) CDRS score ≥40 (at least moderate MDD). Exclusion criteria included: (1) current or historic diagnosis of bipolar disorder or any psychotic disorder, (2) prior brain surgery, including devices such as implants or shunts, (3) history of seizure disorder with the exception of febrile seizures, and (4) current/active meningitis. For HCs, exclusion criteria included: (1) no lifetime DSM-IV (American Psychiatric Association [2000]) or DSM-5 psychiatric diagnoses (MDD nor otherwise), (2) no first degree relatives with a history of MDD, bipolar disorder, or psychosis, and (3) no second degree relatives with a history of bipolar disorder or psychosis.
Direct patient measures
The same measures of MDD, anhedonia, and anxiety were utilized as in our previous investigation (McVoy et al, 2019). The Children's Depression Rating Scale-Revised (CDRS-R) was used to assess MDD severity (Mayes et al, 2010; Poznanski et al, 1985), where within a total possible score range from 17 to 113, a cutoff score of ≤28 equated to minimal or no symptoms of depression, and a score of ≥40 indicated clinically significant depression. The Snaith-Hamilton Pleasure Scale (SHAPS) (Snaith, 1993) was used to evaluate anhedonia, or the inability to experience pleasure in normally pleasant experiences, where within a score range 0–14, higher scores indicated more severe anhedonia. The Pediatric Anxiety Rating Scale (PARS) (PARS, 2002) was used to evaluate for anxiety symptoms, where within a total score range from 0 to 35, a score of ≥10 indicated clinically significant anxiety, and scores ≥20 indicated severe anxiety.
Participants were part of a university based outpatient psychiatric clinic. Importantly, participants were not excluded if they were taking psychotropic medication or had significant psychiatric comorbidity. Further details of the assessment of the sample population are described in our previous article (McVoy et al, 2019).
EEG data collection
EEG data were acquired using a Nihon Kohden EEG-1200 data collection system, which is approved by the U.S. Food and Drug Administration for clinical use. Resting EEGs were recorded while subjects were laid quietly with their eyes closed in a sound-attenuated room. Subjects were alerted regularly to avoid drowsiness and were instructed to remain still and inhibit blinks or eye movements during each recording period. EEGs were recorded using a 32-channel enhanced version of the International 10–20 System of Electrode Placement (Supplementary Fig. S1), using the montage in Supplementary Figure S2. The average of C3 and C4 channels is considered as the system common reference, and all other channels are collected with respect to this common reference. The bipolar montage was then used for the analysis by extracting the two desired channels from the available recorded data. The following channels have been acquired: Fp1, Fp2, F7, F8, T7, T8, P7, P8, O1, O2, F3, F4, C3, C4, P3, P4, Fz, Cz, and Pz. In addition, LSO, RSO, LIO, RIO, LOC, and receiver-operating characteristic curve (ROC) channels have been collected to precisely isolate the eye movements.
EEG data analysis
We use the same procedures for calculating the Power Spectrum, Correlation, and Coherence as previously described (McVoy et al, 2019—see Supplementary Data). In this study, we provide brief descriptions.
Power
The Fast Fourier Transform (FFT) provides a computational approach to frequency domain analysis of time series data, and we use the FFT to compute the Periodogram of the signal time series and then this is used to compute the Power [
Cross-correlation
Cross-correlation is a measure of the similarity of two time series as a function of the lag (time delay) between them. Computationally, the signals are shifted relative to each other and then are multiplied and summed, which is known as the sliding dot product.
Coherence
The measure of connectivity using EEG coherence is a measure of the consistency of the phase relationship between two surface EEG signals and can be used to make inference about connectivity. Coherence is frequency domain measure and is calculated between pairs of nodes (EEG electrode locations) and represents a normalized measure of the functional coupling between the signals at the nodes at any given frequency. Given two time-domain signals x and y, coherence is calculated using the autocorrelation and cross-correlation of the signals to compute the power spectral density of x and y, that is,
See addendum for further details of calculations above.
EEG data analysis
Each analysis window includes 10 seconds of EEG data, and each analysis window of EEG data has been visually verified to make sure that there are no eye movements and the data are artifact free. For the analysis of power and coherence the following double banana bipolar channels have been considered: Fp1-F7, F7-T7, T7-P7, P7-O1, Fp2-F8, F8-T8, T8-P8, P8-O2, Fp1-F3, F3-C3, C3-P3, P3-O1, Fp2-F4, F4-C4, C4-P4, P4-O2, Fz-Cz, and Pz-Cz. The results of power and coherence analysis are in the frequency domain, and the power and coherence are computed for each given value of frequency. Then, we calculate the average spectral power and the average coherence for each of the following frequency bands: delta (0.5–4 Hz), theta (4–8 Hz), alpha (8–12 Hz), and beta (12–20 Hz).
For the normalized cross-correlation analysis, the following pairs of referential channels have been used: Fp1 to F7, F7 to T7, T7 to P7, P7 to O1, Fp2 to F8, F8 to T8, T8 to P8, P8 to O2, Fp1 to F3, F3 to C3, C3 to P3, P3 to O1, Fp2 to F4, F4 to C4, C4 to P4, P4 to O2, Fz to Cz, and Pz to Cz. The value of correlation at lag zero has been considered as the measure of time domain similarity between the two EEG referential channels.
Biomarker and predictive analysis
A two-stage analytical framework was used to construct a predictive biosignature for MDD using EEG dyad measurements. These measurements were available for 2536 ten-second epochs across 35 participants (21 MDD, 14 HC). In the first stage (data reduction), logistic regression models (with clustered standard errors to account for the possible correlation of epochs within subjects) were used to examine bivariate associations between each 171 EEG dyad measures and MDD status (outcome). Models for 158 dyad measures converged. Associations for each dyad were p-value ranked, and the top 10% were considered for predictive modeling. In the second stage (predictive modeling), a multivariable logistic model, including the top-ranking measures, was constructed. Predictors not associated with MDD were sequentially removed from the model using a backward stepwise approach, retaining predictors that were associated with MDD with a p-value <0.2. The final predictive logistic regression model was composed of the remaining EEG dyad measures, and a ROC analysis was conducted to evaluate the predictive performance of the final model.
Results
Demographics
Table 1 shows the demographic data for the final sample included in the study, as well as the measured scores, by experimental group. MDD patients and controls did not show significant demographic differences in sex nor race, but were borderline significantly different in mean age, with mean MDD age of 15.9 versus HC of 15.3 years old [t(33) = 2.1, p = 0.50]. As expected, CDRS was significantly different between MDD patients and HCs [mean score 65.3 vs. 18.4, respectively; t(38) = 16.0, p < 0.001]. Notably, all MDD participants were on psychotropic medication, full details of which can be seen in the original pilot article (McVoy et al, 2019).
Demographic Data and Measure Score Averages for Major Depressive Disorder and Healthy Controls
ADHD, attention-deficit/hyperactivity disorder; CDRS-R, Children's Depression Rating Scale-Revised; GAD, generalized anxiety disorder; HC, healthy control; MDD, major depressive disorder; SD, standard deviation; SNRI, serotonin and norephinephrine reuptake inhibitor; SSRI, selective serotonin reuptake inhibitor.
Coherence, cross-correlation, and power measures
Of the 171 examined dyads, 158 (92.4%) converged. Overall, upon the completion of the first stage of the qEEG analytic framework, six significant dyads were found, all of which were coherence. Despite showing some superficially observable differences, no cross-correlation measures reached statistical significance between MDD teens and HCs (Fig. 1). For coherence measures, six measures were found to be statistically significantly different, including F3-C3 alpha, beta, and theta coherence, P3-O1 theta coherence, FP2-F4 theta coherence, and CZ-PZ beta coherence (Table 2). No power measures were found to be significant.
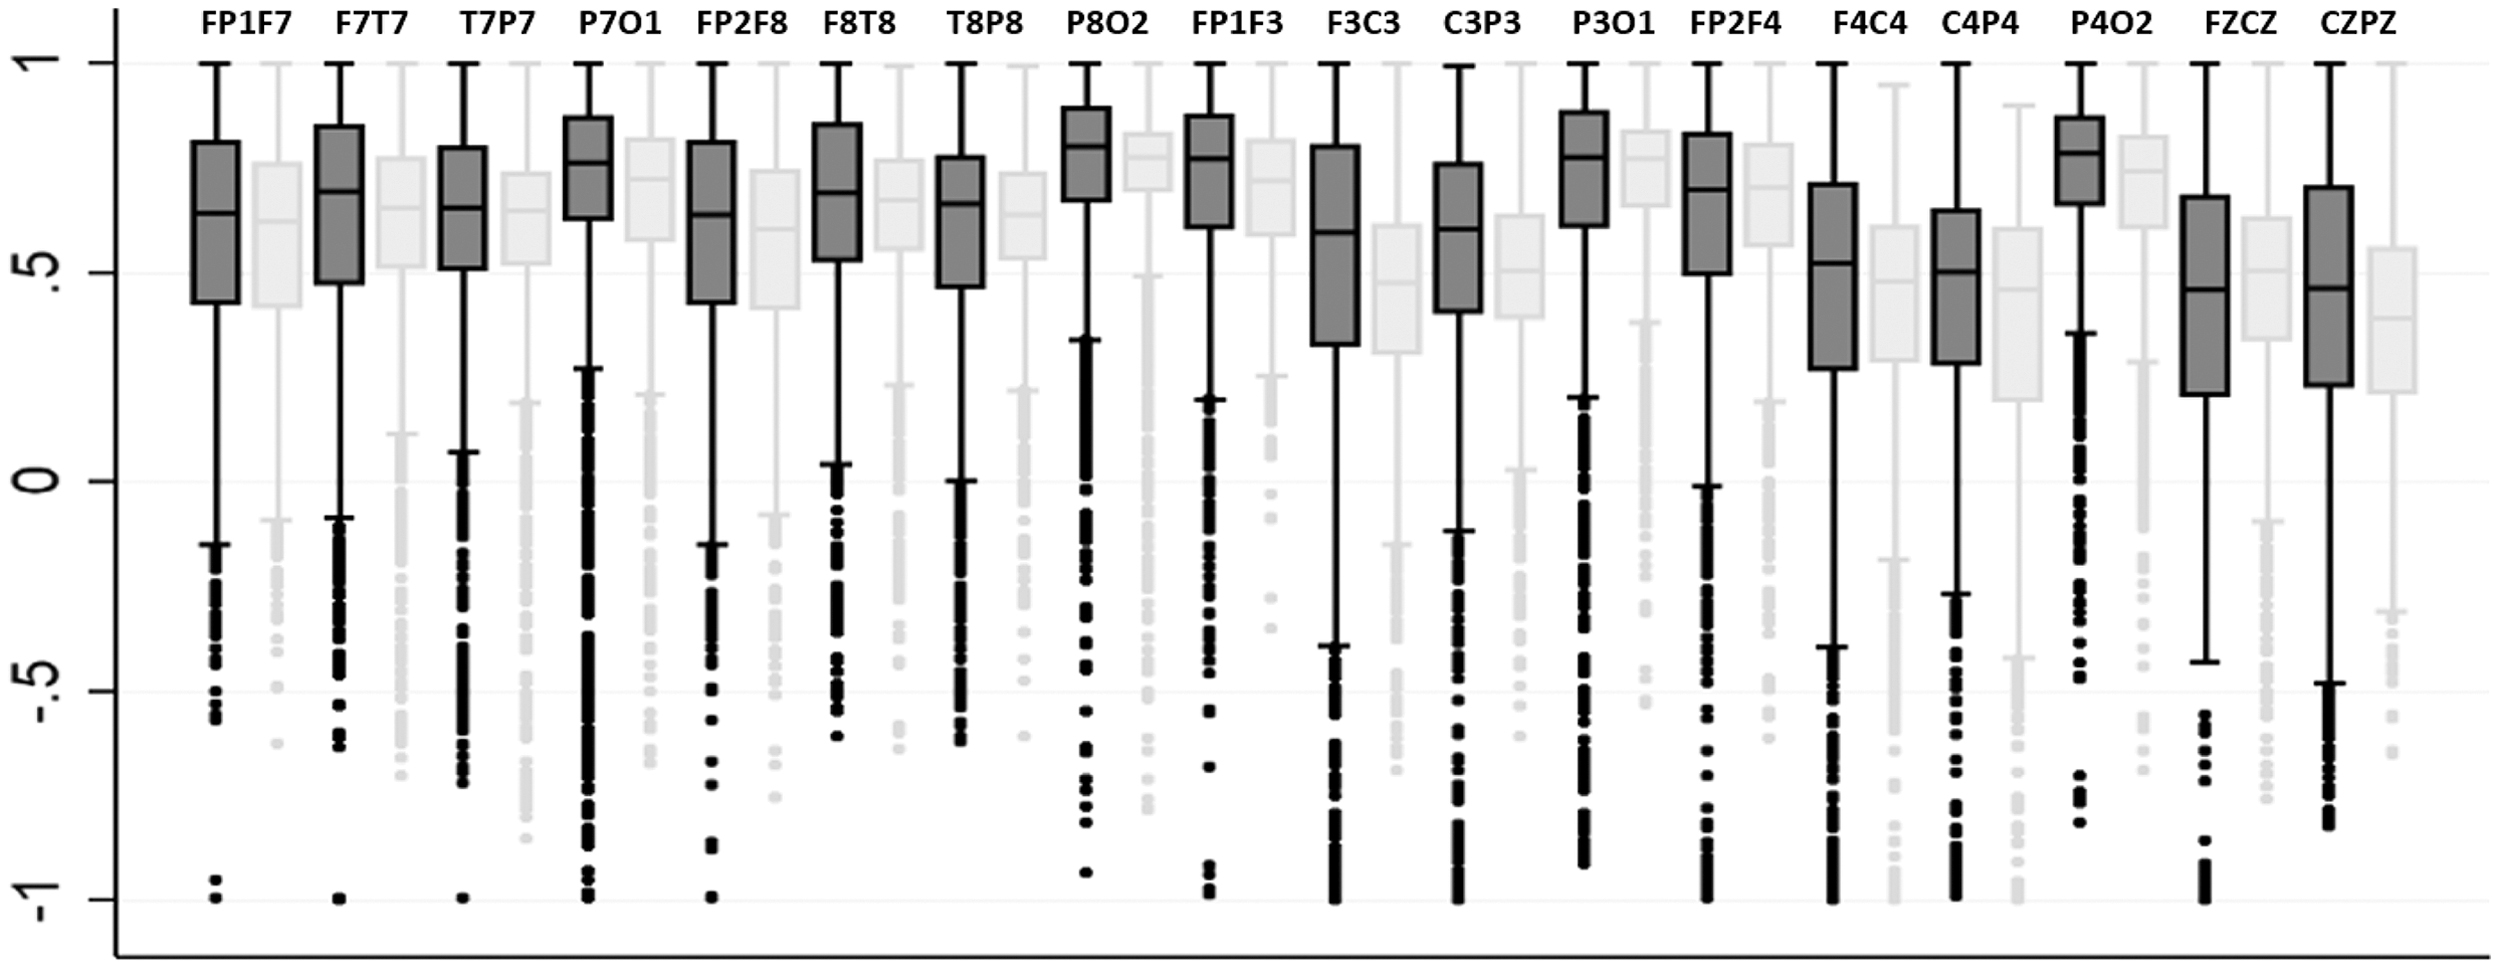
Scatter plot of cross-correlation values. Box plots are graphed and grouped by channels as labeled above each set of two plots, with MDD (gray) versus HC (yellow). C, central; F, frontal; HC, healthy control; MDD, major depressive disorder; O, occipital; P, parietal; T, temporal.
Bivariate Association Results Between the Top 10% of the Electrode Dyads
CI, confidence interval.
In our previous article, we report on the impact that severity of illness, comorbidity, and medications had on measures of EEG coherence (McVoy et al, 2019). Briefly, coherence was correlated with disease severity, both of MDD symptoms and anxiety symptoms. No differences in coherence were found between MDD youth on medication compared with those not on medication.
Biomarker and predictive analysis: data reduction
Within the top 10% of dyads that converged (16 of 158), all had at least near-significant group differences with p values of 0.076 or less and 6 dyads (all coherence) with p-values <0.05 (Table 3). Of the top 16 dyad data source streams, 10 were coherence data (62.5%), 6 were power data (37.5%), and none was cross-correlation data.
Final Four Dyad Data Measures Used to Create the Completed Predictive Model for Major Depressive Disorder Versus Healthy Control
MDD, major depressive disorder.
Biomarker and predictive analysis: predictive modeling
After creating the multivariate predictive model using the top 16 converging dyads, sequential removal of predictors that were not associated with MDD (p ≥ 0.2) yielded a final set of just 4 predictors, including F3-C3 (R frontal) alpha coherence, P3-O1 (R parietal) theta coherence, CZ-PZ (central) beta coherence, and P8-O2 (L parietal occipital) theta power (Table 3).
Figure 2 shows the final predictive model ROC derived using the four above dyad data streams. For 2536 observations, the final model yielded an ROC area of 0.8226 (95% confidence interval = 0.806–0.84).
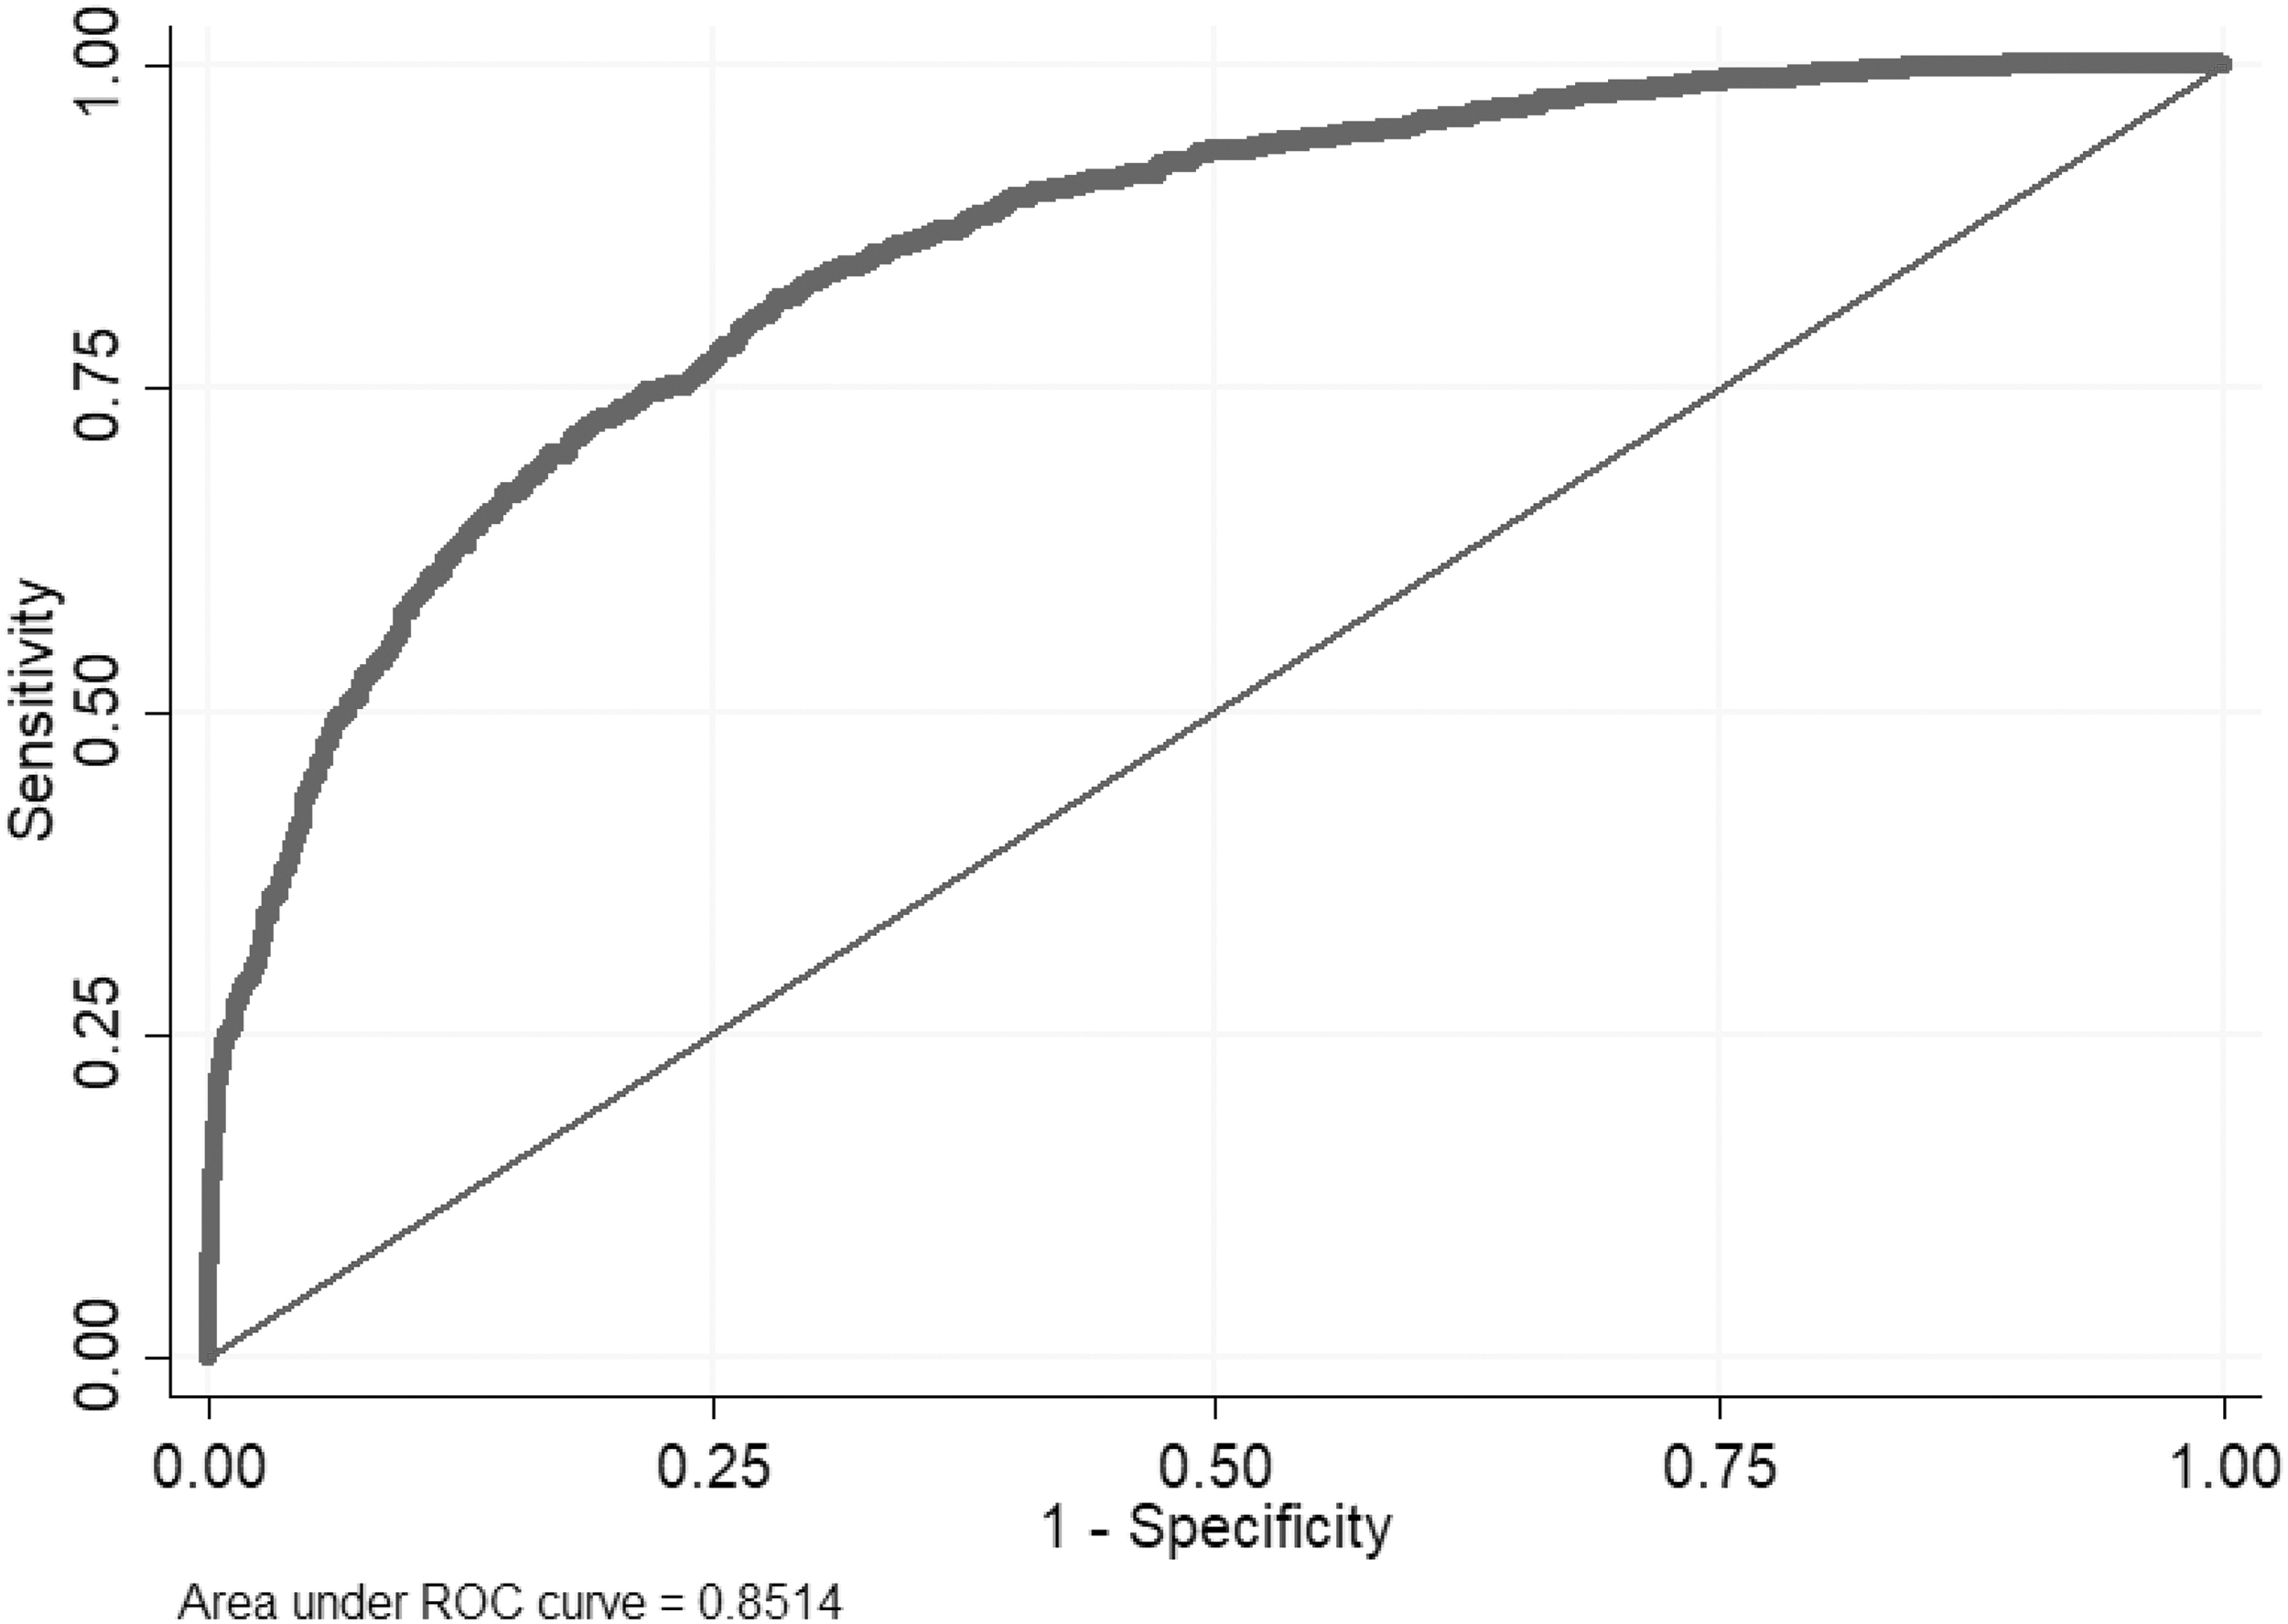
Final ROC for the predictive model of MDD versus HC EEG differences. EEG, electroencephalography; MDD, major depressive disorder; ROC, receiver-operating characteristic curve.
Discussion
In this study, we utilized a data-driven, non-ROI based, noninvasive, and relatively inexpensive approach to develop a biomarker model that can effectively distinguish MDD adolescents versus HCs using only EEG measures. We utilized our previous findings of brain connectivity differences between youth with MDD and HCs to develop a single-variable, robust qEEG predictive model with an ROC area of over 0.8. Given qEEG's ease of large-scale utilization and relatively low cost further makes it a highly promising MDD biomarker for this at-risk and frequently underserved population.
Individually evaluating the most significant dyads reveals continued evidence of decreased connectivity in the frontal cortex, right prefrontal cortex, and the left parietal cortex—areas commonly implicated in descending behavioral inhibition. With our data being “resting state” it is not surprising that some of these regions have close involvement within the DMN (Raichle, 2015), consisting of functionally connected regions of the brain whose activity increases during “rest” and decreases during directed or task-oriented mental states (Buckner et al, 2008). Furthermore, as previously discussed, these data reflect our previous findings that showed altered functional connectivity in regions linked to behavioral inhibition (McVoy et al, 2019). Indeed, functional connectivity within the DMN has consistently been shown to be decreased in depression (Alexopoulos et al, 2012; Clemm von Hohenberg et al, 2018; Yan et al, 2019).
Strengths and limitations
It is reassuring, given that a significant portion of DMN investigations are ROI driven as per above discussion (isolating the DMN itself in describing connectivity changes in MDD), that our primarily data-driven approach still honed in on the DMN and behavioral disinhibition. It is also important to note that the final predictive model parsed the initial qEEG data stream into just four dyads, enabling the above comparison of data driven to ROI approaches.
A limitation of this qEEG investigation is the relatively low number of initial patients. While this N was sufficient to parse out a strong qEEG biomarker, no external validation has yet been completed, nor was the subject pool sufficient for a more qualitative analysis, including medication and treatment effect. Furthermore, the comparison “gold standard” measures of MDD used were still DSM-based patient questionnaires, and no head-to-head investigations were carried out to other MDD biomarkers such as other imaging markers, genetic markers, or chemical markers.
Future directions
For future verification and replication, it would be interesting if re-deriving the ROC in a wider sample or other depressed sample types would yield a similar ROC model (with similar brain region EEG dyads used), or if different depressed subsamples could require tailored re-derivation of new ROCs that could be then selected, that is, a toolkit in future biomarker-type applications.
To our knowledge, our research is the only research, to date, using qEEG as a biomarker in adolescents with depression. Developing and studying biomarkers in youth provide a unique opportunity close in time to disease onset to characterize the disease. Previous work using qEEG as a biomarker in adults may have had limitations secondary to the duration and chronicity of illness. Future work investigating if qEEG has utility to predict treatment response and guide treatment would ultimately be of great clinical utility given the broad availability of EEG as a tool.
Longitudinal studies to investigate qEEG's utility in youth with MDD as a prognostic predictor, a treatment predictor, and to follow youth over time are underway. Future studies are needed with larger samples of youth with MDD to investigate the impact of comorbidities, to understand a more racially and ethnically diverse sample, and to investigate correlates of MDD, such as suicidal ideation and suicidal behavior and the impact these have on qEEG measures.
Conclusions
Overall, our findings suggest that qEEG can be utilized as yet another useful modality for biomarker generation using a data-driven paradigm while minimizing testing cost, patient burden, and postprocessing complexity.
The pursuit of objective, clinically productive, and potentially disease-elucidating biomarkers has continued to be an enduring challenge within modern psychiatry. As neuroscience has continued to be integrated into the field, new approaches to diagnosis and treatment such as the research domain criteria (RDoC) initiative (Insel et al, 2010) have demanded congruent evidence-based, data-driven measures. We believe that we have demonstrated qEEG as an effective modality for such a biomarker. By showing that our qEEG model can reliably correlate with more traditional DSM-based questionnaires like the CDRS, PARS, and SHAPS, this novel qEEG biomarker could thus begin a more ongoing phase of predictive validation, utilization in treatment monitoring, and eventual application as a stand-alone outcome measure given sufficient clinical piloting.
Clinical Significance
This study provides an objective biomarker for MDD that is robust, single-measure, and easy and low-cost to implement. EEG is well-tolerated by children and adolescents and provides a low-cost option compared to other imaging modalities. Furthermore, these data further expand understanding of the role of resting state networks in MDD. Ongoing research could lead to this biomarker to be implemented as an option in diagnosis and treatment management of at-risk or affected youth.
Footnotes
Authors' Contributions
M.M.: conceptualization (lead), review and editing (equal). S.C.: writing—original draft (lead); writing—review and editing (equal). F.B.: formal analysis (lead); writing—review and editing (equal). F.K.: Software (lead); EEG methodology (lead) writing. K.L.: software and formal analysis (supporting); Writing—review and editing (equal).
Disclosures
M.M. receives funding from The Hartwell Foundation for her work in quantitative EEG. She also receives royalties from American Psychiatric Publishing, funding from NIMH, and has received funding from Allergan, Inc., The other authors have no disclosures.
Supplementary Material
Supplementary Data
Supplementary Figure S1
Supplementary Figure S2
References
Supplementary Material
Please find the following supplemental material available below.
For Open Access articles published under a Creative Commons License, all supplemental material carries the same license as the article it is associated with.
For non-Open Access articles published, all supplemental material carries a non-exclusive license, and permission requests for re-use of supplemental material or any part of supplemental material shall be sent directly to the copyright owner as specified in the copyright notice associated with the article.