
Abstract
Objective:
Little U.S. pharmacoepidemiologic study is based on treatment during continuous enrollment for periods more than a year. This study aims to show pediatric patterns of stimulant use (alone or with other psychotropic classes) from Medicaid administrative claims data for stimulant patterns of 3- to 8-year continuous enrollees.
Methods:
A retrospective cohort study was derived from Medicaid enrollment, pharmacy, and diagnosis claims data (2007–2014) in a mid-Atlantic state. Youth aged 2–17 years with 3–8 years of continuous enrollment treated with stimulants were compared with a date-matched comparison group treated without stimulants. Major outcomes include prevalence and duration of stimulant use and patterns of stimulant polypharmacy across relatively long enrollments (3–8 years).
Results:
Among 264,518 unique 2- to 17-year olds with 3–8 years of continuous enrollment, 16.5% had stimulant prescription dispensings, doubling the annual national prevalence of 8.1%. Subgroup analysis showed that the highest prevalence of stimulant use was for 6- to 11-year olds (20.4%), foster care eligible youth (42.3%), and those with 7–8 years of continuous enrollment (20.1%). Externalizing psychiatric disorders were far more common in those treated with stimulants than in those treated without stimulants. The duration of stimulant exposure overall was a median of 487 days, half that of foster care stimulant users. Stimulant polypharmacy with two or more psychotropic classes concomitantly characterized 29.8% of stimulant users. Among those with three or four or more class polypharmacy, 85% and 88%, respectively, had concomitant stimulant and antipsychotic use. The adjusted odds ratio (AOR) of three or more class polypharmacy significantly increased in 12- to 17-year-old age group (AOR = 1.8), foster care eligibility (AOR = 4.5), and among those with the longest enrollment (AOR = 1.7).
Conclusions and Relevance:
Stimulant prevalence in Medicaid-insured youth with continuous enrollment of 3–8 years was twice as common as in annual data sets. Future research should investigate three to five interclass stimulant polypharmacy effectiveness in reliably diagnosed community populations.
Introduction
In published research on population-based psychotropic medication use (pharmacoepidemiology) in the community treatment of children and adolescents since the mid-1990s, stimulants are the most common and best evaluated medication class for the treatment of attention-deficit/hyperactivity disorder (ADHD). Over the past 25 years, clinician-reported ADHD diagnosis and medication use in community-treated populations have shown substantial increases in the United States and internationally (Raman et al., 2018). More recently, pharmacoepidemiology research has focused attention on polypharmacy (concomitant use of stimulants with other psychotropic classes), particularly antipsychotics (Burcu et al., 2016; Lee et al., 2022; Sultan et al., 2019), antidepressants (Girand et al., 2020), and alpha-agonists (Lohr et al., 2018).
Polypharmacy is expanding, although such combinations are often off-label, that is, lacking sufficient data on efficacy as labeled by the Food and Drug Administration (Roberts et al., 2003) for the ADHD indication. Off-label use is common in ADHD polypharmacy and has been explored in terms of evidence of effectiveness (Baker et al., 2021). Collectively, polypharmacy is of increasing interest to profile treatments for childhood behavioral disorders especially where off-label usage occurs (Lee et al., 2022; Lohr et al., 2018). These profiles generate questions for robust research on outcomes of ADHD treatment.
Rarely, pharmacoepidemiologic analysis has produced follow-up studies to estimate polypharmacy in an ADHD cohort of preschoolers (Winterstein et al., 2017) or to assess the annual persistence, that is, duration of stimulant use (Park-Wyllie et al., 2016). Regardless of data sources, studies have provided limited information from community treatment on exposures beyond 1-year enrollee data sets for stimulants alone or concomitantly with other psychotropic classes. Thus, the current study examined stimulant patterns of use in a large cohort of Medicaid-insured youth aged 2–17 years with 3–8 years of continuous enrollment. The study aims to investigate the prevalence of stimulant users in terms of sociodemographic and clinician-reported diagnostic groups and compared with treatment date-matched enrollees without stimulant use. In addition, the duration of stimulant whether used alone or in interclass polypharmacy regimens is assessed.
Methods
Study design
In this retrospective cohort study of Medicaid enrollees, the study population comprised stimulant users (at least one stimulant dispensing) aged 2–17 years at the time of dispensing and had continuous (3–8 consecutive years) Medicaid enrollment from the first stimulant use (N = 43,700). The Medicaid enrollment data were generated based on each patient's monthly Medicaid enrollment status. To be eligible for a full-year enrollment, the patient needed to be enrolled at least 10 months/year (Zito et al., 2013).
The flowchart in Figure 1 illustrates the selection process. Among the stimulant users, the vast majority (91.1%) had continuous enrollment of 3–8 years in Medicaid (N = 43,700). A comparison group consisted of treatment date-matched youth without stimulant use and continuous 3–8 years of Medicaid enrollment (N = 220,818).
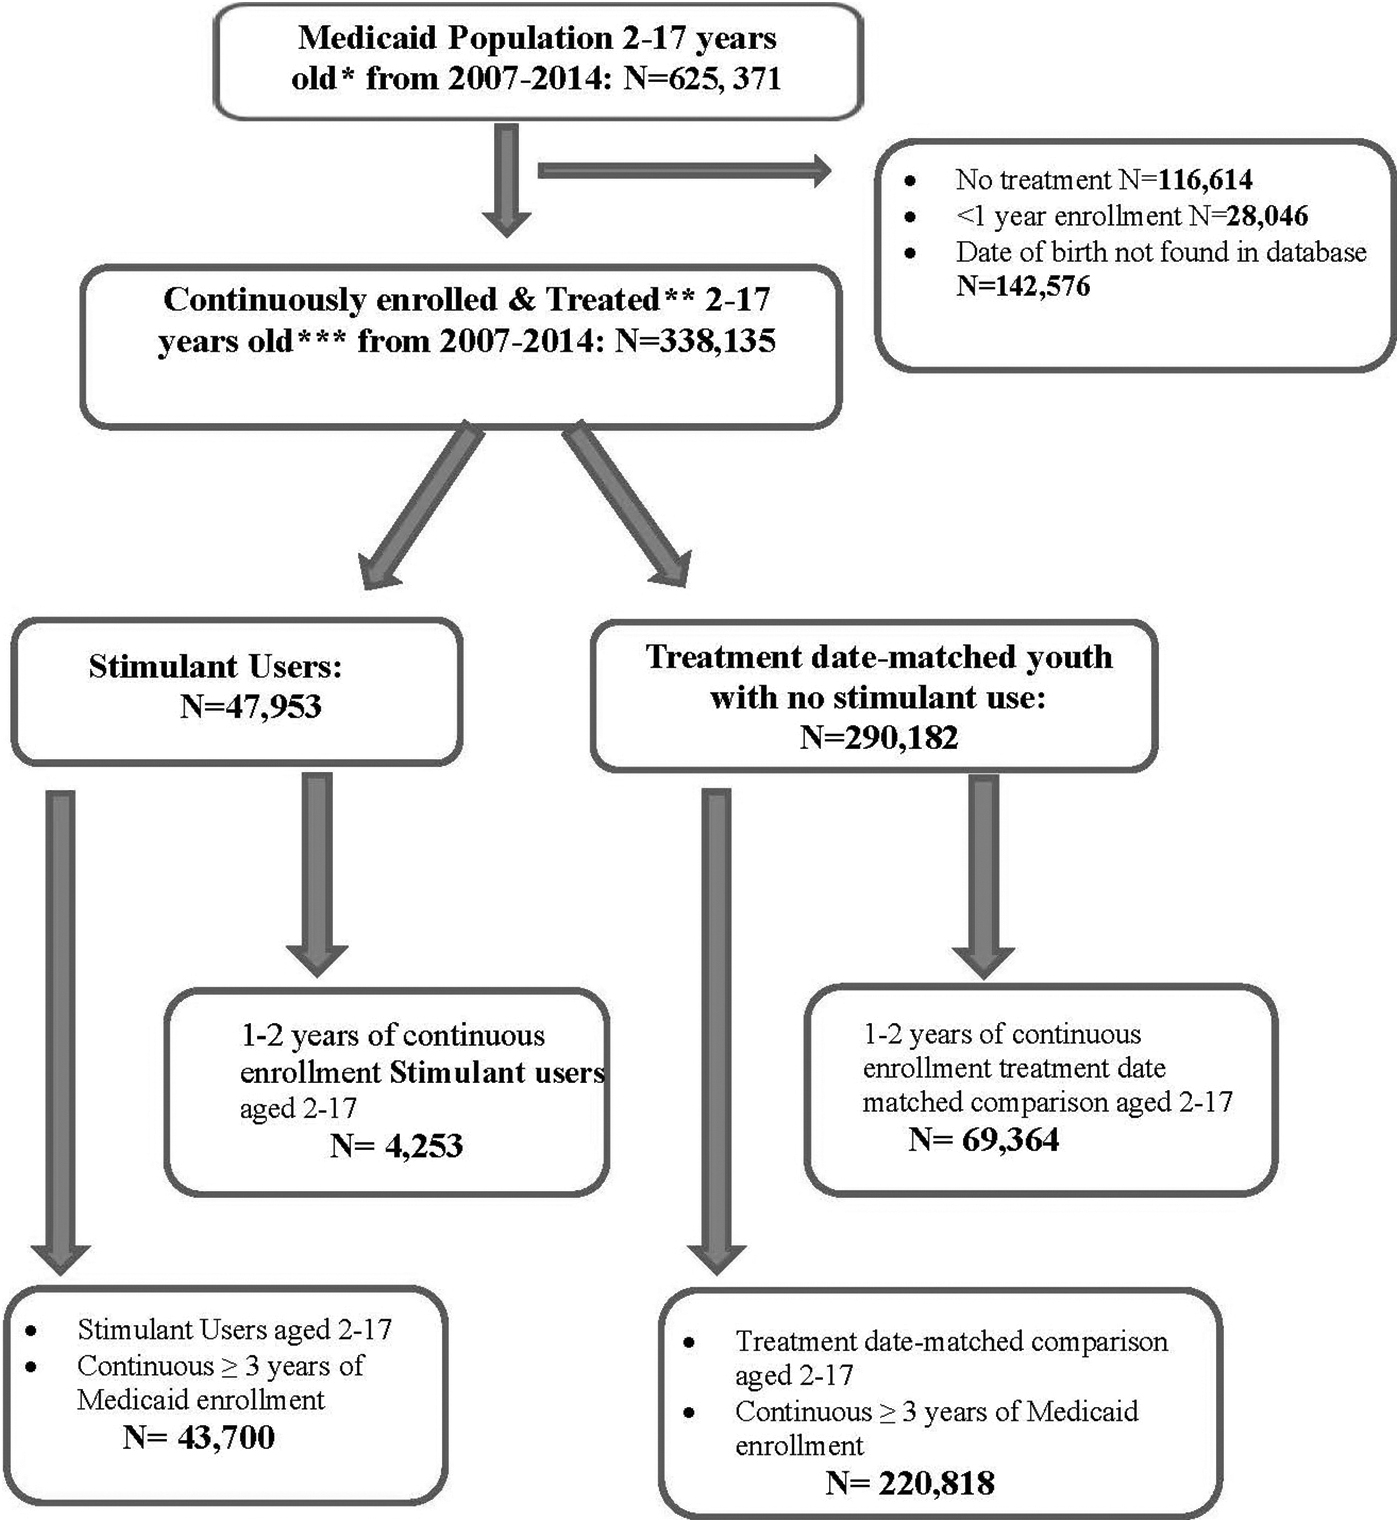
Flowchart for cohort selection. *Age at Medicaid enrollment. **Treatment: any medication, physician visit, or procedure. ***Age at stimulant treatment.
Setting
Medicaid administrative claims data from a mid-Atlantic state included enrollment files, outpatient and physician claims files, and dispensed prescription drug files. Patients' enrollment files were linked to their outpatient and physician claims file and dispensed prescription drug file via an encrypted identification number.
The enrollment files comprise enrollees' sociodemographic characteristics, monthly Medicaid enrollment status, and Medicaid eligibility category. The outpatient and physician claims files included information on clinician-reported psychiatric diagnoses based on the International Classification of Diseases, Ninth Revision, Clinical Modification (ICD-9-CM). The dispensed prescription drug file included information on national drug codes, dispensing date, days of supply, and quantity of supply, which were used to identify the name and duration of dispensed prescription drugs.
This study is covered under No. HP-00056963, Institutional Review Board University of Maryland, Baltimore.
Procedure to identify medication exposures
We focused on five psychotropic drug classes (alpha-agonists, anticonvulsant mood stabilizers, anxiolytics, antidepressants, antipsychotics) and stimulants according to the therapeutic classification system of the American Hospital Formulary Service (AHFS, 2022). To collapse all pharmacy claims records for each individual into one person record, six timeline variables were created for the drug classes. These timelines consisted of 2923 columns—one for each day from January 1, 2007, to December 31, 2014, inclusive plus one column to mark the end of the timeline. As each pharmacy claim was processed, it was assigned a drug class, and the pharmacy fill date and days of supply determined the start and end dates. These dates flagged the columns for the drug class timeline as the drug being taken on those days. Gaps of 15 days or fewer between the same drug class fills were also flagged. Once all pharmacy claims were processed for an individual, a summary timeline was created indicating the number of concomitant drug classes taken on each day. With the use of these timelines, we were able to determine the sequence of concomitant drug usage and the duration of concomitant drug usage.
Outcome measures
Outcome measures for stimulant users included: (1) prevalence of stimulant use in long-term Medicaid enrollees; (2) demographic, administrative, and diagnostic factor comparison of stimulant users and treatment date-matched youth without stimulant use; (3) duration of stimulant exposure; (4) stimulant polypharmacy for stimulant plus one, two, three or more classes among continuous enrollees (3–8 years); (5) clinician-reported diagnostic patterns in relation to polypharmacy.
Prevalence of stimulant use in long-term Medicaid enrollees
In this study, the stimulant prevalence was defined as the number of stimulant users per 100 eligible 3- to 8-year enrollees in calendar years 2007 through 2014. We assessed the prevalence, overall and stratified by age group, Medicaid eligibility category, and length of continuous enrollment.
Sociodemographic, administrative, and diagnostic factors of stimulant users and treatment date-matched youth without stimulant use
The sociodemographic, administrative, and clinical characteristics of stimulant and treatment date-matched youth without stimulant use were compared. These characteristics included age group (2–5, 6–11, 12–17 years), gender, race/ethnicity (White, African American, Hispanic, Native American/Asian/Pacific Islander, and Unknown), Medicaid eligibility category (foster care, youth with 200%–300% of federal poverty income—SCHIP [State Children's Health Insurance Program], youth with disability coverage—SSI [Supplemental Security Income], and youth eligible by family income at or below the federal poverty level—TANF [Temporary Assistance for Needy Families]), and length of continuous Medicaid enrollment (3–4, 5–6, 7–8 years).
For psychiatric diagnoses, we grouped clinician-reported diagnoses into five groups based on ICD-9-CM codes: (1) externalizing disorders (ADHD, disruptive behavioral disorders [conduct disorder and oppositional defiant disorder]); (2) internalizing disorders (depression, anxiety disorders); (3) both externalizing and internalizing disorders; (4) other psychiatric diagnoses, that is, neither internal nor external disorder; and (5) no psychiatric diagnosis. Up to eight diagnosis fields were available in the data, and all psychiatric diagnoses from the stimulant start date were recorded (Supplementary Table S1).
Stimulant duration of use
For each stimulant user in the study, the patient's stimulant duration of use was calculated based on the timelines described previously. The mean, median, and interquartile range of stimulant duration were calculated overall and stratified by age group, eligibility category, and length of continuous enrollment.
Stimulant polypharmacy
The patient's other psychotropic medication class duration of use was calculated as described for stimulants. Stimulant polypharmacy was defined conservatively as at least 60 consecutive overlapping days of stimulant use that included the concomitant use of one or more other psychotropic classes. We defined four mutually exclusive groups upon which we classified each patient's maximum number of drug classes taken concomitantly with stimulants: (1) stimulant monotherapy (no other psychotropic class); (2) two drug class stimulant polypharmacy; (3) three drug class stimulant polypharmacy; (4) four or more drug class stimulant polypharmacy. An additional secondary analysis identified the most common medication class combinations of stimulant polypharmacy.
Diagnosis and polypharmacy
Finally, we assessed the clinician-reported diagnostic groups in relation to stimulant polypharmacy regimens. Also, the details of ADHD comorbidities were assessed.
Statistical analysis
In 3- to 8-year enrollees, we began with descriptive analyses of the prevalence of stimulant use and compared the demographic characteristics and clinician-reported psychiatric diagnosis in the stimulant cohort with the cohort of treatment date-matched youth without stimulant use. Characteristics between the stimulant group and the treatment date-matched group without stimulants were compared using χ2 test for categorical variables. Duration of stimulant use (overall and in stratified groups) was also calculated.
In the multivariate logistic regression, the odds of three or four or more class stimulant polypharmacy was assessed using adjusted odds ratios (AORs) and 95% confidence intervals (CIs). The outcome variable was three or more class stimulant polypharmacy versus stimulant monotherapy and two class stimulant polypharmacy. Statistically significant covariates were adjusted in the final multivariate regression model. The significance level was set at 0.05, and all tests were two-sided. Data processing and analyses were performed using SAS version 9.4 (SAS Institute, Inc.). Results were stratified by age group, eligibility category, and length of enrollment.
Results
Stimulant prevalence
The average cumulative prevalence of stimulant users among 2- to 17-year olds with 3- to 8-year continuous enrollment was 16.5% (Table 1). As a percentage of eligible 6- to 11-year olds, this school age group had the highest stimulant prevalence (20.4%), followed by 2- to 5-year olds (15.1%) and 12- to 17-year olds (13.0%). The prevalence of stimulant use in the foster care (42.3%) and in the SSI (38.4%) was three to four times higher than those by family income alone (SCHIP [11.2%] and TANF [13.8%]). Stimulant users who were enrolled in Medicaid for longer periods had higher prevalence of stimulant use: 20.1% for those with 7–8 years of enrollment—twice as high as for those with 3–4 years of continuous enrollment (Table 1). In a comparison by length of enrollment, the long-term (continuously enrolled in Medicaid for 3–8 years) stimulant user cohort (N = 43,700) represents 91.1% of all 2- to 17-year-old Medicaid stimulant users enrolled between 2007 and 2014 in this mid-Atlantic state (Fig. 1). Among 43,700 stimulant users, amphetamine products alone were used by 29.1%, methylphenidate products alone by 33.7%, and 37.2% had dispensings for both types of stimulants.
Prevalence of Stimulant Use Among Long-Term Medicaid Enrollees in 2007–2014: Total, by Age Group and Eligibility Category
CI, confidence interval; SCHIP, State Children's Health Insurance Program; SSI, Supplemental Security Income; TANF, Temporary Assistance for Needy Families.
Among stimulant users, youth with externalizing psychiatric disorders alone predominated, followed by both comorbid internal and external psychiatric disorders: 85.5% in total compared with 8.4% in the comparison group without stimulants (Table 2). More specifically, ADHD was the leading diagnosis (83.2%), followed by depression (31.4%) and disruptive behavioral disorder (30.3%) (Supplementary Table S2). On average, 2.4 psychiatric diagnoses per stimulant user were found (Supplementary Table S2). Supplementary Table S3 provides a more detailed profile of comorbidity patterns. Among 36,304 stimulant users who were diagnosed with ADHD, 11,816 (32.5%) had ADHD alone and 24,488 (73.5%) had ADHD and other psychiatric comorbidities. Among the 24,488 who had ADHD and other psychiatric diagnoses, 12,160 (49.7%) had disruptive behavioral disorder, 12,075 (49.3%) had depression, and 8368 (34.2%) had anxiety.
Demographic, Administrative Characteristics, and Prevalence of Stimulant-Treated and Treatment Date-Matched Comparison Youth Without Stimulant Use Among Those with 3–8 Years of Continuous Medicaid Enrollment
Age is the age of the first stimulant use (column 2) or age of the first drug/medical service use (column 4).
Externalizing disorders include ADHD, disruptive behavioral disorders. Internalizing disorders include depression, anxiety disorders. Other psychiatric diagnoses include adjustment disorder, autism spectrum disorder, learning disorder, schizophrenia, intellectual disability, tic disorder, bipolar disorder, and other mental health diagnoses.
ADHD, attention-deficit/hyperactivity disorder; SCHIP, State Children's Health Insurance Program; SSI, Supplemental Security Income; TANF, Temporary Assistance for Needy Families.
Stimulant users compared with treatment date-matched group without stimulant use
In the comparison of stimulant users (N = 43,700) with those without stimulant use (N = 220,818), stimulant users were more frequently male, White, aged 6–11 years, more often in foster care or with disability insurance (SSI), and among youth with the longest enrollment time (Table 2).
Stimulant duration
Figure 2 provides the duration of stimulant use overall and stratified by key characteristics. Overall, the average duration of use was 718 days compared with a median of 487 days and indicates the presence of long duration “outliers.” The 6- to 11-year-old age group had the highest average duration of use with more than 2 years of stimulant exposure, followed by younger and older aged youth. Stimulant users in foster care had the longest duration of use with a mean of 908 days and a median of 740 days. Stimulant users with 7–8 years of continuous Medicaid enrollment had twice the stimulant exposure as those with 3–4 years of continuous Medicaid enrollment. Collectively, the data reflect relatively long stimulant exposures (up to 2.7 years) in these 3- to 8-year continuous enrollees.
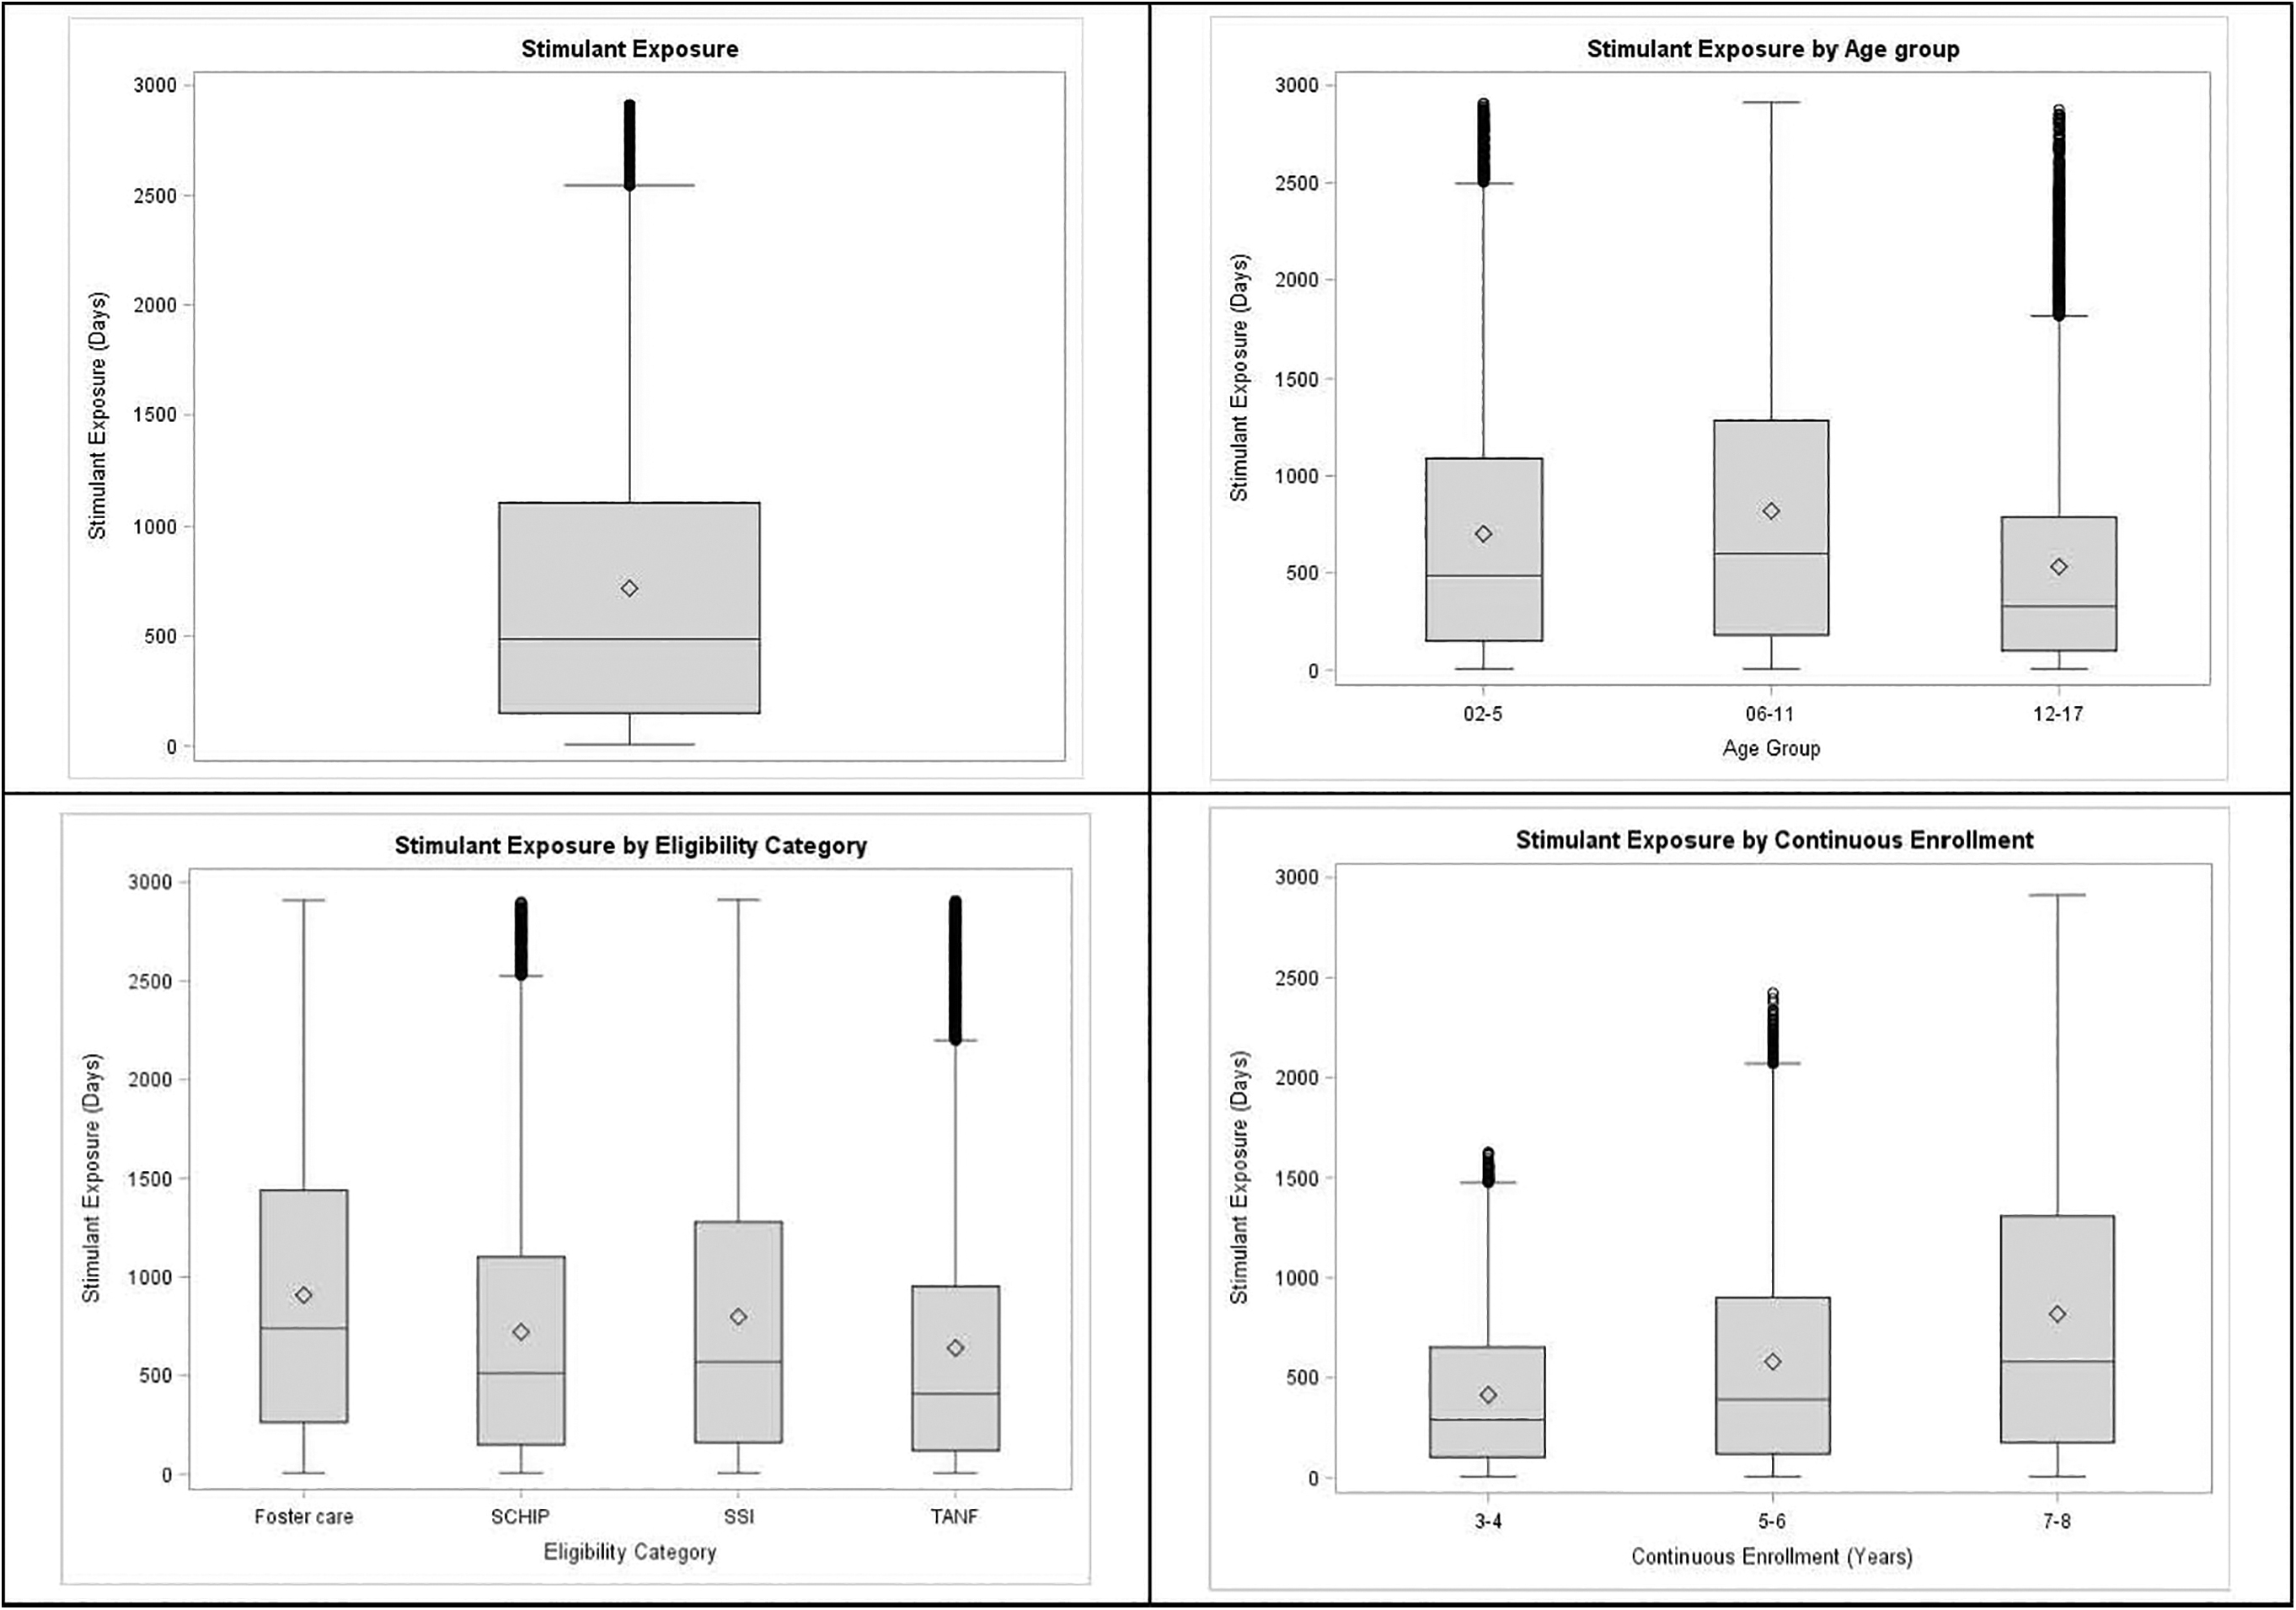
Days of stimulant exposure (duration)a total and by age group, eligibility group, and length of enrollment. aThe minimum stimulant exposure days is 7 days. Thirty-six stimulant users who had <7 days of stimulant exposure were excluded.
Stimulant polypharmacy
Among stimulant users, ∼30% had dispensings of two or more concomitant classes (stimulant plus one or more other psychotropic classes). This was distributed as follows: 18.2% had two class polypharmacy, 7.3% had three class polypharmacy, and 4.3% had four or more class polypharmacy (Table 3).
Polypharmacy (60 or More Days Overlap) in Stimulant Users by Age Group in 2007–2014
Four concomitant drug classes were observed for 1559 youths (3.6% of stimulant users). Five concomitant drug classes were observed for 294 youths (0.7% of stimulant users).
The prevalence of two class polypharmacy was highest in 2- to 5-year olds (20.0%) with slightly lower prevalence in 6- to 11-year olds (18.6%) and dropping further in 12- to 17-year olds (15.4%). By contrast, the prevalence of three and four or more drug class polypharmacy increased linearly with age: 7.9% in 2- to 5-year-old; 12.0% in 6- to 11-year-old, and 14.8% in 12- to 17-year-old eligible youths (Table 3).
Externalizing disorders alone were dominant (56.9%) in the stimulant-only subgroup and dramatically decreased as polypharmacy increased (43.4% in the two drug class, 22.0% in the three drug class, and 11.7% in the four or more drug class). In youth with both clinician-reported externalizing and internalizing disorders, polypharmacy significantly increased as a proportion of each polypharmacy class (26.4% in stimulant monotherapy, 46.6% in the two drug class, 69.2% in the three drug class, and 82.3% in the four or more drug class) (Table 4).
Polypharmacy (60 or More Days Overlap) in Stimulant Users by Clinician-Reported Diagnostic Subgroup in 2007–2014
Externalizing disorders include ADHD, disruptive behavioral disorders. Internalizing disorders include depression, anxiety disorders. Other psychiatric diagnoses include adjustment disorder, autism spectrum disorder, learning disorder, schizophrenia, intellectual disability, tic disorder, bipolar disorder, and other mental health diagnoses.
ADHD, attention-deficit/hyperactivity disorder.
Results of the logistic regression analysis are presented in terms of AORs in Table 5 stratified by age group, gender, race/ethnicity, eligibility category, and length of enrollment. The odds of experiencing three or more class polypharmacy versus experiencing stimulant-only or two class polypharmacy increased with age group after adjusting for other covariates. Compared with 2- to 5-year olds, 12- to 17-year-old and 6- to 11-year-old enrollees, respectively, had greater odds of receiving three or more class polypharmacy as follows: 12–17 years: AOR = 1.82, 95% CI = 1.66–2.00, p < 0.001; 6–11 years: AOR = 1.55, 95% CI = 1.43–1.67.
Logistic Regression Analysis for Three or More Class Stimulant Concomitant Use (Polypharmacy) Versus Stimulant-Only and Two Class Stimulant Polypharmacy
Adjusted for age, gender, race/ethnicity, eligibility category, and continuous enrollment.
CI, confidence interval; n.s., nonsignificant; SCHIP, State Children's Health Insurance Program; SSI, Supplemental Security Income; TANF, Temporary Assistance for Needy Families.
Males were more likely to receive three or more class polypharmacy than females (AOR = 1.13; 95% CI = 1.01–1.21; p < 0.001); White race (AOR = 1.79; 95% CI = 1.59–2.02; p < 0.001) increased the odds of receiving three or more class polypharmacy compared with other races. Stimulant users in foster care and SSI had 4.49-fold (95% CI = 4.11–4.91; p < 0.001) and 3.88-fold (95% CI = 3.60–4.19; p < 0.001), respectively, greater odds of receiving three or more class polypharmacy than TANF, that is, the reference group. SCHIP was not different from TANF in likelihood to receive three or more interclass polypharmacy. Those continuously enrolled in Medicaid for 7–8 years were more likely to receive three or more class psychotropic medications concomitantly than those who were enrolled for 3–4 years (AOR = 1.68; 95% CI = 1.51–1.86; p < 0.001) (Table 5).
Common concomitant stimulant regimens
The combination of psychotropic classes in three and four or more stimulant polypharmacy regimens was investigated: in summary, 85% of the three drug stimulant polypharmacy cohort and 88% of the four or more class stimulant polypharmacy cohort had a regimen that included a stimulant with at least one antipsychotic dispensing for 60 or more days of concomitant use (Table 6).
Frequency of Three and Four Class Concomitant Regimens in Stimulant Polypharmacy by Age Group Among Stimulant Users
Stimulant+ATP+AX+ATC-MS; stimulant+ATP+AX+AA; stimulant+ATD+ATC-MS+AA; stimulant+ATD+ATC-MS+AX; stimulant+ATD+AX+AA; stimulant+AX+AA+ATC-MS; stimulant+ATP+ATD+AA+ATC-MS; stimulant+ATP+ATD+AX+ATC-MS; stimulant+ATP+ATD+AX+AA; stimulant+ATP+AX+ATC-MS+AA; stimulant+ATD+AX+ATC-MS+AA.
AA, alpha-agonist; ATC-MS, anticonvulsant mood stabilizer; ATD, antidepressant; ATP, antipsychotic; AX, anxiolytic.
In the three class polypharmacy, the most prevalent combination was “stimulant/antipsychotic/antidepressant.” In the four class polypharmacy, the most prevalent combination was “stimulant/antipsychotic/antidepressant/alpha-agonist” (Table 6).
Discussion
Our study design is novel and permits population-based knowledge on the length of exposure to stimulants among youth with 3–8 years of continuous enrollment. There are several main findings from this population-based analysis of continuously enrolled youth in a mid-Atlantic Medicaid program. First, across youth with 3–8 years of continuous enrollment, 16.5% of youth were unique stimulant-treated youth, twice as great a prevalence as is reported by annual national estimates of stimulant use. For example, Visser et al. (2014) showed a stimulant prevalence of 8.1% for youth insured by Medicaid or CHIP. This is a good fit with our insured cohort. But the full importance of the doubling of stimulant users in our cohort compared with a 1-year cohort concerns the empirical support we now have for extended treatment patterns both for the 70% who received stimulant monotherapy and the 30% treated with medication classes concomitantly with stimulants. By contrast, international data for 2010 show a wide range of annual stimulant use from 0.27% to 6.7% (Raman et al., 2018). The consistency or contrast with published studies on U.S. pediatric stimulant polypharmacy will be explored below.
Second, the substantial prevalence of stimulant medication users in our 3- to 8-year continuously enrolled Medicaid cohort, particularly among foster care enrollees, has been the topic of federal agency warnings for the past 20 years (GAO, 2017; GAO, 2012). Thus, the stimulant disparity by income level for publicly (5.8%) versus privately insured youth (2.9%) (Oehrlein et al., 2016) presents thought-provoking questions regarding the social determinants of health. For example, ethnicity and geographic isolation of family residence are associated with barriers to ADHD treatment services as illustrated with claims data linked with geographic zip code and county data (Pennap et al., 2017). Overall, the clinical implications for behavioral treatment with medications are important, particularly for stimulant polypharmacy where in our study 5047 stimulant users had 3–5 stimulant interclass concomitant regimens, although such combinations have not been identified in published effectiveness studies of ADHD combinations (Baker et al., 2021).
When adjusted for covariates, logistic regression analysis revealed that older age, foster care eligibility category, and 7–8 years of continuous enrollment significantly increased the likelihood of three or more interclass polypharmacy. Notably, although the African American racial subgroup had the highest prevalence of stimulant use (Table 2), White youth had the greatest adjusted odds of three or more interclass polypharmacy, suggesting that long-term persistence favors White youth.
Concomitant use of antipsychotics, antidepressants, and stimulants
The frequent combination of stimulant with antipsychotic and antidepressants is corroborated by numerous annual studies in both national and Medicaid cohorts. National data showed the prevalence of antipsychotics for the treatment of behavioral disorders to be prominent and nearly twice as likely in publicly insured youth (Burcu et al., 2016). ADHD medication with antipsychotic or selective serotonin reuptake inhibitors (SSRIs) was also reported in the national annual trends' data set of Girand et al. (2020). Similarly, medical expenditure panel survey data across 16 years to 2015 corroborate these patterns (Zhang et al., 2021). Olfson et al. (2016) analyzed data from 60% of pharmacies in the nation, illustrating the prominence of stimulant and antipsychotic regimens among these largely commercially insured youth. Moreover, combinations of stimulant and antipsychotic medication were prevalent even in 3- to 6-year-old foster care enrollees (dosReis et al., 2014).
Girand et al. (2020) measured more than one class concomitantly and found ADHD polypharmacy in 31.5% of ambulatory prescription drug outpatient visits among 2- to 24-year olds in 2015. Similarly, Lohr et al. (2018) examined recent state Medicaid data among children younger than 18 years. Interclass psychotropic polypharmacy (regardless of stimulant use) was observed in 39.5% of those with ≥90 days of continuous enrollment and a behavioral diagnosis, although the maximum length of enrollment was not given. In summary, ∼29%–39% of Medicaid-insured youth treated with stimulants are likely to be treated with complex medications increasing the potential for serious adverse events while being used in the absence of robust evidence of effectiveness (Baker et al., 2021). Annual period prevalence of polypharmacy-treated youth in privately insured youth was not far behind (25%–28%) (Zhou et al., 2020). By contrast, in a European Union study of ADHD medication, polypharmacy was found to be 14.1%, that is, half of the proportion in our Medicaid youth cohort (Sikirica et al., 2013).
Defining long-term use
While the term “long-term use” lacks agreement in the literature, some estimates are based on relatively short time periods. For example, Olfson et al. (2016) defined long-term use as 120–365 days (vs. ≤30 days [short term]) of continuous stimulant use in a 1-year window. In our cohort of 3- to 8-year continuous enrollees, substantially longer exposures were observed. For example, according to the eligibility group, 50% of stimulant users had more than 1 year duration: foster care (>2 years), disabled (SSI; >1.6 years), SCHIP (>1.4 years), and TANF (>1.1 years). An exceptional study in terms of very long stimulant exposures is the Rochester, Minnesota, birth cohort of Barbaresi et al. (2006). Subjects with research-identified ADHD (N = 379) were followed retrospectively from birth to a mean of 17.2 years yielding an average of 33.3 months of stimulant use.
However, the Rochester community represents a small region of largely White, privately insured youth. Despite the richness of the long-term follow-up, its generalizability is low. There are several pertinent stimulant studies that were designed as follow-up studies, for example, 1 year following an initial stimulant use (Park-Wyllie et al., 2016) or from first diagnosis of ADHD and stimulant use to estimate risk of three or more classes anytime in follow-up years 1–5 (Winterstein et al., 2017). In Winterstein et al.'s Medicaid study, the finding that polypharmacy was greatest for the youngest aged children contrasts with our finding that polypharmacy increased with age, as in other studies with shorter enrollments (Lohr et al., 2018; Soria Saucedo et al., 2018).
Policy implications
Greater Medicaid continuity of enrollment in our study likely explains the greater number of youth with access to diagnosis and treatment in our study population compared with annual estimates. Numerous policy efforts, for example, the 2009 CHIPRA legislation (Hill et al., 2015) encouraged continuity of enrollment in Medicaid and CHIP enrollees and is reflected in the 67% of youth with 7–8 years of continuous enrollment in our data set (Table 2). Also, wraparound services are likely to have contributed to the state's efforts to improve care coordination (AHRQ, 2012). Furthermore, policy analysis of Medicaid data (Simon et al., 2013) has shown that annual data sets underrepresent the extent of enrollment (32.8% had 1-year enrollment vs. 41% had 5-year enrollment), affirming that multiyear enrollment extends the opportunity for long-term stimulant use. Collectively, U.S. studies underscore the continuing efforts by federal agencies' Medicaid monitoring programs to rein in “overprescription,” particularly in the poor and foster care populations (GAO, 2017; GAO, 2012).
Research for effectiveness of concomitant stimulant polypharmacy
Calls for research to evaluate the appropriateness, effectiveness, and safety of psychotherapeutic polypharmacy in community-treated ADHD-diagnosed youth come from national physician office survey studies with findings similar to ours (Girand et al., 2020). Similarly, large simple trials (Stroup, 2011) and “real world data” research studies are considered to be both feasible and cost-efficient (Horton et al., 2021) and may be enhanced by the development of electronic health record technology.
Strengths and limitations
Our choice of a 60-day window strengthens the polypharmacy definition while minimizing the likelihood of counting intentional switching or short-time medication trials. Limitations include relying on claims data measured by pharmacy dispensings as consumed, although the refill patterns support, but do not guarantee, consumption of the medications. Also, diagnoses are clinician-reported and lack the validity of research assessment. Concerns about the age of the data source may be alleviated by the consistency of findings with concurrent or later data set findings, for example, in Medicaid (Lohr et al., 2018), commercially insured (Olfson et al., 2016), and from national data (Girand et al., 2020; Zhang et al., 2021). Finally, the data are derived from a single-state Medicaid program, although many findings are consistent with published multistate studies of annual enrollees.
Conclusions
Stimulant prevalence in Medicaid-insured youth with continuous enrollment of 3–8 years was twice as common as in annual Medicaid datasets. Future research should investigate three to five interclass stimulant polypharmacy effectiveness in reliably diagnosed community populations.
Clinical Significance
To summarize from a clinical perspective: The study findings emphasize that continuous Medicaid enrollment of 3–8 years is associated with a wider pool of stimulant-treated youth than is found in annual data. In addition, the duration of stimulant exposure is substantial (487 median days). Data from special subgroups, for example, foster care and disabled youth, are higher. Stimulant polypharmacy for three or more interclass stimulant polypharmacy increased with age group, while stimulant monotherapy decreased with age group. Particularly frequent in three or more interclass stimulant polypharmacy is the combination of stimulants with antipsychotics.
Footnotes
Disclosures
All authors have no financial interests to disclose or conflicts of interest.
Supplementary Material
Supplementary Table S1
Supplementary Table S2
Supplementary Table S3
References
Supplementary Material
Please find the following supplemental material available below.
For Open Access articles published under a Creative Commons License, all supplemental material carries the same license as the article it is associated with.
For non-Open Access articles published, all supplemental material carries a non-exclusive license, and permission requests for re-use of supplemental material or any part of supplemental material shall be sent directly to the copyright owner as specified in the copyright notice associated with the article.