




Abstract
Background:
As many as 60% of pediatric patients taking second-generation antipsychotics (SGA) experience weight gain (antipsychotic-induced weight gain). However, the subgroup that experienced substantial weight increase was poorly understood. This study aimed to identify the development and predictors of clinically significant weight gain (CSWG) among pediatric SGA recipients.
Methods:
A retrospective analysis of the 2016 to 2021 IQVIA Ambulatory EMR-US database was conducted. The study cohort comprised SGA-naive patients ages 5 to 19, continuously prescribed SGA for ≥90 days. CSWG was defined as a weight gain in BMI z-score >0.5. The development of CSWG was described using the group-based trajectory model approach, and multinomial logistic regression analysis was conducted to examine the risk factors associated with the CSWG trajectories.
Results:
Of the 16,262 SGA recipients who met the inclusion criteria, 4 distinctive CSWG trajectories were identified: (1) Rapid (14.6%), (2) Gradual (12.6%), (3) Transit (7%), and (4) no CSWG (65.8%). Factors associated with a higher likelihood of having rapid or gradual CSWG versus nonsignificant weight gain were being younger (OR [95% CI] = 12–17 vs. 5–11, Rapid, 0.727 [0.655–0.806]; Gradual, 0.776 [0.668–0.903]), male (Rapid, 1.131 [1.021–1.253]), non-Hispanic White (Black vs. White: Rapid, 0.833 [0.709–0.98]), with lower baseline BMI z-score (Rapid, 0.376 [0.361–0.392]; Gradual, 0.449 [0.424–0.476]), and receiving olanzapine as the initial SGA (Rapid, 1.38 [1.093–1.74]). The Area under the Receiver operating characteristic (ROC) Curve for the comparison of rapid and gradual CSWG with no CSWG trajectory were 0.83 and 0.80, respectively.
Conclusions:
SGA recipients experienced four distinctive CSWG trajectories (Rapid, Gradual, Transient, and No CSWG). The risk of CSWG could be predicted using patient characteristics at the SGA initiation. This insight highlights the importance of personalized monitoring and timely intervention strategies for at-risk individuals who experienced persistent CSWG in real practice.
Introduction
Compared with adults, children and adolescents are more vulnerable to antipsychotic-induced weight gain (AIWG) (Ray et al., 2019). Our previous study reported that as many as 60% of pediatric patients with bipolar disorders taking second-generation antipsychotics (SGA) can experience AIWG (Patel et al., 2017). The degree of weight gain can be quite various, ranging from a few kilograms to as much as 50 kg in the first year of SGA treatment (Patel et al., 2017). Previous research generally treated AIWG as a binary outcome (Ghate et al., 2013; Handen and Hardan, 2006), with Corell and Carlson (2006) identifying a change in BMI z-score >0.5 to indicate notable weight gain (Corell and Carlson, 2006), based on the finding that this degree of weight gain is associated with a 55% higher risk of developing metabolic syndrome (Weiss et al., 2004). This definition has been adopted in studies such as that of Calage et al. (Calarge et al., 2009), wherein it is referred to as clinically significant weight gain (CSWG).
Looking beyond the binary classification of AIWG, there may be different trajectories of weight gain, such as those gaining a modest degree of weight gradually, relative to those gaining a lot of weight rapidly. Children and adolescents in such differing trajectories may be different, clinically, and so might require different responses to address CSWG. In the realm of developmental nutrition and metabolism, there is increasing utilization of the group-based trajectory model (GBTM) approach, which seeks to identify distinct subgroups “that follow distinctive developmental trajectories (Nutr and Nagin, 2014).” Beyond the basic approach of noting whether a patient has or has not experienced CSWG, and what might predict weight gain, our study aimed to understand, using a GBTM approach, whether there are distinct trajectories of CSWG, among children and adolescents prescribed SGA, and, if so, to identify clinical, demographic, and provider characteristics that distinguish between trajectories.
Methods
A large EMR database was used to retrospectively identify a cohort of children and adolescents prescribed SGAs, and use BMI z-score measures across 2 years to model weight gain trajectories, and decide whether data supported 2, 3, 4, or 5 trajectory groups. Logistic identified trajectory groups, multinomial logistic regression was used to determine which clinical, demographic, and provider characteristics distinguished between groups.
Study data
The IQVIA Ambulatory EMR-US database from 2016 to 2021 was used in this study. The IQVIA Ambulatory EMR-US dataset is sourced from the deidentified electronic medical record systems of more than 800 ambulatory practices, covering more than 100,000 physicians. It includes over 82 million patients, with average patient health care delivery history of 3 years, and some patient health care histories dating back to 2006 (IQVIA, 2020). Data elements include a patient's demographics, clinical problems and diagnoses, vital signs, laboratory results, procedures, and prescriptions, and also include some provider data such as provider type.
Patient demographic factors included age category at SGA initiation, sex, race/ethnicity, and geographic region (Northeast, Midwest, South, and West). Clinical factors included BMI z-score measurements; psychiatric diagnoses (attention-deficit/hyperactivity disorder [ADHD], mood disorder, conduct disorder, substance use disorder, schizophrenia and other psychotic disorders, tic disorder, and autism spectrum disorder); a set of metabolism-related medical comorbidities, including hyperglycemia, diabetes, and polycystic ovarian syndrome; and comedications (antidepressants, ADHD medications, anxiolytics, topiramate, and weight loss medications). We also noted the particular SGA, since AIWG risks vary across SGAs, based on their receptor signaling. SGAs primarily function as serotonin (5-HT2a), dopamine (D2), histamine (H1), adrenergic (alpha1/2), and cholinergic (M3) antagonists for treating psychotic disorders, thereby reducing neurotransmission in the four major dopamine pathways (Libowitz and Nurmi, 2021). Activation of these receptors can increase appetite, and decrease satiety, insulin release, and lipolysis levels, leading to the development of AIWG.
Based on their mechanisms of action, the index SGA agents were categorized into high-, moderate-, and low-risk groups according to their associated metabolic adverse effects. A summary by De Hert et al. indicated that aripiprazole, asenapine, ziprasidone, lurasidone, and cariprazine were classified as low-risk SGAs regarding weight gain. Risperidone, quetiapine, paliperidone, and iloperidone were considered moderate-risk SGAs, while clozapine and olanzapine were categorized as high-risk SGA agents (De Hert et al., 2011b). We also noted the specialty of the prescriber of antipsychotic medication: primary care physicians (PCP), mental health specialists, and other specialists.
Study cohort
We defined a study cohort of children and adolescents ages 5 through 19 who initially received continuous SGA treatment, for at least 90 days and up to 24 months, between 2016 and 2021. To qualify as an incident SGA recipient, individuals were required to have had no SGA prescription for 12 months before the SGA initiation. Additionally, eligible patients had to possess one BMI z-score during the 30-day period preceding SGA initiation and at least one BMI z-score throughout the 24-month SGA treatment period.
Study design
In our investigation, we conducted a retrospective analysis to examine the development of CSWG associated with SGA within a cohort of children and adolescents receiving actual clinical care, as documented in the IQVIA Ambulatory EMR-US database. The study design, illustrated in Figure 1, encompasses a longitudinal data timeline, incorporating a 12-month baseline period and a subsequent follow-up period of 3 to 24 months. The index date was defined as the initiation date of SGA prescription, occurring between 2016 and 2021. The censor date, indicative of the end of the follow-up, was determined as the earliest occurrence among the conclusion of the 24-month follow-up period, or SGA discontinuation, or the date of the last measured BMI z-score.
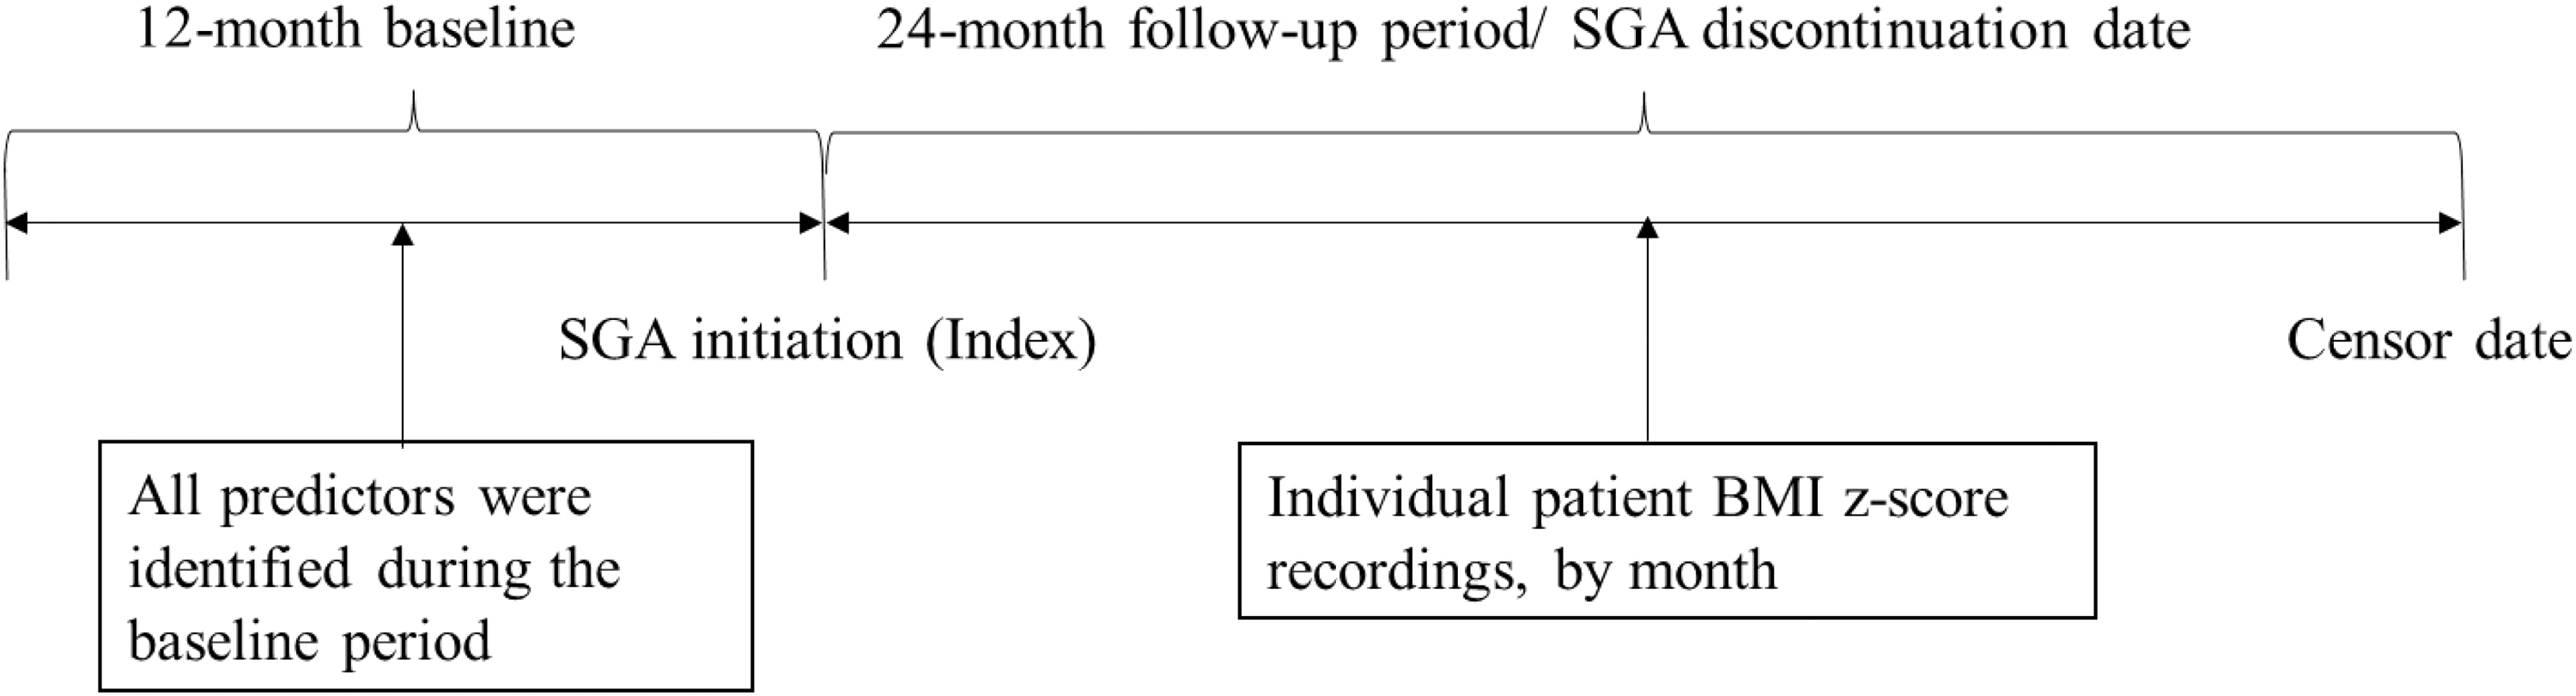
Study design.
We used GBTM to assess models of 2, 3, 4, and 5 trajectory groups, and reviewed a set of fit indices to judge the optimal number of trajectory groups. We then described these trajectories, and examined the degree that any clinical, demographic, and provider characteristics were different between the trajectory groups. Clinical, demographic, and provider characteristics for all patients were gathered from the 12-month baseline period preceding the initiation of SGA treatment. BMI z-score recordings were gathered for the initiation of SGA treatment and the period of the 24-month observation period. The baseline measure was defined as the BMI z-score recording taken 30 days before the SGA treatment initiation. If multiple measurements were available within this timeframe, the BMI z-score recording closest to the SGA initiation (index date) was selected. Follow-up BMI z-score recordings were identified and noted by month throughout the follow-up period. BMI z-score was calculated using weight and height, standardized by age- and sex-reference values based on Centers for Disease Control and Prevention (CDC) growth charts criteria (0 to <20 years) (Centers for Disease Control and Prevention, 2023; Kuczmarski et al., 2002).
The BMI z-scores were further categorized as obesity, overweight, and normal weight. Obesity was defined as having a BMI z-score larger than 1.64, which corresponds to greater than the 95th percentile, as per the cutoff defined by the CDC. Overweight was defined as having a BMI z-score between 1.03 and 1.64, corresponding to a BMI ≥85th percentile but <95th percentile. Normal weight was defined as a BMI z-score under 1.03, corresponding to below the 85th percentile. With BMI z-scores calculated, those meeting the criteria for CSWG, BMI z-score change >0.5, were determined.
SGA-associated CSWG trajectories
A series of GBTM were calculated to attempt to model distinct trends of CSWG during the SGA treatment. GBTM is a statistical approach that forms distinct trajectory groups with longitudinal data and provides a range of fit indices for comparisons between models. GBTM can effectively handle growth trends across time, data heterogeneity, and irregularly timed measurements over the surveillance period. It assumes that repeated observations within the same individual are independent, and account for any missing measurements during the study period (Franklin et al., 2013).
We decided that a reasonable number of trajectory groups to calculate and compare, would be 2, 3, 4, and 5, and decided that any model must have a minimum of 5% of the study cohort in each group. Selection of the optimal GBTM model was based on review of model results across four criteria. We calculated Akaike's Information Criteria for each model. We calculated two Bayesian Information Criteria (BIC) statistics (smaller BIC indicating a better fit) for each model: one using number of patients, and one using number of observations, for the number of data points. We calculated the logged Bayes factor (logged Bayes factor >2 indicated a better model fit).
The selected model's performance was assessed using the following prescribed criteria: (1) ensuring that the average group posterior probability (AvePP) was ≥0.7 for all groups; (2) confirming that the odds of correct classification (OCC) exceeded 5 for every group; and (3) verifying that the disparity between the estimated group probability (π) and the actual proportion of individuals assigned to the group (p) for all groups (Nutr and Nagin, 2014).
Sensitivity analysis
Given the potential limitations of sparse BMI z-score measurements in reflecting the actual weight change status of children and adolescents, a sensitivity analysis of trajectory modeling was conducted. This analysis focused on a subcohort of patients with at least three BMI z-score measures, including one baseline BMI z-score and at least two additional measurements during the surveillance period. By including multiple BMI z-score measures, the assessment of weight change patterns may become more accurate and stable.
Statistical analyses
Once an optimal model was determined, based on these criteria, descriptive statistics were calculated to summarize clinical, demographic, and provider characteristics for each of the trajectory groups in that model. Group differences were assessed using the chi-square test for categorical variables and ANOVA for continuous variables. Multinomial logistic regression models were used to assess whether there were trajectory-group differences in any of the clinical, demographic, and provider characteristics, using a 0.05 significance level. We required each model to have at least 5% of the sample in each trajectory group; we also calculated the percentage of patients in each trajectory group for each model. With these classification data, we calculated AUC (Area under the Receiver operating characteristic [ROC] Curve) to describe the overall classification performance of the optimal model and compared classification between all pairs of trajectory groups in this optimal model.
All analyses were performed using SAS software version 9.4; the “Proc Traj” package was used for group-based trajectory modeling (Jones and Nagin, 2007; Jones et al., 2001).
Ethics statement
The study was approved by the Institutional Review Board of the University of Houston.
Results
Baseline characteristics
There were 16,262 long-term SGA recipients meeting the inclusion criteria identified from 2016 to 2021 IQVIA Ambulatory EMR-US database. As shown in Table 1, the cohort comprised 56% ages12 to 17 (n = 9065), 60% male (n = 9763), and 67% non-Hispanic White (n = 10,836). Regarding prescribing physicians, 44% of patients received SGA prescriptions from PCP (n = 7187), and 13% from mental health specialists. Within 30 days before the SGA initiation, 42% of participants were classified as obese (n = 6901), 14% as overweight (n = 2233), and 44% as normal or underweight (n = 7128).
Patient Demographic, Clinical, and Provider Characteristics by Weight Gain Trajectory Group
Hyperglycemia/diabetes includes type 1 or type 2 diabetes and abnormal blood glucose.
Schizophrenia-related diagnosis includes schizophrenia, schizoaffective disorder, and psychosis.
Weight loss medication includes Bupropion–naltrexone, Liraglutide, Orlistat, and Phentermine–topiramate.
Indication of statistical significance at 0.05 level.
ADHD, attention-deficit/hyperactivity disorder; PCP, primary care physicians; SGA, second-generation antipsychotic.
CSWG trajectories
With the data for the 2, 3, 4, and 5-group trajectory models, the 4-group trajectory model was chosen as the optimal model (Table 2). Specifically, the logged Bayes factor for the 4-group model was 2.85, indicating that it provides a better fit to the data than the 3-group model. Additionally, when compared with the 5-group model, the 4-group model had a lower BIC, suggesting a more favorable model fit.
Fit Statistics for Clinically Significant Weight Gain Trajectory Group Models
AIC, Akaike's Information Criteria; BIC, Bayesian Information Criteria.
The evaluation of model fit indices was presented in Table 3, indicating that AvePP is >0.7, OCC exceeds 5, and the disparity between π and p is ≤0.08 for each of the four weight change trajectories.
Validation of Selected Four-Group Trajectory Model
π, The proportion of the sample belonging to group membership.
p, Actual proportion of subjects assigned to each trajectory group using the maximum probability rule.
AvePP, average posterior probability; OCC, odds of correct classification.
According to the 4-group model, 34.2% of all children on SGA experienced CSWG and 65.8% did not. Those having CSWG can be further categorized into different patterns: (1) Rapid significant weight gain: 14.6% had significant weight gain rapidly within the first few months of SGA treatment. (2) Gradual significant weight gain: 12.6% of patients reached the 0.5 BMI z-score increase cutoff at various time points during SGA treatment. (3) Transient significant weight gain: 7% of patients experienced CSWG in the first few months of SGA treatment, then gradually lost weight during the rest of the SGA treatment duration. The trajectories developed by the CSWG are illustrated in Figure 2.
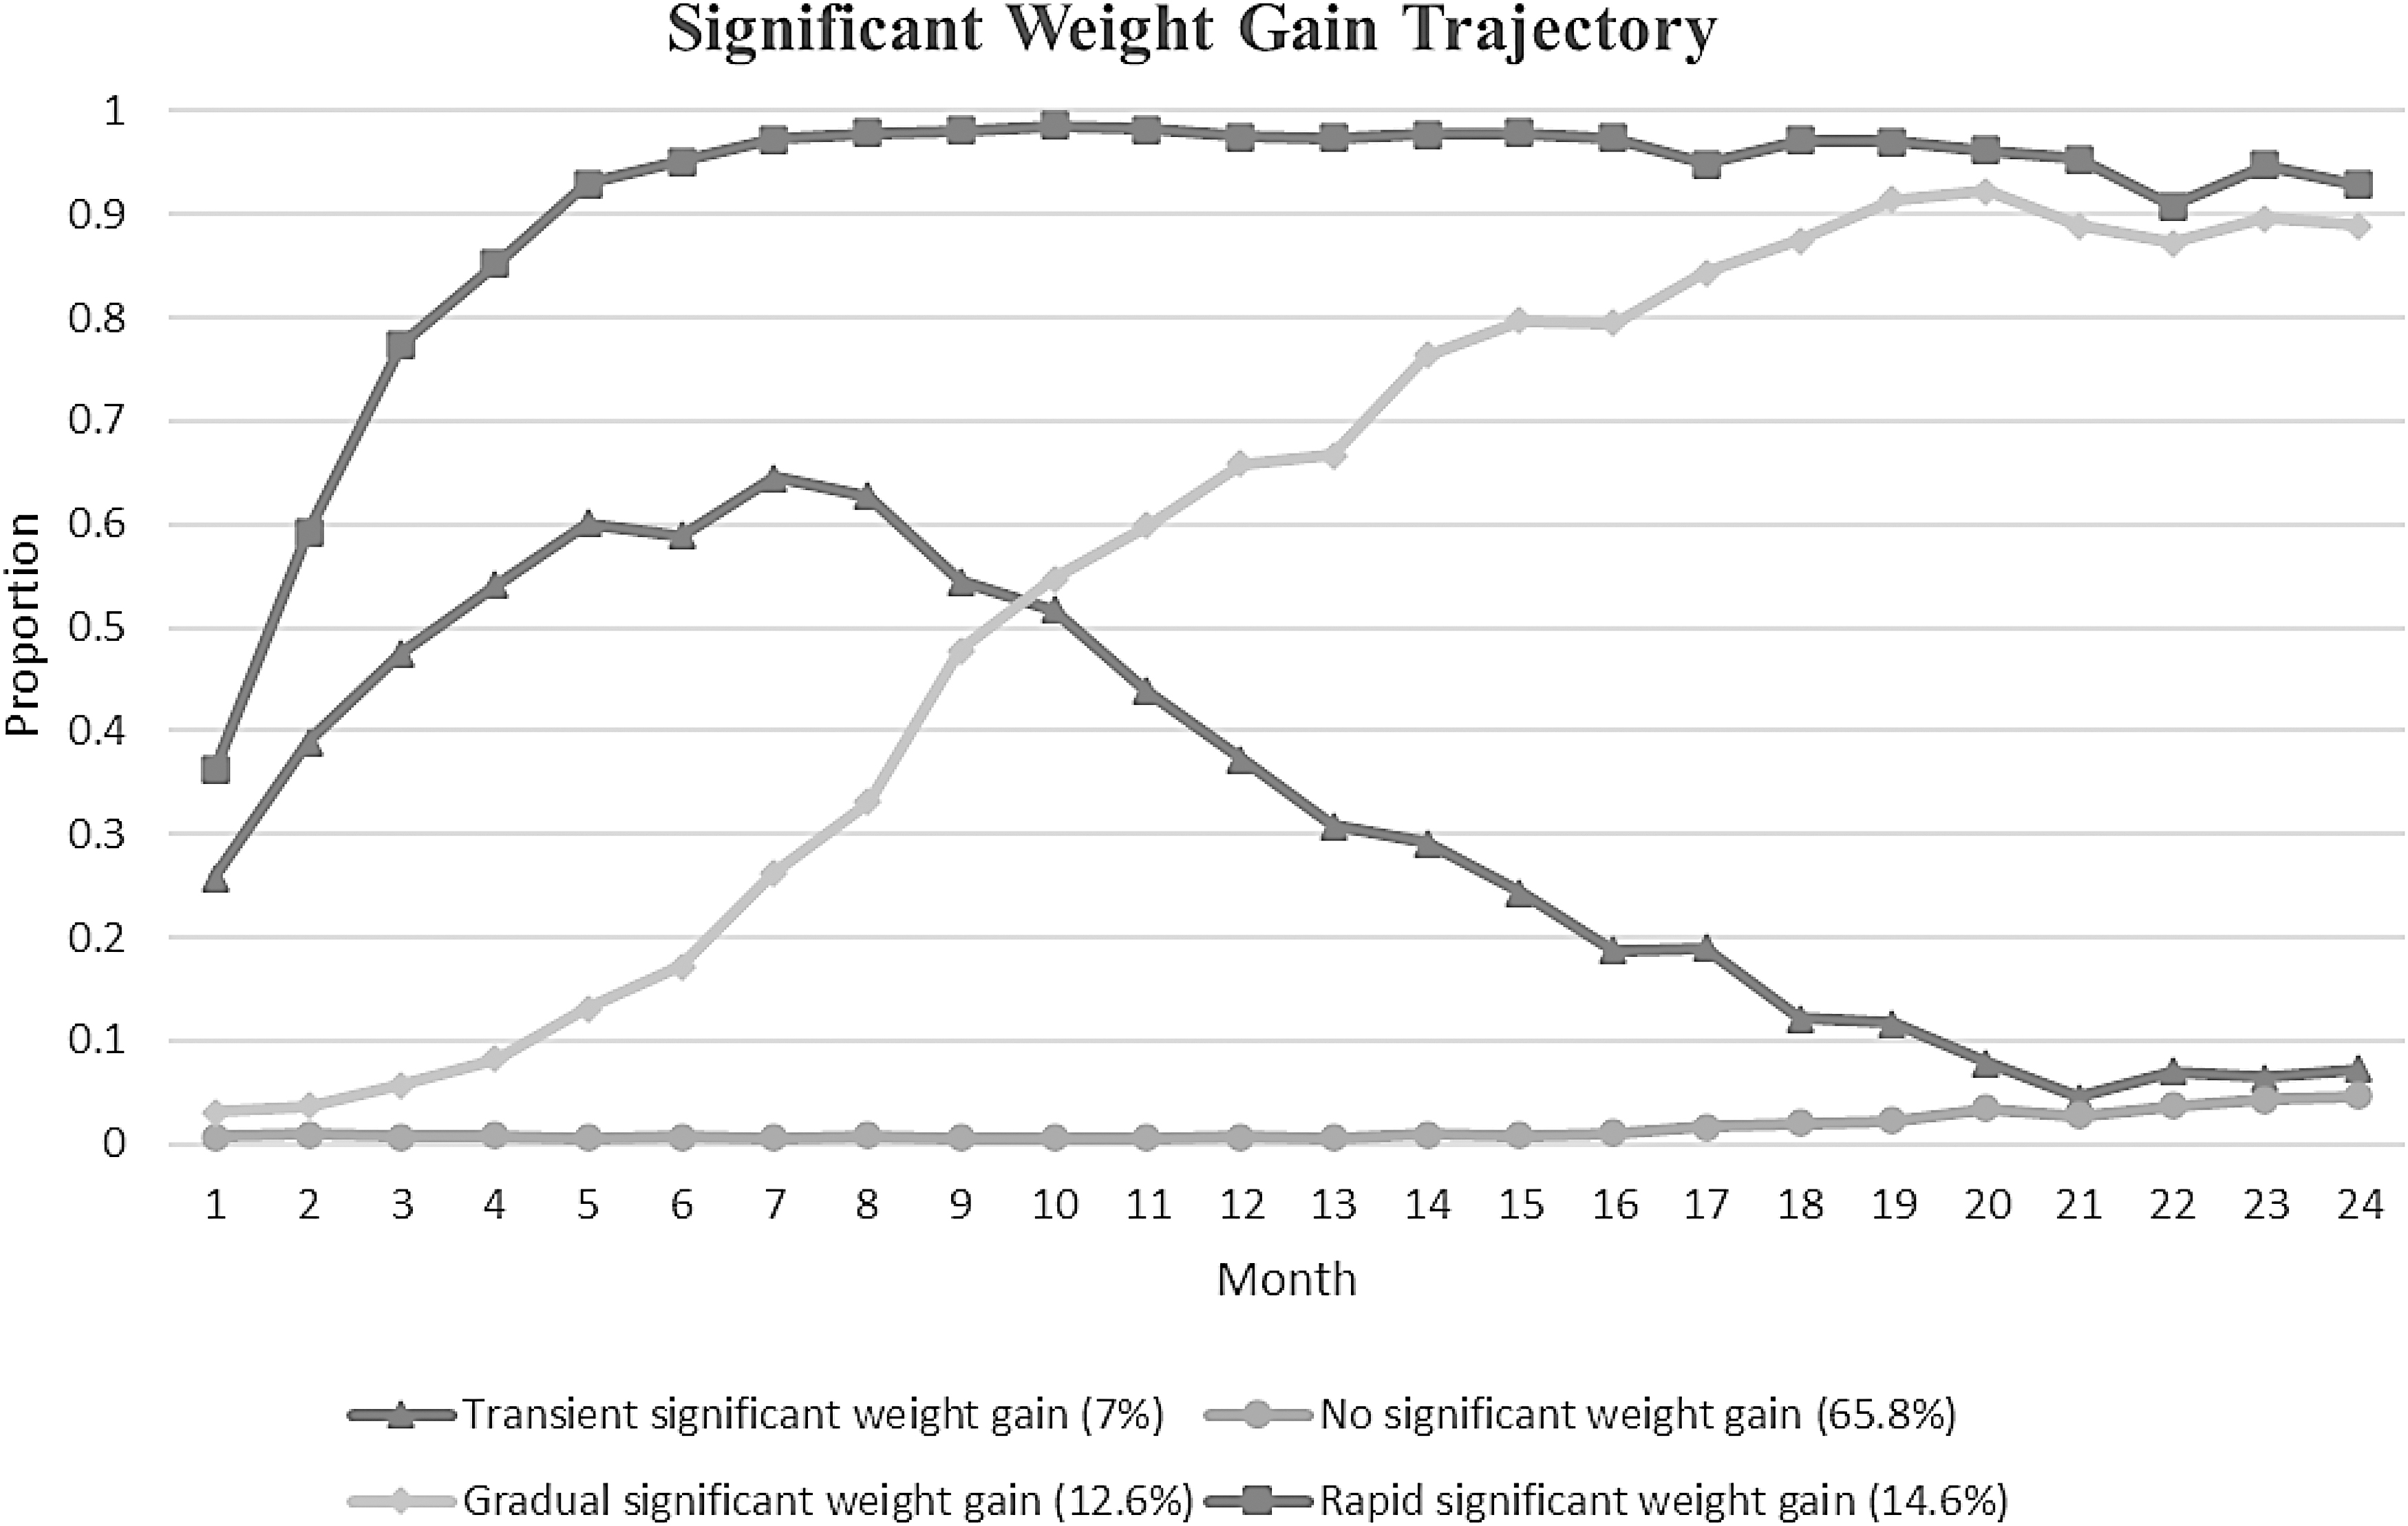
Mean monthly BMI z-score changes for clinically significant weight gain trajectories.
Sensitivity analysis
A subcohort of 10,997 (68%) patients with three measurements of BMI z-score, including one at baseline and at least two in the follow-up period included in the trajectory model. Figure 3 presented the sensitivity analysis results, which showed similar findings. The 4-group trajectory model was selected as the optimal model. Within the optimal 4-group trajectory model, 35.1% of patients experienced CSWG, while 64.9% did not.
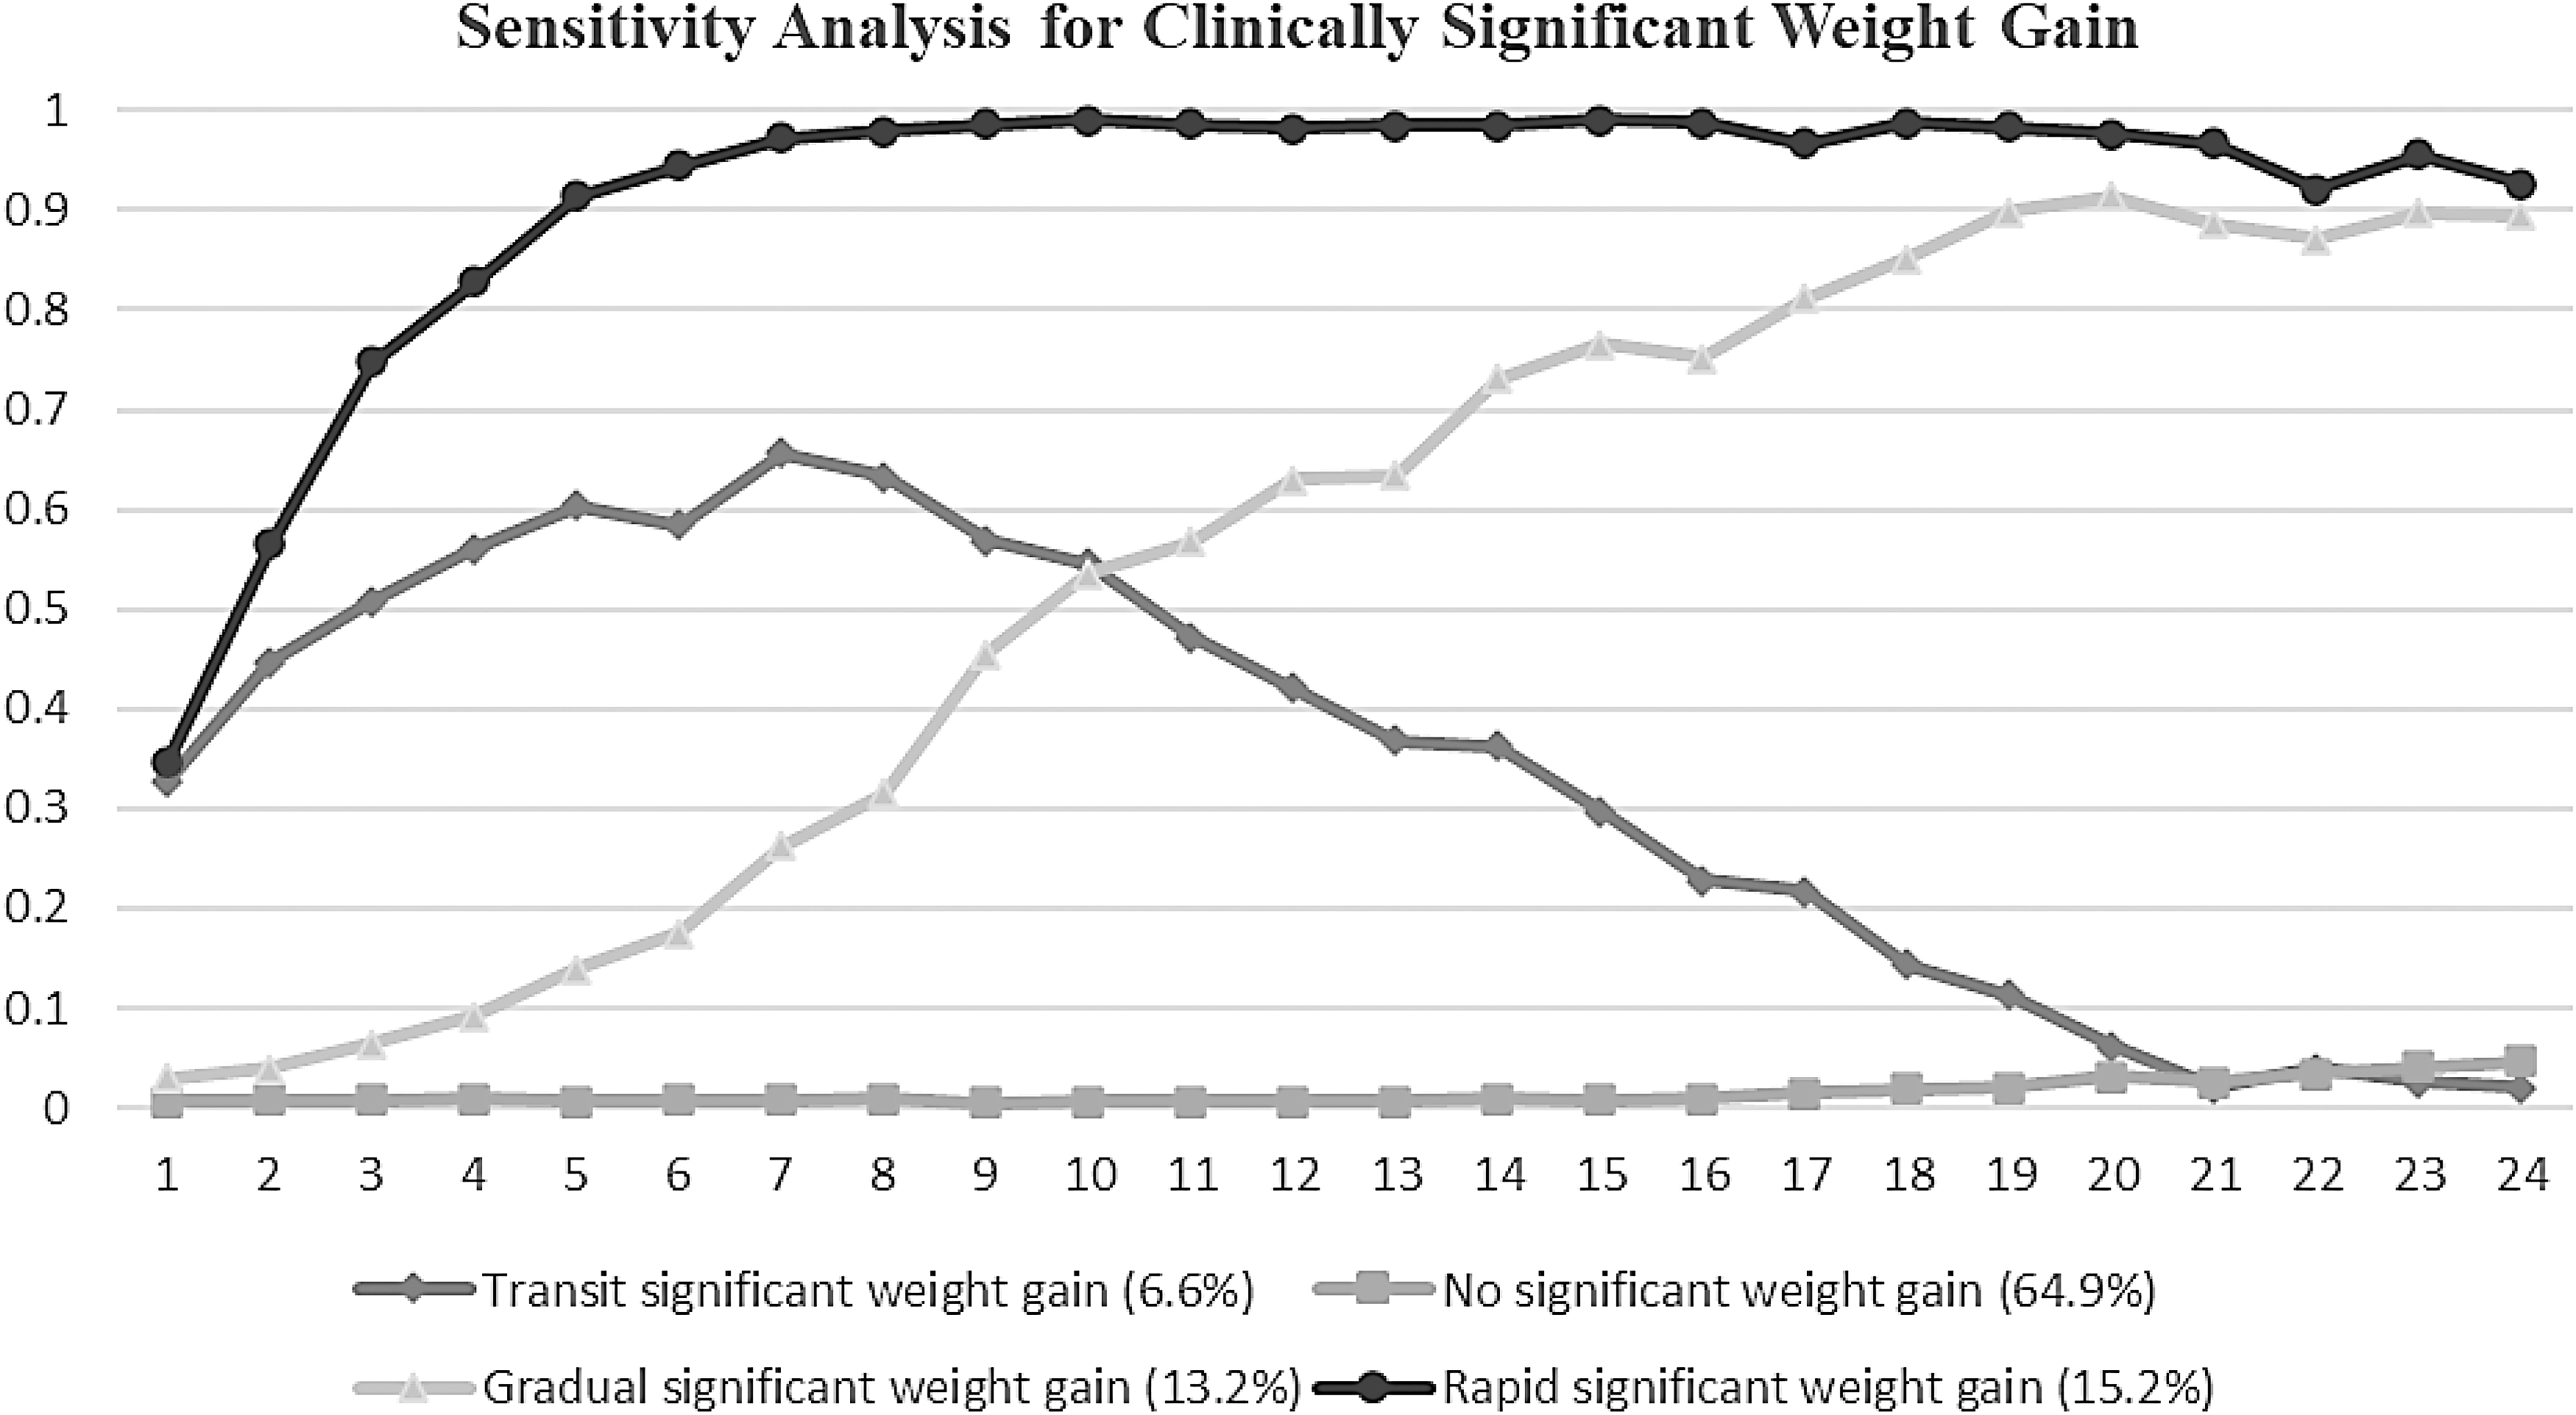
Sensitivity analysis: mean monthly BMI z-score changes for clinically significant weight gain trajectories using patients with at least three BMI z-score measures.
Predictors associated with CSWG
Table 4 presents the demographic, clinical, and provider characteristics of the four CSWG trajectory groups, and the results of the multinomial regression testing for differences across groups. Characteristics that differentiate patients with and without CSWG include sex, age, race/ethnicity, baseline BMI z-score, and SGA medication. Specifically, being male, younger, non-Hispanic White, with lower baseline BMI z-score, and receiving olanzapine were positively associated with the higher likelihood of being a member of the rapid CSWG group than the non-CSWG group. Similar results are also observed when comparing patients in the gradual CSWG group versus the non-CSWG group and the comparison between transient CSWG versus the non-CSWG group. The main difference is that race/ethnicity was not found to be significant in the latter two comparisons.
Comparison of Patient Demographic, Clinical, and Provider Between the no Significant Weight-Gain Group and each Significant Weight-Gain Group
Only statistically significant predictors for the type of SGA are presented in the table.
ADHD, attention-deficit/hyperactivity disorder; AUC, Area under the Receiver operating characteristic (ROC) Curve; PCP, primary care physicians; SGA, second-generation antipsychotic.
The results of the AUC analyses are presented in Table 4. Notably, the comparison between the no significant and rapid significant weight gain trajectories achieved the highest AUC of 0.83, indicating a strong discriminatory ability to distinguish between these two groups. Similarly, the AUC for comparing the no significant and the gradual significant weight gain trajectories was 0.80. However, the pairwise comparisons between rapid significant weight gain and gradual significant weight gain trajectories had an AUC of 0.54.
Discussion
AIWG has a substantial impact on the overall wellbeing and physical health of children and adolescents, especially when the weight gain exceeds clinically significant thresholds (De Hert et al., 2011a; Libowitz and Nurmi, 2021; McIntyre and Jerrell, 2008). We found that there seem to be different weight gain trajectories, with four trajectory groups being the most likely number, according to this data set. Of the patients who experienced significant weight gain, we found that nearly half (14.6%) had a rapid significant weight increase during the few months since the SGA initiation, which is consistent with the findings of clinical trials (Haas et al., 2009; Karatzi et al., 2021; Kryzhanovskaya et al., 2009). The other half (12.6%), however, had varying time to CSWG that was evenly distributed across the entire SGA treatment period. Surprisingly, the finding also identified that 7% of the SGA recipients had a transient CSWG, which could be explained by regular physical development (e.g., growth spurt) happening during the SGA treatment.
We also noted a range of demographic, clinical, and provider characteristics that distinguish between trajectory group membership. Being male, younger in age, having a lower baseline BMI z-score, and receiving olanzapine or risperidone as the initial SGA was associated with rapid and gradual CSWG. These findings are consistent with the risk factors identified previously for AIWG (Calarge et al., 2009; van der Esch et al., 2021; Hoekstra et al., 2010; McCracken et al., 2008; Ratzoni et al., 2002). Using these identified correlates, we have found that patients with or without CSWG could be accurately predicted. However, the model diagnostics also suggested that baseline characteristics alone may not be sufficient to differentiate various patterns of CSWG.
Our study findings are clinically significant because the risk of CSWG could be predicted using patients' characteristics at the SGA initiation, suggesting that CSWG prevention may be possible. Given the known cardiometabolic sequels associated with CSWG, which include metabolic disorders (McIntyre and Jerrell, 2008), cardiovascular complications (De Hert et al., 2011a), and psychosocial distress (Sarwer and Polonsky, 2016), and considering the limited reversibility (about 25% of weight loss) of AIWG observed in children with bipolar disorder after pharmacotherapy discontinuation (Upadhyay et al., 2019), the ability to predict the risk and provide timely intervention would be very useful.
Several limitations should be acknowledged. First, our study relied on retrospective data from electronic health records, which may introduce selection bias and incomplete data. For example, differences in health insurance or locally available health care workforce may influence whether a child is treated by a pediatrician or a psychiatrist.
Another limit, due to the use of practice-based data, is that there were few BMI z-score measures for any patient. Clinical guidelines suggest a BMI z-score assessment every 3 months for many children and adolescents prescribed SGAs (Ho et al., 2011), but it is recognized that, in practice, BMI and other metabolic monitoring rates are performed and recorded for only about 30% of these recommended levels (Honey et al., 2013; Olin et al., 2019), providing this inherent data limit.
Prospective studies with more frequent BMI measurements would enhance the robustness of future studies further attempting to discern clinically relevant weight gain trajectories. Also, there may be more predictors of the likelihood of weight gain. There may be genetic (Lett et al., 2012) and environmental factors that could affect weight change, such as dietary and physical activities (Karatzi et al., 2021).
Conclusion
In conclusion, our group-based trajectory modeling identified four distinct weight gain trajectories (Rapid, Gradual, Transient, and No CSWG) among pediatric SGA recipients, providing valuable insights into CSWG development trends. These findings underscore the importance of personalized monitoring and timely interventions for at-risk individuals. Our study suggests that patient characteristics at SGA initiation can predict the risk of CSWG. Future research should employ sophisticated models to differentiate various levels of significant weight gain trajectories and explore interventions for addressing CSWG in children and adolescents prescribed SGAs.
Clinical Significance
From a clinical standpoint, the identification of distinct weight gain trajectories serves as a valuable tool for clinicians, enabling them to pinpoint high-risk patients, customize monitoring strategies, and implement intervention management tailored to each patient's specific risk profile. In addition, early identification of persistent CSWG risk is crucial at the initiation of SGAs, emphasizing the need for health care providers to assess patient profiles.
Footnotes
Author Disclosure Statement
All authors stated that there are no conflicts of interest.
Funding Information
No funding was received for this article.