
Abstract
Introduction:
Autism spectrum disorder (ASD) is characterized by deficits in social behavior and executive function (EF), particularly in cognitive flexibility. Whether transcranial magnetic stimulation (TMS) can improve cognitive outcomes in patients with ASD remains an open question. We examined the acute effects of prefrontal TMS on cortical excitability and fluid cognition in individuals with ASD who underwent TMS for refractory major depression.
Methods:
We analyzed data from an open-label pilot study involving nine participants with ASD and treatment-resistant depression who received 30 sessions of accelerated theta burst stimulation of the dorsolateral prefrontal cortex, either unilaterally or bilaterally. Electroencephalography data were collected at baseline and 1, 4, and 12-weeks posttreatment and analyzed using a mixed-effects linear model to assess changes in regional cortical excitability using three models of spectral parametrization. Fluid cognition was measured using the National Institutes of Health Toolbox Cognitive Battery.
Results:
Prefrontal TMS led to a decrease in prefrontal cortical excitability and an increase in right temporoparietal excitability, as measured using spectral exponent analysis. This was associated with a significant improvement in the NIH Toolbox Fluid Cognition Composite score and the Dimensional Change Card Sort subtest from baseline to 12 weeks posttreatment (t = 3.79, p = 0.005, n = 9). Improvement in depressive symptomatology was significant (HDRS-17, F (3, 21) = 28.49, p < 0.001) and there was a significant correlation between cognitive improvement at week 4 and improvement in depression at week 12 (r = 0.71, p = 0.05).
Conclusion:
These findings link reduced prefrontal excitability in patients with ASD and improvements in cognitive flexibility. The degree to which these mechanisms can be generalized to ASD populations without Major Depressive Disorder remains a compelling question for future research.
Introduction
Autism spectrum disorder (ASD) is a heterogeneous neurodevelopmental condition characterized by deficits in social behavior and restrictive repetitive patterns of behaviors (DIAGNOSTIC AND [5TH ED]). Difficulties in executive function (EF) often have a negative impact on educational achievement, occupational performance, and social relationships in individuals with ASD. Among EF impairments, difficulties in cognitive flexibility are frequently cited as the most impactful and are related to core ASD features (D’Cruz et al., 2016; D’Cruz et al., 2013; Dirks et al., 2020; Van Eylen et al., 2011; Hoofs et al., 2018; Leung and Zakzanis, 2014; Lage et al., 2022).
Cognitive flexibility refers to the ability to adapt to changing demands or circumstances (Dajani and Uddin, 2015). Impairments in cognitive flexibility may manifest as rigid or concrete thinking patterns, difficulty in adjusting to changes in routine, and resistance to shifting attention between tasks(Hill, 2004). Cognitive disturbance is a core feature of depression and one of the current diagnostic criteria for major depressive disorder (DIAGNOSTIC AND [5TH ED]). This is often seen as concentration difficulties and cognitive biases in emotion processing. Evidence-based therapies such as cognitive behavioral therapy focus on improving cognitive flexibility and are a critical target for therapeutic intervention (Kwak et al., 2016).
Studies have also emphasized the importance of cognitive flexibility in real-world outcomes of ASD, including adaptive behavior, academic success, and overall quality of life (St John et al., 2018; Bertollo et al., 2020; de Vries and Geurts, 2015). A recent meta-analysis found pervasive difficulties (moderate effect size) in cognitive flexibility in ASD (n = 2122 participants) across the lifespan, even in the absence of comorbid learning disabilities (Lai et al., 2017). Cognitive flexibility challenges have been consistently associated with neuroanatomical correlates in ASD (D’Cruz et al., 2016; D’Cruz et al., 2013; Dirks et al., 2020; Van Eylen et al., 2011; Hoofs et al., 2018; Leung and Zakzanis, 2014; Lage et al., 2022). In ASD, impairments in inhibitory and excitatory control have been most studied in the frontal and temporoparietal lobes, particularly the temporoparietal junction (TPJ). Deficits in TPJ activity and hyperexcitability in the frontal lobe have been observed in patients with ASD. Abnormalities in the frontal circuit have been shown to contribute to repetitive behaviors in ASD, whereas diminished activities in the TPJ can lead to difficulties in social interactions and atypical moral behaviors often observed in ASD. (Leisman et al., 2023; Hao et al., 2022; Hu et al., 2021; Tei et al., 2017; Tei et al., 2019). This imbalance between inhibitory and excitatory control mechanisms can result in difficulties in response inhibition, attentional control, and cognitive flexibility, ultimately affecting daily life and social interactions (Zikopoulos and Barbas, 2013).
Transcranial magnetic stimulation (TMS) is a noninvasive method of neuromodulation that delivers brief, high-intensity electromagnetic pulses through the scalp to induce neuronal depolarization in targeted brain tissue (Rossini and Rossi, 2007). TMS has been rapidly adopted and has demonstrated variable success in treating mood disorders in adolescents (Chung et al., 2015). In March 2024, TMS received Food and Drug Administration (FDA) clearance for the treatment of MDD in adolescents (Neuronetics, 2024). Although TMS has been shown to effectively modulate cortical excitability, the precise mechanisms by which it induces behavioral changes are not yet fully understood (Wilson et al., 2022; Edelmuth et al., 2010). Accelerated theta burst stimulation (aTBS) is a novel TMS protocol that delivers a more rapid and efficient treatment, requiring about 3 minutes per sessions, compared with traditional TMS, which can take up to 30–60 minutes per session.
Electrophysiological (EEG) periodic oscillations have been found to be linked to numerous physiological, cognitive, or behavioral states (Ahmad et al., 2022; Lan et al., 2005; Takarae et al., 2024). Fitting Oscillations and One-Over-F (FOOOF), now referred to as spectral paramterization, is a novel EEG analysis technique that has been previously used to quantify cortical excitability in human and animal models (D’Cruz et al., 2016; D’Cruz et al., 2013; Van Eylen et al., 2011). To our knowledge, this is the first time FOOOF analysis is used to investigate changes related to cortical excitability in depressed individuals with ASD. TBS has been found to cause cortical excitability changes for 200%–300% longer in ASD and enhances neuroplasticity (Hoofs et al., 2018).
We recently published the results of our open-label pilot study that examined the use of aTBS for treatment-resistant depression in individuals with ASD (Blank et al., 2024). Our pilot data showed a strong correlation between decreased activity in the prefrontal cortex (PFC), activation of the right temporoparietal regions, and improvements in fluid cognition after prefrontal TMS. These regions, particularly in ASD, have also been implicated as key nodes in cognitive flexibility and social cognition tasks (Tei et al., 2017; Tei et al., 2019; David et al., 2014).
Compared with their cohorts, individuals with ASD have excessive hyperexcitability in the PFC.
We hypothesized that prefrontal aTBS improves cognitive flexibility by reducing excessive hyperexcitability in the PFC and normalizing the excessive inhibitory control over temporoparietal region. As a result, activity in the temporoparietal regions critical to facilitate cognitive flexibility can occur.
In highly depressed individuals with ASD, cognitive inflexibility exists, and it is unclear whether this is related to depression, comorbidities, or is a core symptom of ASD. In this study, we investigated acute changes in cortical excitability using scalp-recorded EEG data and fluid cognition following aTBS administration for up to 12 weeks. To evaluate local cortical hyperexcitability, we used Gao’s AMPA/GABA balance model, which can be directly quantified by estimating the exponential slope of the power spectral density (PSD) of the EEG signals (Donoghue et al., 2020; Gao et al., 2017).
Methods
Ethics statement
This study was approved by the Institutional Review Board of Cincinnati Children’s Hospital Medical Center and registered with ClinicalTrials.gov (NCT01609374). The participants were recruited through various channels, including clinician referrals, email marketing, and outpatient clinics. All participants provided written informed consent before completing the study procedures.
Participants
Eligible subjects met the following inclusion criteria: 1) aged 12–26 years, 2) diagnosed with ASD confirmed by the Autism Diagnostic Observation Schedule, 2nd Edition, 3) diagnosed with major depressive disorder per DSM-5 structured clinical interview for DSM disorders (SCID-5) for subjects over 18, Kiddie Schedule for Affective Disorders and Schizophrenia (KSADS) for subjects under 18), 4) exhibiting treatment resistance to at least one antidepressant medication, 5) Hamilton Depression Rating Scale- 17items (HDRS-17) score (≥20) in the clinically depressed range that was sustained over a 2-week lead-in period, and 6) Global Assessment of Functioning (GAF) score of ≤60.
The exclusion criteria were as follows: 1) any significant psychiatric/neurological disease unrelated to ASD; 2) taking an investigational drug; 3) IQ < 80; 4) history of epilepsy; 5) any significant contraindications to TMS (e.g., pacemaker) (Rossi et al., 2011); 6) prior rTMS treatment; 7) active pregnancy; 8) substance use disorder (excluding tobacco) within the past 6 months; and 9) changes in psychiatric medications within 2 weeks of starting TMS treatment.
TMS device and protocol
A Magstim Horizon™ Performance Stimulator (Magstim/EGI, Whitland, UK) with a 70 mm figure-eight EZ cool coil was used to deliver the treatment. Coil placement was determined using the BEAM-F3 method (Beam et al., 2009) and applied to the dorsolateral prefrontal cortex (DLPFC). All treatment sessions-intermittent TBS (iTBS) and continous TBS (cTBS)-consisted of triplet 50 Hz pulses repeated in 5 Hz bursts for a total of 600 pulses per session at 90% of Resting Motor Threshold (RMT) (Huang et al., 2005). ITBS involved 20 trains that were applied in 2-second bursts with 8-second pauses and cTBS involved a continuous pulse train for a total duration of 53 seconds. TBS sessions were delivered in three sessions daily over 10 days, with 50-minute intervals for a total of 30 sessions (Cai et al., 2023). The duration of each session was 3 minutes and 9 seconds.
Outcome measures
This is an exploratory analysis paper of the RESTORE trial (NCT01609374). The primary outcome measures were changes in the spectral slope (representing cortical excitability) of the PFC and the NIH Cognitive Cognitive Toolbox (NIH-CT) Fluid Composite Score (representing EF).
The NIH-CT is a comprehensive assessment system designed to measure various cognitive functions, including EF, attention, episodic memory, language, processing speed, working memory, and attention, across the lifespan from ages 3 to 85 (Weintraub et al., 2014). This toolbox is reliable for use in children and adolescents (Matuska et al., 2024). The NIHT-CT Fluid Cognition Composite score broadly measures EF (i.e., cognitive flexibility, inhibitory control, and working memory) based on Miyake’s model of EF and attention (Miyake et al., 2000).
Our secondary variable of interest was changes in the NIH-CT Dimensional Change Card Sort (DCCS) subtest—a direct measure of cognitive flexibility. EEG data were collected to assess the changes in regional cortical excitability over time following TMS.
EEG
Data collection and preprocessing
Five minutes of continuous resting-state EEG data were collected at baseline and at 1, 4, and 12 weeks following TMS stimulation. Recordings were collected at a 1000 Hz sampling rate with an EGI NetAmp 400 with a 128-channel HydroCel electrode net (Magstim/EGI, Eugene, OR).
The detailed steps taken to preprocess the recorded data are shown in Supplementary Data S1. The following steps were taken to preprocess the recorded data:
Single-subject processing
EEG data were band-pass filtered from 1.5 Hz (TBW 1.0, filter order 1376) to 55 Hz (TBW 5.0, filter order 276) using an FIR Blackman window.
EEGLAB plugin clean_rawdata() was applied to reduce high-amplitude artifacts (Mullen et al., 2015).
The continuous data at four time points were concatenated into one.
Adaptive Mixture Independent Component Analysis (Kabbara et al., 2017; Palmer, 2016) was applied.
EEGLAB plugin ICLabel was applied (Pion-Tonachini et al., 2019) to generate probabilistic class labels for the ICs.
Equivalent current dipole models were estimated for ICs using the Fieldtrip functions (Oostenveld et al., 2011). Subsequently, whenever necessary, symmetrical bilateral dipoles were fitted (Borghesani et al., 2016).
PSD were calculated using EEGLAB function spectopo().
Spectral parameterization analysis based on Gao’s AMPA/GABA model (Donoghue et al., 2020; Gao et al., 2017) was applied.
Group-level processing
The “Brain”-class ICs (i.e., the probability for this class was the highest) were selected.
Clustering analysis was performed on IC dipoles based on the xyz coordinates of the estimated current dipoles to obtain nine clusters.
For each IC cluster, we calculated the dipole density, average PSD, and FOOOF (described below) measures.
Inferential statistics
For the rating scale data, we employed mixed-effects linear models to account for the repeated measures within participants across groups, as well as the Benjamini–Hochberg procedure to control the false discovery rate, correcting for multiple comparisons. To assess how regional cortical excitability contributes to changes in EF, we conducted a multiple regression analysis to explore the relationship between changes in the PFC and temporoparietal cortical excitability (predictors) and changes in Fluid Cognition Composite score (response).
For the EEG data, we used a mixed-effects linear model to compare the data across time points. Because the results did not survive formal multiple comparison corrections, we took a liberal approach and reported the uncorrected p-values for exploratory purposes. For the region of interest, we selected IC clusters localized in the PFC (site of TMS stimulation) and temporoparietal regions (exploratory EF/ASD target).
FOOOF
EEG is a highly feasible method for postulating whole-brain hypotheses regarding the effects of neuromodulation in neurodevelopmental conditions (Ewen et al., 2019; Webb et al., 2019). To investigate the brain changes that engender mood and cognitive changes in the RESTORE study, we quantified regional cortical excitability using the FOOOF method. This FOOOF method breaks down a typical EEG power spectrum into aperiodic (1/f) activity and periodic oscillations (Donoghue et al., 2020).
The FOOOF method is well established for capturing the excitatory/inhibitory (E/I) balance within cortical networks. Importantly, the slope of the aperiodic component (spectral exponent) can be used to estimate the regional cortical excitability (Donoghue et al., 2020; Gao et al., 2017; Ahmad et al., 2022). As shown in Figure 1, the aperiodic component (blue curve) represents the background activity (blue inset) in a 1/f distribution. The periodic component (orange curve) models narrow-band oscillations that are typically associated with cognitive and attentional processes (orange inset). Changes in cortical excitability can be inferred from the slope (rotation) of the aperiodic component (dotted lines); a steeper slope (more negative exponent) indicates lower excitability, whereas a shallower slope (less negative exponent) indicates higher excitability.
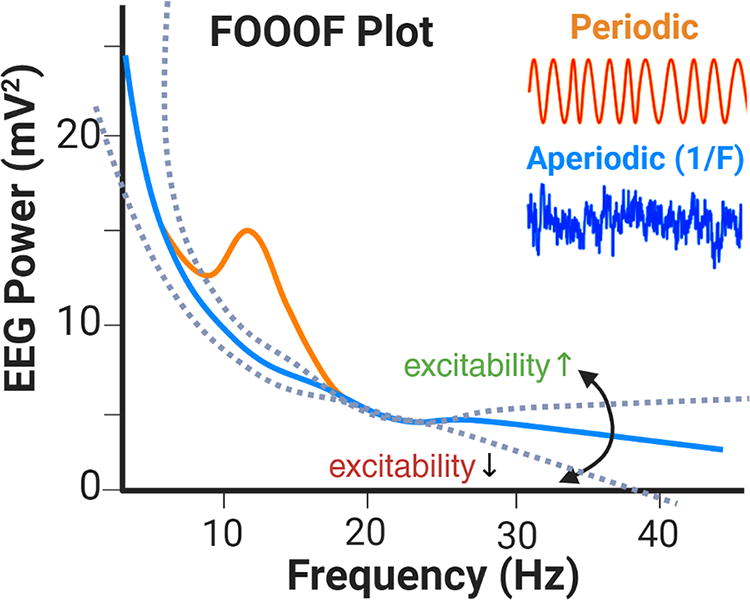
Cortical excitability estimation. This FOOOF method separates the EEG power spectrum into aperiodic (blue line) and periodic (orange line) components. FOOOF, Fitting Oscillations and One-Over-F; EEG, electroencephalography.
Results
Participant characteristics
Ten participants (2 females; age range = 17–26.2; mean age = 21.5) with ASD and treatment-resistant MDD (mean failed antidepressant trials = 3.44 ± 1.7) were randomized to either unilateral or bilateral aTBS treatment (see Supplementary Fig. S1). The demographics and baseline clinical measures (including ASD and MDD symptomatology) were similar between the treatment groups (Table 1). One participant dropped out of the study because of intolerance.
Baseline Demographics and Characteristics
Mean ± SD; n (%).
Fisher’s exact test. ADHD, attention-deficit/hyperactivity disorder; DLPFC, dorsolateral prefrontal cortex; SRS-II, Social Responsiveness Scale second edition; BDI-II, Beck Depression Inventory-II; PSQI, Pittsburgh Sleep Quality Index,
Summary of Outcome Measures
Mean ± SD.
Fisher’s exact test.
UL, unilateral; BL, bilateral; BRI, behavioral regulation index; MI, metacognition index; GEC, global executive composite.
Summary of Electroencephalography Findings in Selected Brain Regions
Our analysis indicated that the treatment group (bilateral vs. unilateral) exerted no discernible impact on the outcomes of interest (see Table 2). Given the lack of group effects, we merged participants into a single cohort for subsequent analyses.
Clinical outcomes
Subjects exhibited moderate to severe depression symptoms (mean HDRS 20.2 ± 3.4) at baseline. There was an improvement in the NIH-CT Fluid Cognition Composite score (F3,32 = 9.12, p < 0.001). There was significant improvement following aTBS by Week 1 (t32 = 2.46, p = 0.02; estimated change = 7.33), which was sustained through week 4 (t32 = 2.87, p = 0.007; estimated change = 8.56) and week 12 (t32 = 5.22, p < 0.0001; estimated change = 15.56). In addition, there was a significant improvement in the NIH-CT subtests of DCCS, flanker task, and processing speed from pre-TBS to week 12 (t32 = 3.79, p < 0.001). In addition, we previously showed a significant effect of 30 sessions of aTBS on depression symptoms in individuals with ASD, as evidenced by substantial reductions in depressive symptoms over time via the HDRS-17 (F3,32 = 29.31, p < 0.0001). We observed a significant correlation between improved Fluid Cognition Composite scores at week 4 and a reduction in the HDRS-17 scores at week 12 (r = 0.71, p = 0.05).
EEG findings
Data preprocessing and quality control
None of the channels was rejected. EEGLAB plugin clean_rawdata() rejected mean 2.45% (SD 0.71, range 0–45.3) of data. The average length of the data analyzed was 303.0 s (SD 39.0, range 170.0–482.2). The average number of brain ICs was 43.3 (SD 20.3, range 14–107). The average percent variance of the brain ICs was 29.2% (SD 14.9, range 9.1–67.9).
Group-level EEG reconstruction
Using brain-class ICs, we reconstructed group-level EEG data in nine clusters (see Fig. 2). The 2 × 4 conditions were collapsed to provide an overview for validation. The anatomical locations indicated in the plot title were based on the automated anatomical labeling atlas (Tzourio-Mazoyer et al., 2002). The anatomical labels of the three closest regions are shown as distances. The z-coordinates of the selected slices are shown in the dipole density plot. References to subcortical and noncortical deep regions (middle row, center, and right) should be interpreted as projections from broad cortical sources. The degree of the depth error is proportional to the source area, which is a property of the single-dipole model when fitted to a broad source region (Srinivasan et al., 2006). Overall, the clustering results confirm the validity of the data and analysis. In the next section, we investigate clusters of interest and compare them across conditions.
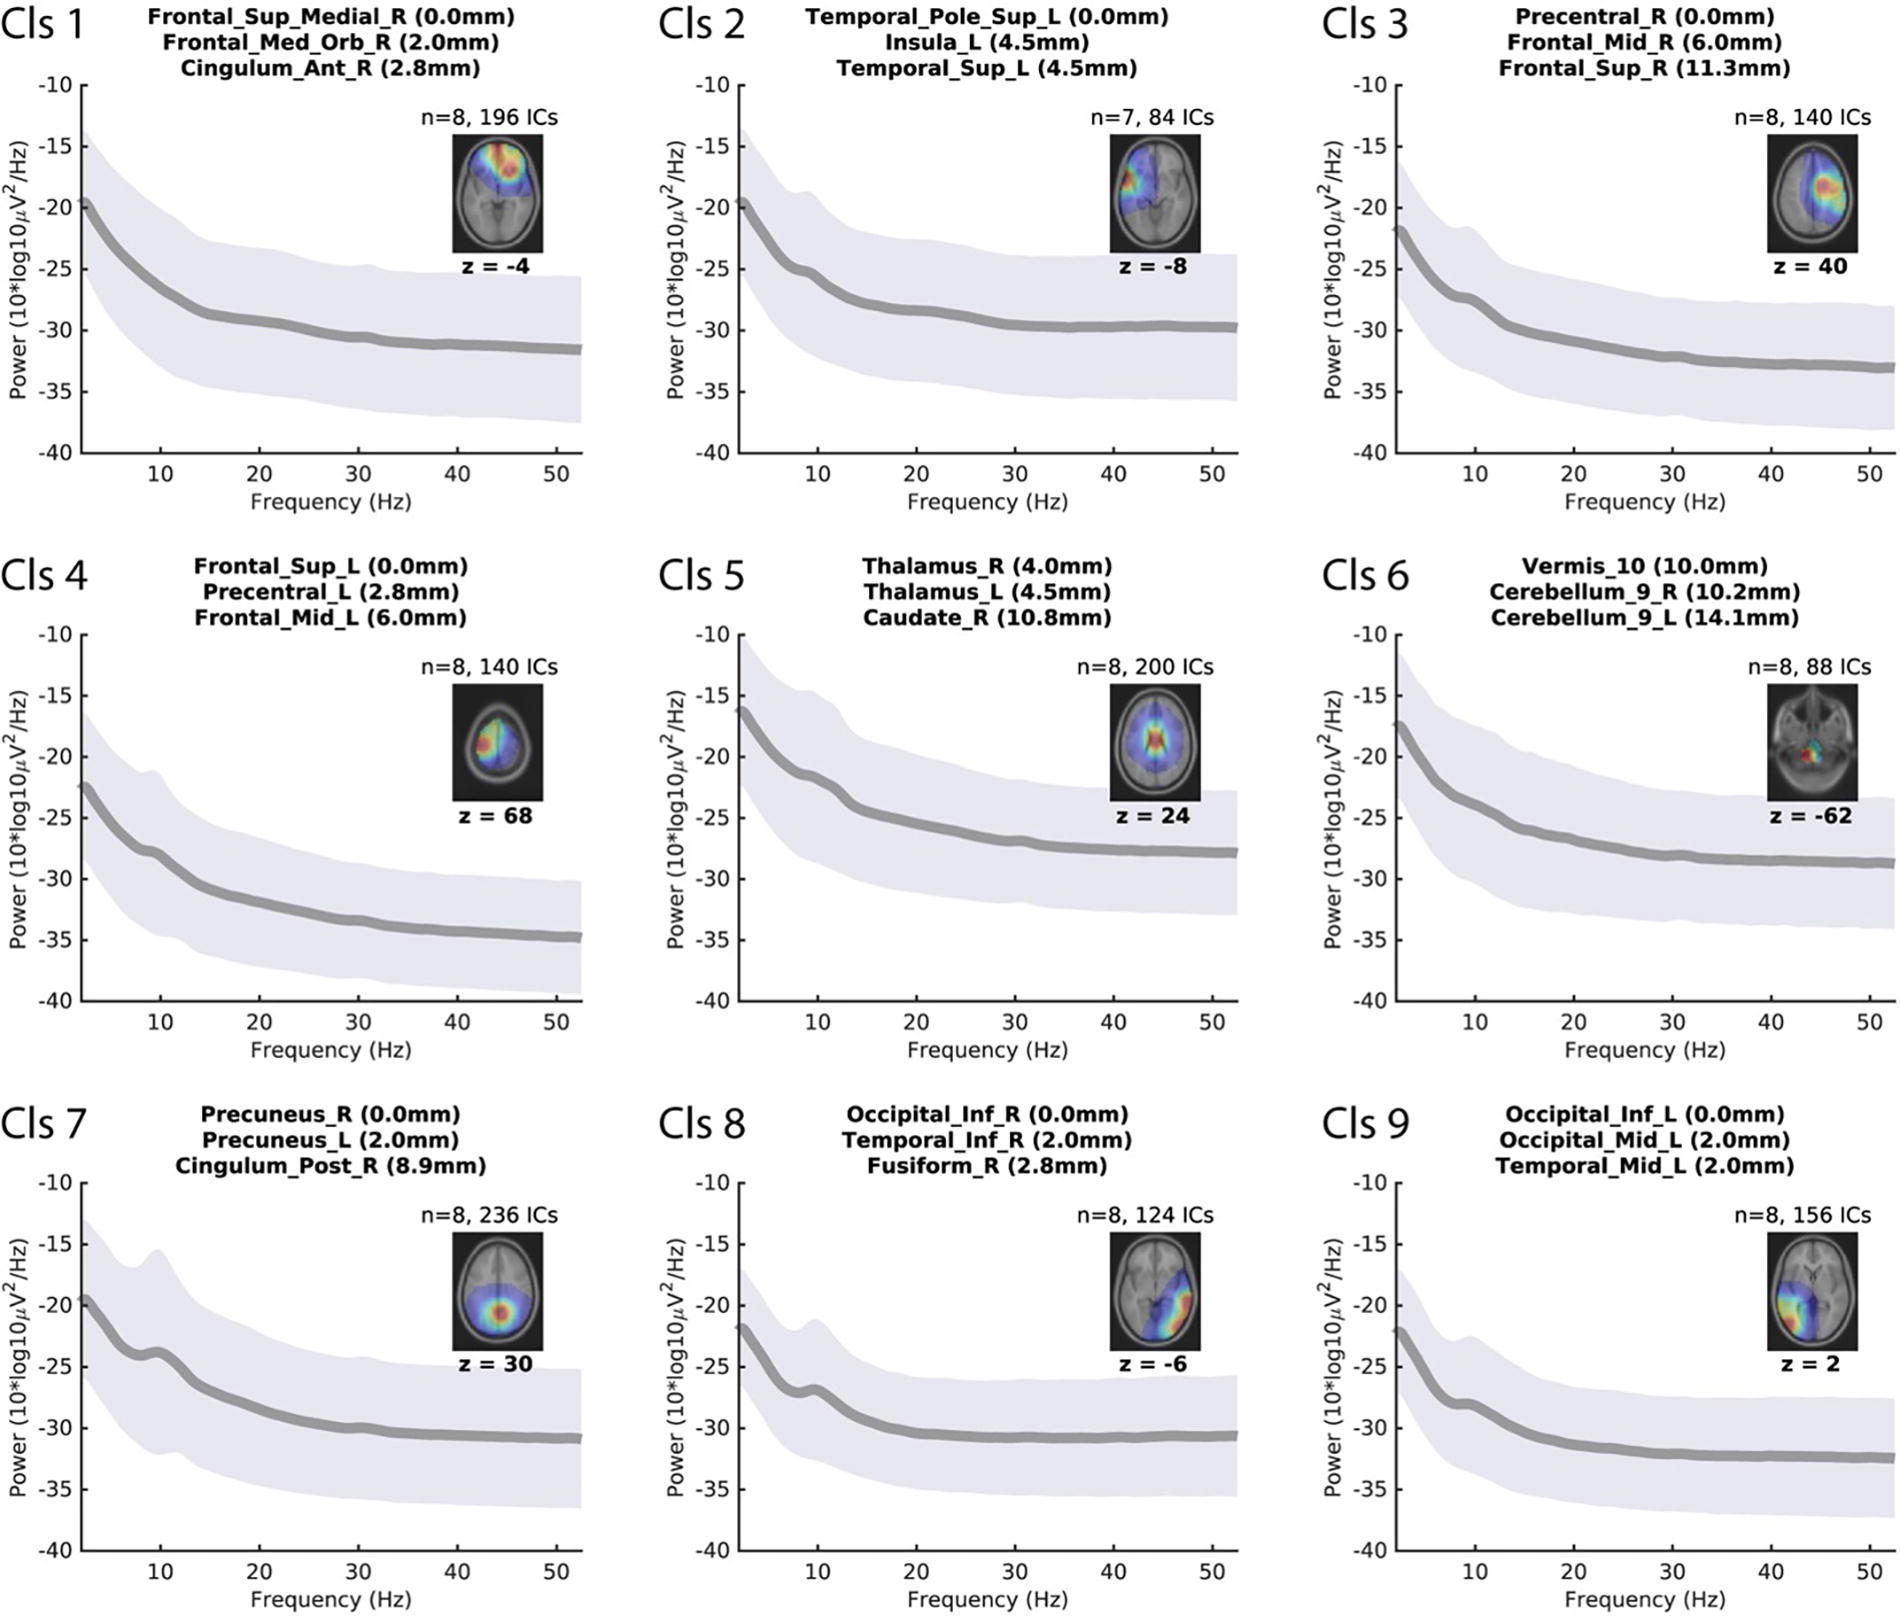
Group-level analysis displaying 9 independent component clusters derived from EEG data. Each panel shows a graph of mean power spectral density (PSD) (solid gray line) with a ±1 SD range (gray shading) plotted against frequency (Hz). Corresponding location information is provided as an axial brain slice with an overlaid dipole density map (color scale represents density; warmer colors indicate higher density), with the z-coordinate of the selected slice indicated below the plot. The title of each cluster lists the three closest automated anatomical labeling (AAL) regions to the dipole density centroid (with distances in mm). Note: References to subcortical and noncortical deep regions (e.g., middle row, center, and right) should be interpreted as indications of broad cortical projections rather than precise localizations. EEG, electroencephalography.
PSD analysis
PSD analyses of the IC clusters of interest revealed modulations at weeks 1, 4, and 12 (see Fig. 3). The frontal cluster (Cls. 1) showed a broadband power difference at week 12. The right occipitotemporal cluster (Cls 8) showed deviations from the baseline at all time points below the alpha range. Notably, in both clusters, the post-TMS power modulations were associated with a reduction in spectral power compared with the baseline period.
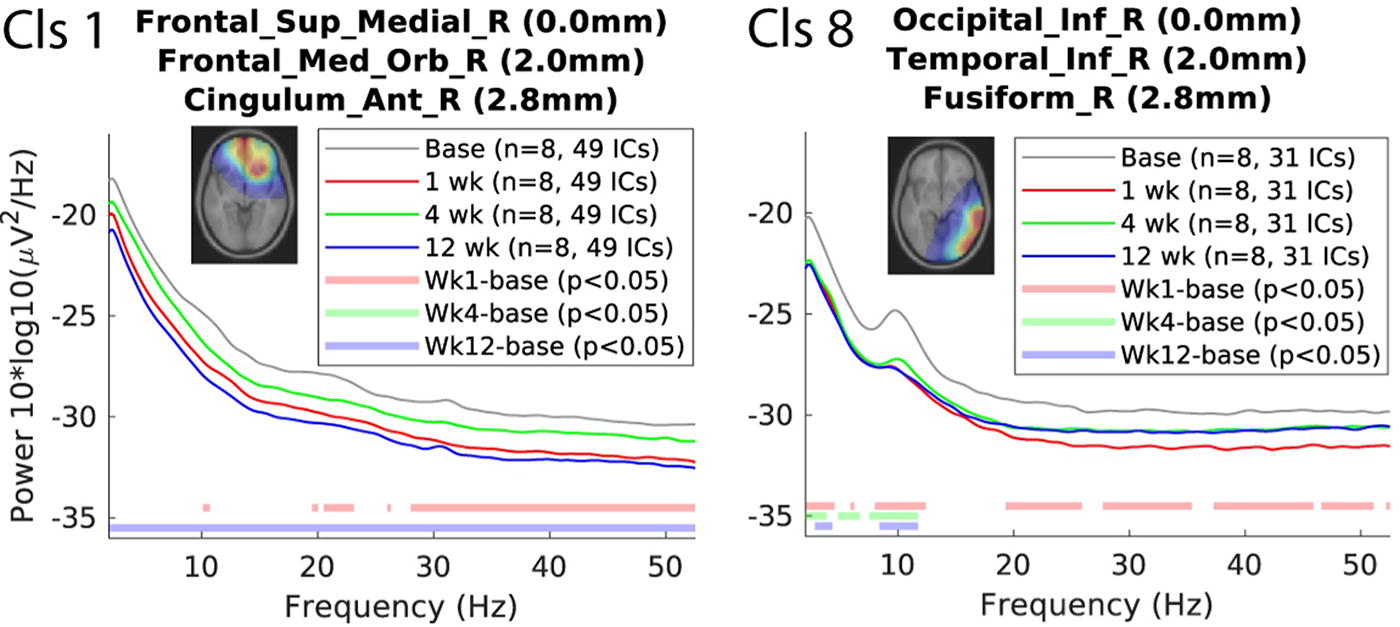
Power spectral densities (PSDs) in clusters of interest pre- and post-TMS. Left (Cls 1): PSD of the frontal superior medial right cluster (including frontal medial orbital right and cingulum anterior right) across baseline and weeks 1, 4, and 12 post-TMS. Right (Cls 8): PSD of the right occipital inferior cluster (including temporal inferior right and fusiform right) across the same time points.
Both clusters showed a reduction in spectral power post-TMS compared to baseline, with Cluster 1 exhibiting broadband power differences at Week 12 and Cluster 8 showing deviations at all time points below the alpha range. Significant differences from the baseline (p < 0.05) are indicated for weeks 1, 4, and 12.
Spectral exponent analysis
Using spectral exponent analysis, we found that two IC clusters show evidence of a decrease in the slope of the exponential part of the PSD, which indicates an approach to flatness. According to Gao et al., a flatter PSD may be associated with AMPA dominance over GABA dominance, indicating an inclination to an excitatory state(Gao et al., 2017). This tendency was observed in an EEG source with a very broad cortical projection (Fig. 4) and in the right inferior occipital IC cluster (Fig. 5).
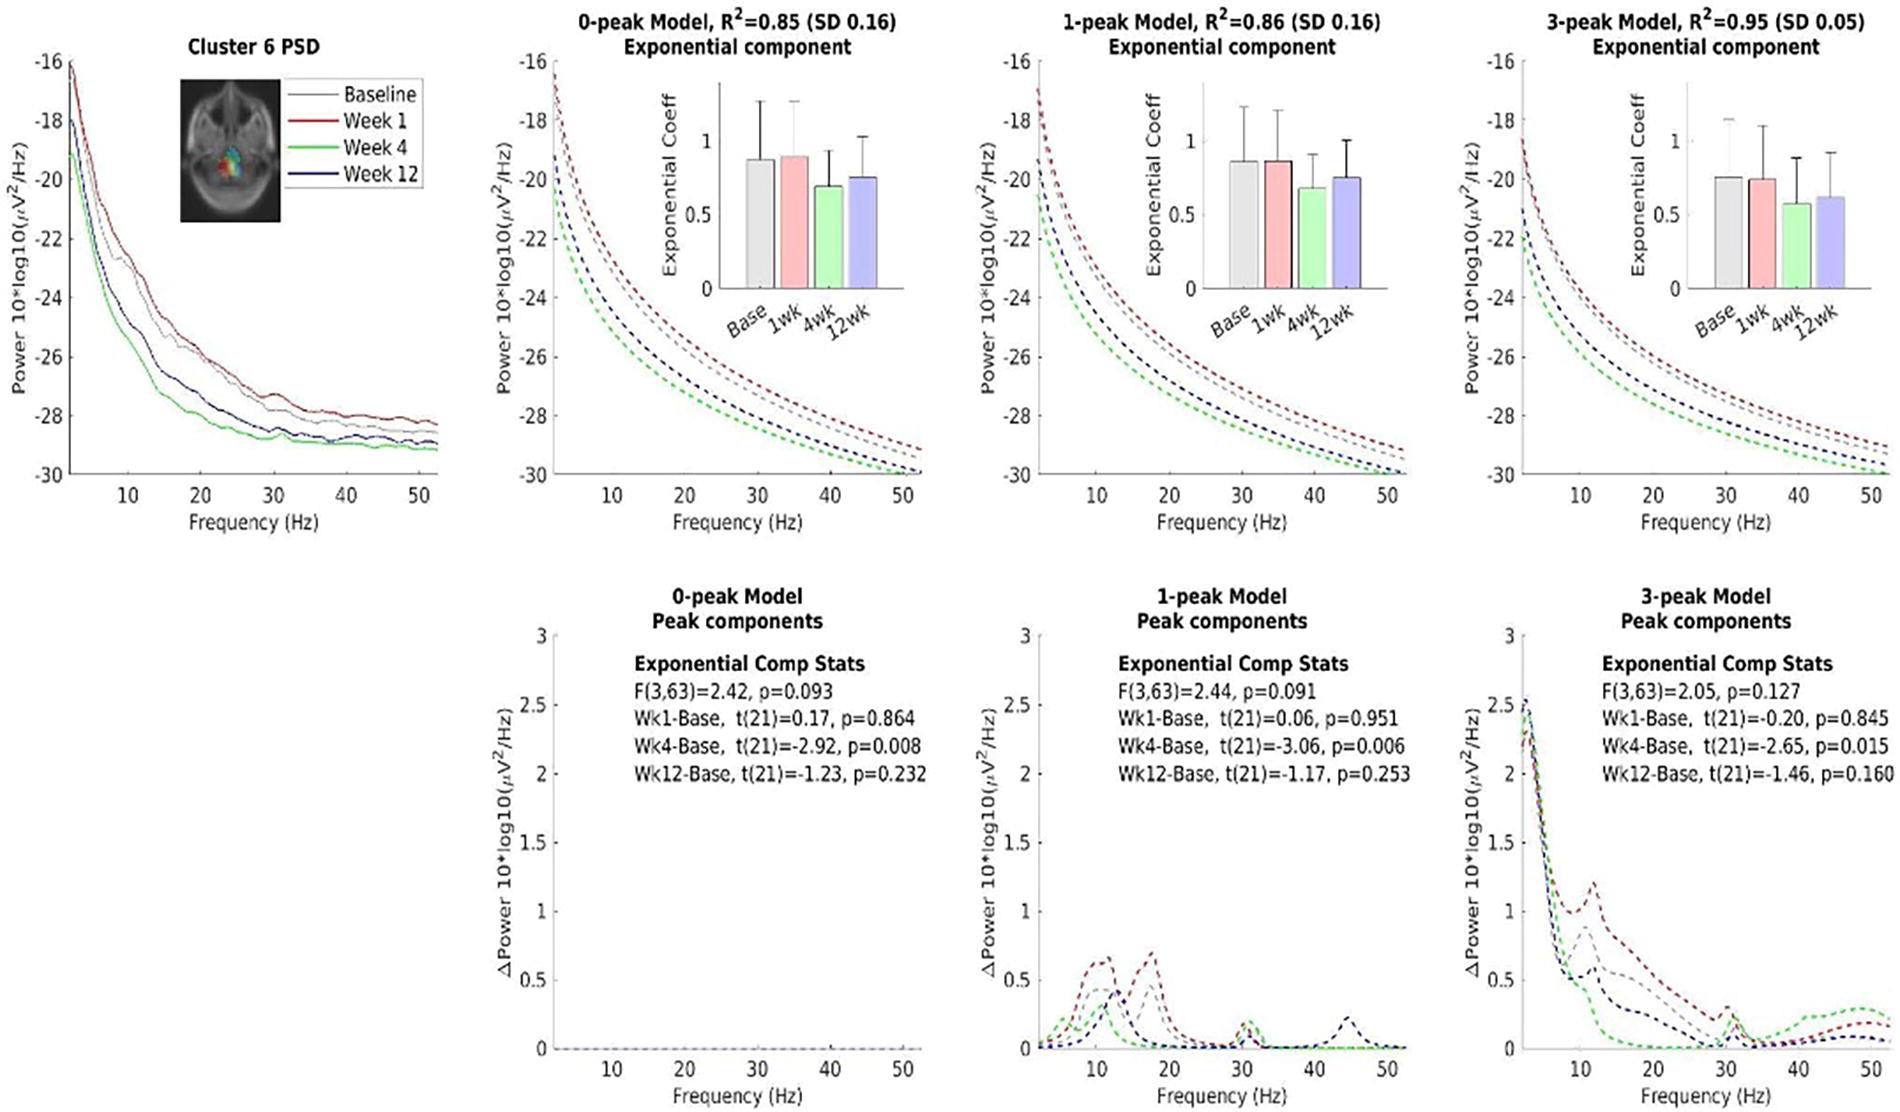
Comparing three models of the spectral exponent analysis. The three models assume zero, one narrow, and three narrow and broad peaks for 0-peak, 1-peak, and 3-peak models on the power spectral density (PSD), respectively. The result shows that the slope of the exponential curve is reduced at Week 4. The common color scheme is shown on the top left plot. Note that the dipole density peak found in the deep subcortical area should be interpreted as a broad cortical source present during the recording. Such a depth error is a property of a single dipole fitting to a dipole layer with a broad cortical distribution.

Similar to Figure 4 but with a different region selected: the right tempoparietal region. The result indicates inclination to the excitatory state in this region at Week 12.
Next, we examined the total power of the IC clustered using the estimated intercepts, another parameter estimated by spectral exponent analysis. For clusters 6 and 8, intercept analysis also confirmed a decrease in the total EEG power. In addition, more than half of the clusters (6/9) showed the same pattern. The reduction in the exponential slopes and the general decrease in the intercept in multiple areas indicate increased cortical excitability in these brain regions.
Discussion
Our study results were significant for improvement in symptoms of depression in individuals with ASD with prefrontal aTBS, which is consistent with previous literature (Ni et al., 2017; Oberman et al., 2016; Oberman et al., 2014; Blank et al., 2024). We measured the cortical excitability changes observed in the PFC and right temporoparietal regions before and after iTBS.
The spectral exponent analysis
We observed changes in three brain regions before and after TBS treatment (see Table 3). We observed a post-TBS decrease in the EEG power in the frontal and right temporoparietal clusters. EEG power modulation is a dynamic process that adapts to the demands of ongoing cognitive tasks, providing a real-time reflection of our cognitive state that is characterized by rapid and unpredictable changes. In our study, the task involved open eye-rest while watching a silent movie. Thus, we interpreted this as a nontask-relevant visual task with an emphasis on resting. ICA-decomposed EEG signals can be used to investigate the electrophysiological correlates of the default mode network (DMN), where the anterior–posterior network nodes are the largest(Prestel et al., 2018). Our results indicated that TMS can directly modulate this network for up to 12 weeks.
In contrast, in the depth cluster (indicating a broad cortical source distribution) and the right temporoparietal clusters, we observed changes to flatter spectral exponents in their PSDs, indicating shifts toward excitatory states. The excitatory-inhibitory
We interpret the post-TBS changes in these regions toward excitatory states as parallel changes at different levels. Unfortunately, we were unable to immediately find relevant references in the literature, as spectral exponent analysis is relatively novel (Darmani et al., 2023). The significance of the changes observed in this experimental context may be better elucidated in future studies. It is important to note that none of these EEG changes survived multiple comparison correction; therefore, caution must be taken when interpreting these results.
Neurophysiology of depression and EF
Depression is characterized by dysregulation of frontal-subcortical circuit loops, which are critical for cognitive function and emotional processing. There is a close interaction between the PFC and temporoparietal region, and their dysfunction has been connected with depression(Samara et al., 2018; Koenigs et al., 2008). The PFC is hyperactive in depression, which often results in the overactivation of subcortical structures, such as the amygdala(Zhang et al., 2020; Kong et al., 2013; Wang et al., 2019). In our study, we found that after 30 sessions of aTBS (delivered unilaterally to the left DLPFC or bilaterally to the DLPFC for a total of 600 pulses per session; duration 3 minutes and 9 seconds), there was increased cortical excitability in the right temporoparietal region and an increase in EEG broadband power, likely indicative of reduced cortical excitability in the PFC region.
In populations where there is cortical hyperexcitability, such as in ASD and MDD, aTBS may exert a normalizing effect by inhibiting excessive activity in the PFC. However, the literature suggests that the effects of TMS on brain circuitry can be complex and variable, with different studies reporting conflicting results. We hypothesize that, in the ASD cohort, aTBS may be particularly effective in modulating the hyperexcitable brain region, leading to improved outcomes.
Our EEG findings indicated that aTBS can modulate the excitability of essential brain regions in depression. Cortical inhibition in the PFC and excitability in the temporoparietal region may help improve attentional control and reduce rumination, which are common symptoms of depression. ATBS can help restore normal brain function and improve depressive symptoms by modulating these cortical-subcortical loops. Our EEG findings provide evidence of the neural mechanisms underlying the therapeutic effects of TMS in depression. To the best of our knowledge, this is the first study to report these findings.
In our study, we observed a significant improvement in NIH-CT fluid cognition scores after three sessions of aTBS to the DLPFC, either unilaterally or bilaterally. The relationship between prefrontal activity and cognitive processes appears to adhere to an inverted-U model, in which both hypo- and hyperactivity can negatively impact performance (Floresco, 2013; Cools and D’Esposito, 2011). Hyperactivation and increased frontal coupling are associated with poorer cognitive flexibility (Armbruster et al., 2012). Individuals with ASD also demonstrate prefrontal overactivity associated with EF tasks (Sanders et al., 2008; Goldberg et al., 2011; Leisman et al., 2023). Interestingly, we also found a significant correlation between improved fluid cognition scores at week 4 and a reduction in depressive symptoms at week 12. This highlights the critical issue that changes in EF and fluid cognition could serve as valuable biomarkers for identifying PFC targets in ASD.
Because this study was conducted in youth with ASD and comorbid depression, the relationship between cognitive improvement and alleviation of depression remains unclear. Even if improvements in fluid cognition could be secondary to improvements in depression, there were several compelling factors that prompted us to further investigate this effect: 1) the selective enhancement of fluid cognition, 2) the robustness of the effect size, 3) the associations between changes in activity in brain regions associated with EF, such as the DLPFC and right temporoparietal region (Tei et al., 2017; Pedapati et al., 2019), and improvements in cognitive flexibility scores; and 4) minimal practice effects of the NIH-CT (Weintraub et al., 2014). Several studies have reported that individuals with ASD exhibit decreased activity in the frontal-parietal networks and increased activity in the temporal and occipital networks during fluid reasoning tasks (Simard et al., 2015; Soulières et al., 2009). Our findings show that TMS modulation of the DLPFC results in reduced activity in the PFC, which leads to excessive top–down regulation of the temporoparietal regions, improving cognitive flexibility and fluid cognition scores.
Cortical excitability and EF changes in ASD
There is consistent evidence that individuals with ASD have altered cortical excitability patterns that are often increased, resulting in an overactive response to sensory stimuli (Rubenstein and Merzenich, 2003). As such, the relationship between cortical excitability and EF deficits in ASD is an important topic of discussion. Just et al. found that hyperexcitability in ASD disrupts the networks responsible for EF, leading to delayed cognitive control and information processing (Just et al., 2012; Just et al., 2014).
Several mechanisms have been explored to explain the relationship between changes in cortical excitability and EF deficits. One possibility is that hyperexcitability in ASD leads to an overactive DMN, which interferes with the network responsible for EF (Buckner et al., 2008). The DMN is a set of brain regions that are deactivated during goal-directed tasks. Thus, when overactive in ASD, it results in difficulties in performing tasks often seen as delayed EF and cognitive inflexibility.
In our EEG findings, there was a significant reduction in broadband power in the frontal region, indicative of a decrease in cortical excitability, and associated with better performance in EF tasks. Another explanation is that cortical excitability in ASD affects the development of EF networks during critical years of brain development. Research has investigated the relationship between EF and PFC development and found it to be closely tied during the maturation period (Miller and Cohen, 2001). As such, in ASD, hyperexcitability can affect the PFC and result in the disruption of EF development. This mechanism is often seen in other pathologies, such as attention deficit hyperactivity disorder.
Attention-deficit/hyperactivity disorder (ADHD) comorbidity was high in our ASD cohort, with 80% prevalence in the unilateral group and 100% in the bilateral group. This aligns with established literature showing ADHD as a frequent comorbid condition in ASD and comorbidity rates range from 50% to 70% (Hours et al., 2022; Mansour et al., 2017). Several studies have investigated the efficacy of repetitive TMS (rTMS) in improving cognitive functioning and the DLPFC is often targeted in these ADHD studies. A recent systematic review on TMS in ADHD found that decrease excitability in the left DLPFC can improve ADHD symptoms, which is consistent with what we found in our ASD cohort (Salehinejad et al., 2020). Our current findings indicate that aTBS can modulate cognitive flexibility by targeting hyperexcitability in the PFC particularly in a cohort of individuals with ASD and ADHD.
We have previously shown the differences in intracortical facilitation in the primary motor cortex in ASD and ADHD (Pedapati et al., 2019). This along with our current findings lay the groundwork for future research into the neural mechanisms underlying ASD and informing the development of novel therapeutic approaches. To our knowledge, this is the first study to examine this effect in a cohort of ASD individuals with high ADHD comorbidity. However, a larger randomized trial is necessary to further investigate and confirm these results in these specific ASD and ADHD subgroups.
Improvements in fluid cognition in ASD
We found improvements in the subtest for cognitive flexibility using the NIHCT, emphasizing Fluid Cognition. Solomon et al. used the NIH toolbox to examine performance differences in cognitive domains across ASD patients (n = 66) and controls (n = 66) between the ages of 12–22. Across all age groups, individuals with ASD demonstrated poorer performance in lower Fluid Cognition Composite scores than controls (Solomon et al., 2021).
Notably, Solomon et al. found that three of five subtests (DCCS, Flanker, Pattern Comparison Processing Speed) accounted for lower fluid cognition in ASD, with the largest difference attributed specifically to cognitive flexibility (DCCS). In a recent systematic review of controlled TMS trials, only a small pooled effect size (ES; n = 873; Hedges’ g = 0.17) on working memory performance was found (Begemann et al., 2020). The limited understanding of circuit mechanisms, patient selection, and stimulation parameters highlights the early stages of this field. In contrast, our study focused on using TMS as a probe to establish biomarkers and causal links between brain activity, cognition, and behavior (Bergmann and Hartwigsen, 2021; Silvanto and Pascual-Leone, 2012).
Limitations
Although this study provides valuable insights into the effects of TMS on brain activity in individuals with ASD, there are several limitations to consider when interpreting the results. The small sample size (n = 9) limited the sensitivity of the study. According to Friston (2012) Appendix 1, the minimum effect size in Cohen’s d required to reach p = 0.05 with n = 9 is d = 0.62, which is the “medium” effect size according to Cohen’s definition (Friston). Therefore, the current results may miss differences in small (d = 0.25) or trivial (d = 0.125) effect sizes. However, the small and trivial effect sizes improve binomial classification from 50% to 52.5% and 55% and improves population prevalence from 9% to 1% and 6%, respectively. For an exploratory study, the goal is to detect medium and large effects, for which missing the small and trivial effects should not hinder. We concur with Friston (2012) that significant results from small samples should be taken more seriously than the equivalent results in oversized studies (Tzourio-Mazoyer et al., 2002; Friston, 2012). We did not apply multiple comparison corrections for the multiple p-values partly because this is an exploratory study but also because significant results, we observed, did not tolerate the correction.
The open-label design of the study may have introduced bias as both participants and researchers were aware of the treatment being administered. The use of EEG as the primary outcome measure also has limitations as it may not provide a complete picture of brain activity. Specifically, EEG may not be able to detect activity in deeper brain regions, and its spatial resolution may be limited. Furthermore, EEG data may be susceptible to artifacts and noise, which may affect the accuracy of the results. Our future direction is to run a randomized, sham-controlled, double-blind study with a large sample size, so we will test our hypothesized circuit in ASD as well as assess changes in fluid cognition over time.
Finally, while the NIH toolbox is a well-validated tool, there is still the possibility of practice effects with repeated administrations and familiarity with tasks. This is a limitation of our small sample size, as it can be difficult to differentiate if performance changes are due to intervention or practice effects.
Conclusion
TMS offers a safe and time-effective approach for understanding the mechanisms of treatment response and cognitive flexibility in patients with ASD. TMS can improve cognitive flexibility in ASD by targeting the cortical excitability. This leads to improvements in executive functioning and depressive symptoms in patients with ASD. Our study highlights the potential of TMS to address EF deficits in patients with ASD, offering novel insights into therapeutic strategies that could significantly improve cognitive outcomes in this population. Future randomized controlled clinical studies are needed to help establish the therapeutic potential of TMS to provide a mechanistic understanding of cortical–subcortical loops in individuals with ASD with and without comorbid depression. These studies should focus on enhancing real-world outcomes. TMS offers a safe and time-effective approach for determining target engagement and mechanistic properties (Rahmatullah et al., 2023; Hong et al., 2019; Schmitt et al., 2022; Takarae et al., 2024; Pedapati et al., 2019).
Footnotes
Acknowledgments
We would like to thank the Cincinnati Children’s Medical Center and the University of Cincinnati for providing us with the resources and support needed to conduct this study. We are grateful to our research team, including students and clinical research coordinators, for their contributions to the study.
Authors’ Contributions
R.E.(lead): Writing (original draft and review), data curation, data analysis, and project administration period. E.J.B.(lead): Writing (original draft and review), data curation, data analysis, and project administration period. E.V.P.(lead): Conceptualization, investigation, data analysis, writing (original draft and review), project administration, and article review. D.L.G.(equal): Conceptualized, investigated, and reviewed the article. S.W.W.(equal): Conceptualized, investigated, and reviewed the article. M.M.(equal): Statistical analysis and article review. T.L.(supporting): Article review and project administration. Y.L.: article review and project administration. P.S.H.(supporting): Statistical analysis and article review. C.A.E.(supporting): Conceptualization, investigation, and article review. G.W.(supporting): Article review and project administration.
Disclosures
We confirm that all authors have reviewed and approved the article, and that there are no conflicts of interest to disclose.
Supplementary Material
Supplementary Figure S1
Supplementary Data S1
References
Supplementary Material
Please find the following supplemental material available below.
For Open Access articles published under a Creative Commons License, all supplemental material carries the same license as the article it is associated with.
For non-Open Access articles published, all supplemental material carries a non-exclusive license, and permission requests for re-use of supplemental material or any part of supplemental material shall be sent directly to the copyright owner as specified in the copyright notice associated with the article.