
Abstract
Erythropoietin (EPO) has been used to correct cancer-related anemia and to improve tumor hypoxia, which both adversely affect the clinical condition of cancer patients and response to radiotherapy. Data available on the effects of EPO treatment in cancer are, however, conflicting. Several clinical studies investigating the influence of EPO treatment have given contradictory results as to whether or not this treatment positively influences survival. In light of these conflicting results, we studied the effects of EPO treatment either alone or in combination with radiotherapy on tumor oxygenation and on the expression pattern of several proteins related to tumor metabolism, survival, and spread in a rat colorectal cancer model. We found a statistically significant upregulation of hexokinase I, N-cadherin, and glucose transporter 3 when EPO treatment was combined with radiotherapy. Because these three proteins have distinct functions in protecting the cell in compromised conditions, these results indicate a detrimental role for the combination of EPO treatment and radiotherapy through the stimulation of tumor-cell metabolism, inhibition of apoptosis, and stimulation of tumor spread and seem to indicate that recombinant human EPO treatment negatively modulates radiotherapy efficacy.
Introduction
Anemia adversely affects the clinical condition of cancer patients and contributes to the development of tumor hypoxia, which, in turn, adversely affects response to radiotherapy (RT). Since erythropoietin (EPO) is a well-recognized, effective treatment for anemia, this pleiotropic cytokine, which is involved in the proliferation and differentiation of the erythroid lineage, has been used to correct cancer-related anemia and improve tumor hypoxia. 1 –7 Data available on this subject are, however, conflicting. On the one hand, in various clinical trials conducted in diverse groups of cancer patients, it was found that treatment with recombinant human EPO (rhEPO) significantly increased the quality of life and survival rate of cancer patients, respectively, by increasing their hemoglobin levels and by reducing the need for potentially risky red blood cell transfusions. 8,9 However, a recent meta-analysis of 57 such trials performed, including 9353 patients, suggested that treatment of anemia with rhEPO may have no impact on overall survival in patients with cancer. 10 In addition, recent experimental findings have advocated a role for EPO as a strong antiapoptotic agent in multiple nonerythroid tissues but also in neoplastic tissues. Also, the discovery of EPO receptors (EPO-R) on malignant cells suggests that EPO may act as a tumor growth factor. 1 –3 Finally, contrary to initial findings, more recently, a number of randomized, clinical trials reported that rhEPO might actually adversely affect cancer survival rates of cancer patients treated by means of RT, mainly due to tumor progression. 11,12 While strongly criticized for methodologic pitfalls, these studies led the U.S. Food and Drug Administration to force a “black label” warning concerning the use of rhEPO in cancer patients.
In light of these conflicting results, the influence of rhEPO, either alone or in combination with RT on tumor oxygenation, was studied in a rat colorectal cancer model given both treatment options that may profoundly influence tumor oxygenation. Subsequently, the influence of rhEPO, either alone or in combination with radiotherapy on the expression pattern of several proteins related to tumour metabolism, survival, and spread, was studied in the same model.
Materials and Methods
Animal and tumor model
Male Wag/Rij rats were bought from Harlan (Horst, The Netherlands). The CC531 cell line is a 1,2-dimethylhydrazine-induced, moderately differentiated, and weakly immunogenic colon adenocarcinoma, syngeneic with WAG/Rij rats. This cell line is well studied and has been proven to provide a tumor-host model similar to human colorectal carcinogenesis. 13 Cells were grown in plastic culture flasks in RPMI 1640 medium, buffered with HEPES (20 mM) (Invitrogen Corporation, Gibco, Ghent, Belgium), and additionally supplemented with 10% fetal calf serum, 4 mM of L-glutamine, 50 U/mL of penicillin, and 50 μg/mL of streptomycin at 37°C in a humidified atmosphere with 5% CO2 in air. The cells were transferred at 95% confluency. Two (2) million cells suspended in 0.2 mL of saline were injected subcutaneously (s.c.) in the proximal hind leg. Tumors reached a size of 0.5–1 cm after a period of 4 weeks. All the experiments with rats were approved by the institutional ethical committee, and animal handling was done according to institutional guidelines for animal care.
Experimental therapy
Animals were randomly divided into two groups, in which some of the animals received RT: a control (crtl) group (n = 20), in which 11 animals received RT, and a rhEPO group (n = 26) receiving rhEPO, in which 16 animals received RT. As a result, four different experimental groups were created: ctrl (n = 9), crtl+RT (n = 11), rhEPO (n = 10), and rhEPO+RT (n = 16). rhEPO (Eprex; Janssen Cilag, Beerse, Belgium) was administered at a dose of 3 × 0.1 mL (286 IU) s.c. per week. The dosage was based on a dose-finding study, during which 5 or 8 rhEPO administrations weekly resulted in an excessive hematocrit rise and important mortality (data not shown). Recombinant human EPO has been shown to bind to the rodent EPO receptor. 14 Rats were longitudinally studied during 3 weeks, using the following time frame: start of rhEPO administration (day 1); first oxygenation measurement (day 8); fractionated RT 5 × 5 Gy (days 13–17); and second oxygenation measurement and killing by anesthesia overdose and excision of tumours for histology (all on day 22).
RT
Rats were not sedated and the tumor-bearing hind leg was immobilized by using a purpose-built Plexiglass holder, as described previously. 15,16 Briefly, rats were placed in the holder in the prone position. The hind legs were pulled through an opening in the holder and immobilized. Before each fraction, a radiation field was simulated, encompassing the tumor with a margin of 1.5 cm. Photon irradiation was performed with a 5-MV linear accelerator (Elekta, Crawley, UK). Five fractions of 5 Gy (total dose, 25 Gy) were delivered on 5 consecutive days. As the tumors were inoculated s.c., they were covered with tissue-equivalent silicone bolus of 1 cm to prevent the build-up effect under the skin. One single direct field at a fixed source-skin distance of 100 cm was used. The dose was calculated to the midpoint of the tumors, according to their volume in each individual animal, as obtained during simulation.
Tissue pO2-measurements
Tissue oxygenation was measured with a fiber-optic probe, based on fluorescence quenching (OxyLite; Oxford Optronix, Oxford, UK). 17,18 A precalibrated fiber-optic probe was inserted 5 mm deep into the tumor, using a Seldinger technique; the probe was then withdrawn in 40 steps of 100 μm each over a total distance of 4 mm, using a micromanipulator (model MN151; Narishige International, Ltd., London, UK). After each micromanipulator movement, measurements were started as soon as a stable reading was obtained. Tissue pO2 was sampled every 2 second. Tissue pO2 was expressed in mmHg. In order to avoid unnecessary animal procedures, oxygenation measurements were only performed in the animals that received RT, 5 days before and 5 days after the completion of RT. This was done because oxygenation measurements of animals of the ctrl+RT group before RT were identical to oxygenation measurements of animals of the ctrl group and oxygenation measurements of animals of the rhEPO+RT group before RT were identical to oxygenation measurements of animals of the rhEPO group. Thus, oxygenation measurements were performed in the ctrl+RT group (n = 11) and in the rhEPO+RT group (n = 16).
Immunohistochemistry
Formalin-fixed, paraffin-embedded tissue samples were used for immunohistochemistry with the appropriate antibodies. Sections 4 μm thick were mounted on SuperFrost® microscope slides (Menzel-Glaser, Braunschweig, Germany), which were deparaffinized in xylene and rehydrated in a downgraded series of ethanol. After flushing in water, heat-induced antigen retrieval was performed for 20 minutes with the appropriate buffer (EDTA, pH = 8.0 [ethylene diamine tetraacetic acid] or CIT, pH = 6.0 [citrate]), after which the tissue slides were cooled down for 20 minutes and then flushed in water for 10 minutes. The endogenous peroxidase activity was blocked for 5 minutes with 0.3% hydrogen peroxide (DAKO, Glostrup, Denmark) on each tissue slide. Primary antibodies were than incubated for 1 hour at room temperature; the appropriate antibodies with their corresponding dilution factors (primary antibody diluted in 1% bovine serum albumin/phosphate-buffered saline; BSA/PBS) are indicated in Table 1. After washing, the tissue sections were incubated for 30 minutes at room temperature with a labeled polymer-HRP (horseradish peroxidase antirabbit secondary antibody (DAKO). The color reaction was developed by using the chromogen 3,3-diaminobenzidine+ (DAB) (DAKO) for 10 minutes. After washing, the tissue sections were counterstained with Mayer's hematoxylin.
For each antibody, the correct positive control tissues were used to optimize the immunostainings.
EDTA, ethylenediaminetetraacetic acid; CIT, citrate.
Cambridge, UK.
Heidelberg, Germany.
San Antonio, TX.
Concord, MA.
PBS with 1% BSA, instead of the primary antibody, was used as the negative control on each slide in order to exclude false-positive responses from nonspecific binding of the secondary antibody. Prior to staining the specimens, an isotype control was performed to estimate the nonspecific binding of target primary antibodies to cell-surface antigens. Nonspecific binding is due to Fc-receptor binding or other protein-protein interactions.
Immunohistochemical analysis
The intensity and amount of positive tumor cells in the immunoreaction were scored independently by two experienced observers, blinded to the clinical results. The percentage of tumor cells that were positive on the immunoreaction were scored as follows: 0% (score 0), 0%–20% (score 1), 20%–40% (score 2), 40%–60% (score 3), 60%–80% (score 4), and 80%–100% (score 5). Intensities of staining were categorized as absent (score 0), faint (score 1), average (score 2), or strong (score 3). Positive tumor cells were counted per high-power field (final magnification, 400X). An estimation of intensity and % positive tumor cells was made after counting 10 high-power fields. A final histologic score was calculated as following: Hscore = [(a1 × i1) + (a2 × i2)]/2, where i = the score of intensity, a = the score of amount tumor cells that stained positive, and 1 and 2 refer to the scores of the two observers.
Statistical analysis
SPPS for Windows, version 15.0 (SPSS, Inc., Chicago, IL) was used for statistical analysis. Differences between two groups of continuous data were analyzed with the Student's t-test (two-tailed, paired, or unpaired, as appropriate). To assess differences between the four different experimental groups, one-way analysis of variance (ANOVA) was performed with post-hoc Fisher's protected least significant differences (FLSD) on each variable. A p-value of ≤0.05 was considered significant.
Results
Effects of rhEPO treatment and RT on tumor pO2
Mean pO2 values in the tumor before and after RT in both groups are shown in Figure 1. Both before (p = 0.007) and after (p = 0.015) RT, pO2 values were significantly higher in the rhEPO-treated rats. In the control group, no significant difference in tumor oxygenation was observed after RT (p = 0.201). In the rhEPO group, on the contrary, RT induced a reoxygenation (p = 0.019).
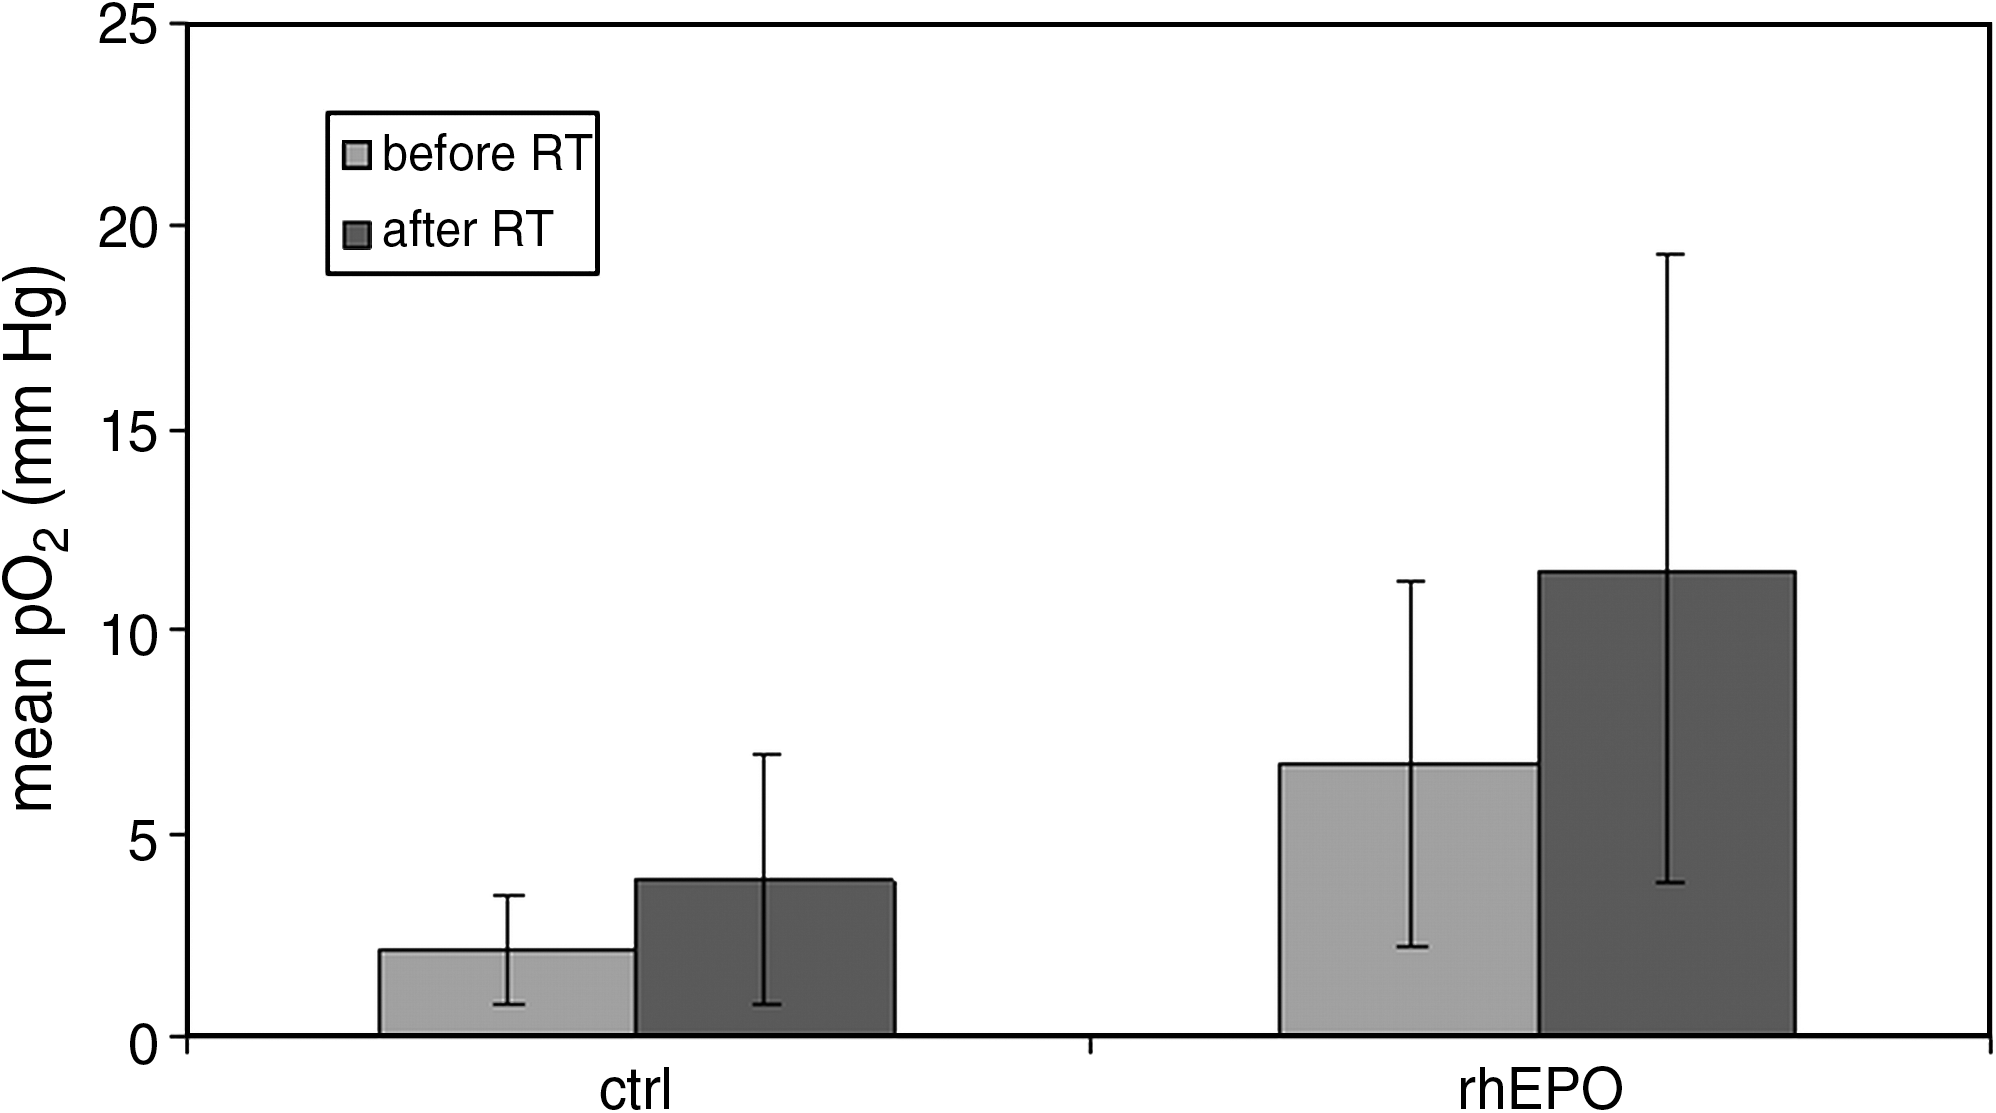
Mean pO2 values in the control group before (2.1; SD 1.3) and after (3.9; SD 3.0) RT. Mean pO2 values in the rhEPO group before (6.7; SD 4.5) and after (11.5; SD 7.7) RT. Both before (p = 0.007; Student's t-test) and after (p = 0.015; Student's t-test) RT, pO2 values were significantly higher in the rhEPO-treated rats. In the rhEPO group, RT induced a reoxygenation (p = 0.019; Student's t-test). SD, standard deviation; RT, radiotherapy; rhEPO, recombinant human erythropoietin.
Effects of rhEPO treatment on hematocrit
Data in this study were acquired from material that was part of a larger set of data from another study. 38 In this study, hematocrit values were tested before starting the experiment and on day 8. In rhEPO-treated rats, mean hematocrit showed a 25% increase from 50.7 ± 0.4% before therapy to 62.6 ± 0.4% on day 8 (p < 0.001). In the control group, hematocrit values remained unchanged.
Effects of rhEPO treatment and RT on expression of GLUT1, GLUT3, GLUT4, GLUT8, GLUT9, and SGLT1
Mean Hscores for GLUT1 expression for the different experimental groups were, respectively: ctrl: 7.9 [range, 4.0–12.0; standard deviation (SD), 2.4], rhEPO: 11.1 (range, 1.5–15; SD, 4.9), ctrl+RT: 9.0 (range, 4.0–13.5; SD, 3.1), rhEPO+RT: 9.0 (range, 2.5–13.5; SD, 3.0). Mean Hscores for GLUT3 expression for the different experimental groups were, respectively: ctrl: 5.6 (range, 1.5–9.0; SD 3.2); rhEPO: 4.7 (range, 3.0–9.0; SD 1.9); ctrl+RT: 5.9 (range, 1.5–13.5; SD 3.5); and rhEPO+RT: 7.9 (range, 2.5–12.0; SD 2.9) (Fig. 2). Mean Hscores for GLUT4 expression for the different experimental groups were, respectively: ctrl: 3.9 (range, 1.0–9.0; SD 2.7); rhEPO: 5.7 (1.5–10.0; SD 2.9); ctrl+RT: 4.9 (range, 2.5–8.0; SD 2.3); and rhEPO+RT: 5.2 (range, 2.5–10.0; SD 2.5). Mean Hscores for GLUT8 expression for the different experimental groups were, respectively: ctrl: 7.3 (range, 1.0–12.0; SD 3.1); rhEPO: 5.8 (range, 1.5–12.0; SD 3.3); ctrl+RT: 7.7 (range, 3.0–15.0; SD 4.1); and rhEPO+RT: 7.7 (1.5–15.0; SD 3.6). Mean Hscores for GLUT9 expression for the different experimental groups were, respectively: ctrl: 1.1 (range, 0.5–2.5; SD 0.7), rhEPO: 2.2 (range, 0.5–4.0; SD 1.1); ctrl+RT: 3.1 (range, 0.5–10.0; SD 3.5); and rhEPO+RT: 2.4 (range, 0.5–7.0; SD 1.8). Mean Hscores for SGLT1 expression for the different experimental groups were, respectively: ctrl: 12.3 (range, 3.5–15.0; SD 3.7); rhEPO: 10.1 (range, 0.5–15.0; SD 6.0); ctrl+RT: 9.3 (range, 0.0–15.0; SD 5.1); and rhEPO+RT: 11.9 (range, 0.5–15.0; SD 5.1). Immunostaining of GLUT1 was mainly membranous, and negative controls showed no staining. Immunostaining of GLUT3, GLUT4, GLUT8, GLUT9, and SGLT1 was cytoplasmic, and negative controls showed no staining.

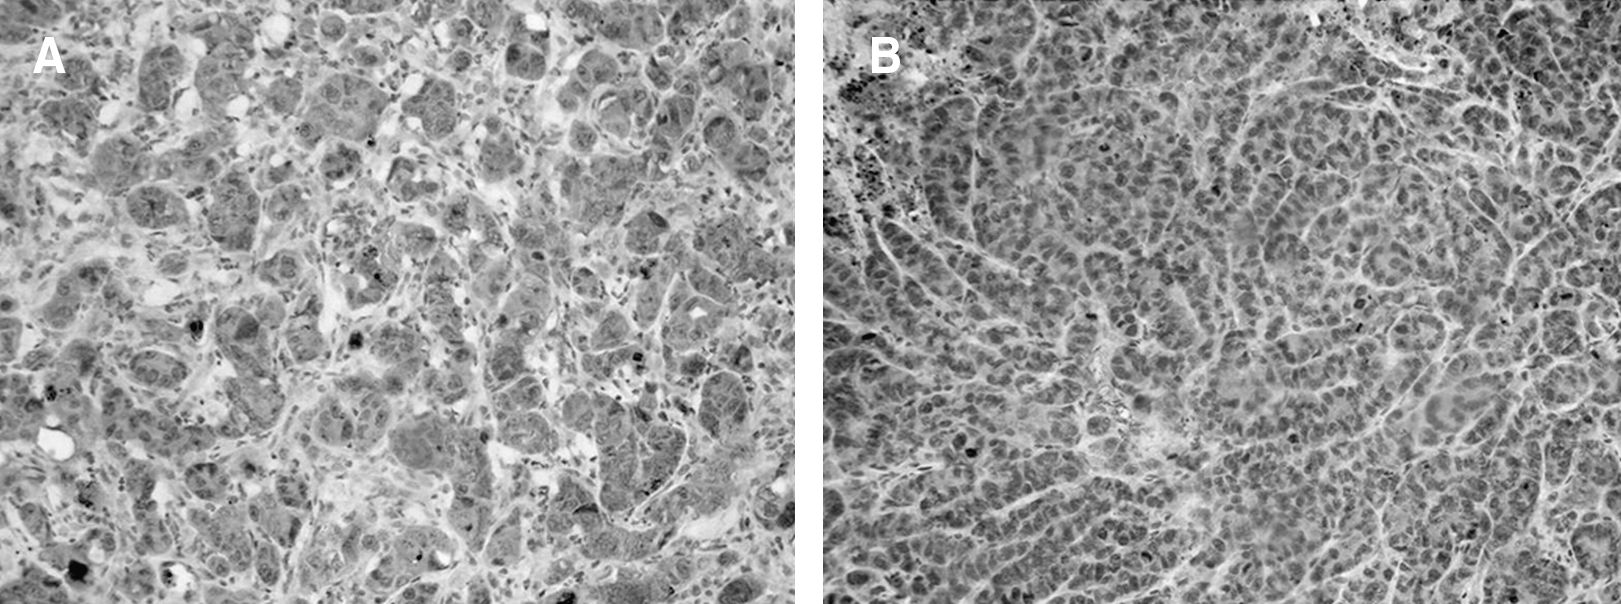
Mean Hscores for GLUT3 expression for the different experimental groups were, respectively: ctrl: 5.6 (range, 1.5–9.0; SD 3.2); rhEPO: 4.7 (range, 3.0–9.0; SD 1.9); ctrl+RT: 5.9 (range, 1.5–13.5; SD 3.5), rhEPO+RT: 7.9 (range, 2.5–12.0; SD 2.9). A significant increase in GLUT3 expression was observed in the rhEPO group upon RT treatment (p = 0.01). SD, standard deviation; rhEPO, recombinant human erythropoietin; RT, radiotherapy.
No significant differences were found between the different experimental groups in the expression of GLUT1 (p = 0.24; ANOVA), GLUT4 (p = 0.48; ANOVA), GLUT8 (p = 0.54; ANOVA), GLUT9 (p = 0.23; ANOVA), and SGLT1 (p = 0.44; ANOVA). Significant differences were found between the different experimental groups in the expression of GLUT3 (p = 0.05; ANOVA). While no significant differences were found when comparing GLUT3 expression between ctrl and rhEPO (p = 0.49), ctrl and ctrl+RT (p = 0.85), ctrl and rhEPO+RT (p = 0.07), rhEPO and ctrl+RT (p = 0.36), ctrl+RT and rhEPO+RT (p = 0.09), a significant difference was found between the rhEPO and the rhEPO+RT groups (p = 0.01). (Table 2; Figs. 2 and 3).

Immunohistochemical analysis of GLUT3 expression: An example comparing a sample with a high Hscore and a sample with a low Hscore. (
Significant differences were found between the different experimental groups in the expression of GLUT3, HKI and N-CAD. No significant differences were found between the different experimental groups in the expression of GLUT1 (p = 0.24; ANOVA), GLUT4 (p = 0.48; ANOVA), GLUT8 (p = 0.54; ANOVA), GLUT9 (p = 0.23; ANOVA), SGLT1 (p = 0.44; ANOVA), HKII (p = 0.45; ANOVA), and HKIII (p = 0.49; ANOVA). A p-value ≤0.05 was considered significant.
ANOVA, analysis of variance; CAD, cadherin.
Effects of rhEPO treatment and RT on expression of HKI, HKII, and HKIII
Mean Hscores for HKI expression for the different experimental groups were, respectively: ctrl: 8.6 (range, 3.5–10.0; SD 2.0); rhEPO: 8.0 (range, 1.0–13.5; SD 3.3); ctrl+RT: 10.7 (range, 7.0–15.0; SD 3.2); and rhEPO+RT: 11.7 (range, 8.0–15.0; SD 2.9) (Fig. 4). Mean Hscores for HKII expression for the different experimental groups were, respectively: ctrl: 7.7 (range, 2.5–13.5; SD 3.4); rhEPO: 7.1 (range, 0.0–10.0; SD 3.2), ctrl+RT: 7.5 (range, 0.0–13.5; SD 3.5); and rhEPO+RT: 9.1 (range, 0.0–13.5; SD 3.3). Mean Hscores for HKIII expression for the different experimental groups were, respectively: ctrl: 0.9 (range, 0.0–2.0; SD 0.6); rhEPO: 1.3 (range, 0.0–2.5; SD 0.8); ctrl+RT: 0.9 (range, 0.0–2.5; SD 0.7); and rhEPO+RT: 1.0 (range, 0.0–2.5; SD 0.6). Immunostaining of the hexokinases was cytoplasmatic, and negative controls showed no staining.

Mean Hscores for HKI expression for the different experimental groups were, respectively: ctrl: 8.6 (range, 3.5–10.0; SD 2.0); rhEPO: 8.0 (range, 1.0–13.5; SD 3.3); ctrl+RT: 10.7 (range, 7.0–15.0; SD 3.2); and rhEPO+RT: 11.7 (range, 8.0–15.0; SD 2.9). A significant increase in HKI expression was observed in the rhEPO group upon RT treatment (p = 0.003). Additionally, HKI expression in the rhEPO group that received RT was significantly higher than in the control group that did not receive RT (p = 0.02) and HKI expression in the control group that received RT was significantly higher than in the rhEPO group that did not receive RT (p = 0.03). SD, standard deviation; rhEPO, recombinant human erythropoietin; RT, radiotherapy.
No significant differences were found between the different experimental groups in the expression of HKII (p = 0.45; ANOVA) and HKIII (p = 0.49; ANOVA). Significant differences were found between the different experimental groups in the expression of HKI (p = 0.01; ANOVA). While no significant differences were found when comparing HKI expression between ctrl and rhEPO (p = 0.62), ctrl and ctrl+RT (p = 0.11), ctrl+RT and rhEPO+RT (p = 0.42), a significant difference was found between the ctrl and the rhEPO+RT groups (p = 0.02), the rhEPO and the ctrl+RT groups (p = 0.03), and the rhEPO and the rhEPO+RT groups (p = 0.003) (Table 2; Figs. 4 and 5).
Immunohistochemical analysis of HKI expression: An example comparing a sample with a high Hscore and a sample with a low Hscore. (
Effects of rhEPO treatment and RT on expression of N-cadherin
Mean Hscores for N-cadherin (N-CAD) expression for the different experimental groups were, respectively: ctrl: 6.6 (range, 3.5–10.0; SD 2.4); rhEPO: 6.8 (range, 3.5–10.0; SD 2.6); ctrl+RT: 9.6 (range, 3.5–15.0; SD 4.5); and rhEPO+RT: 9.9 (range, 1.5–15.0; SD 3.9) (Fig. 6). Immunostaining of N-CAD was mainly cytoplasmatic, and negative controls showed no staining.
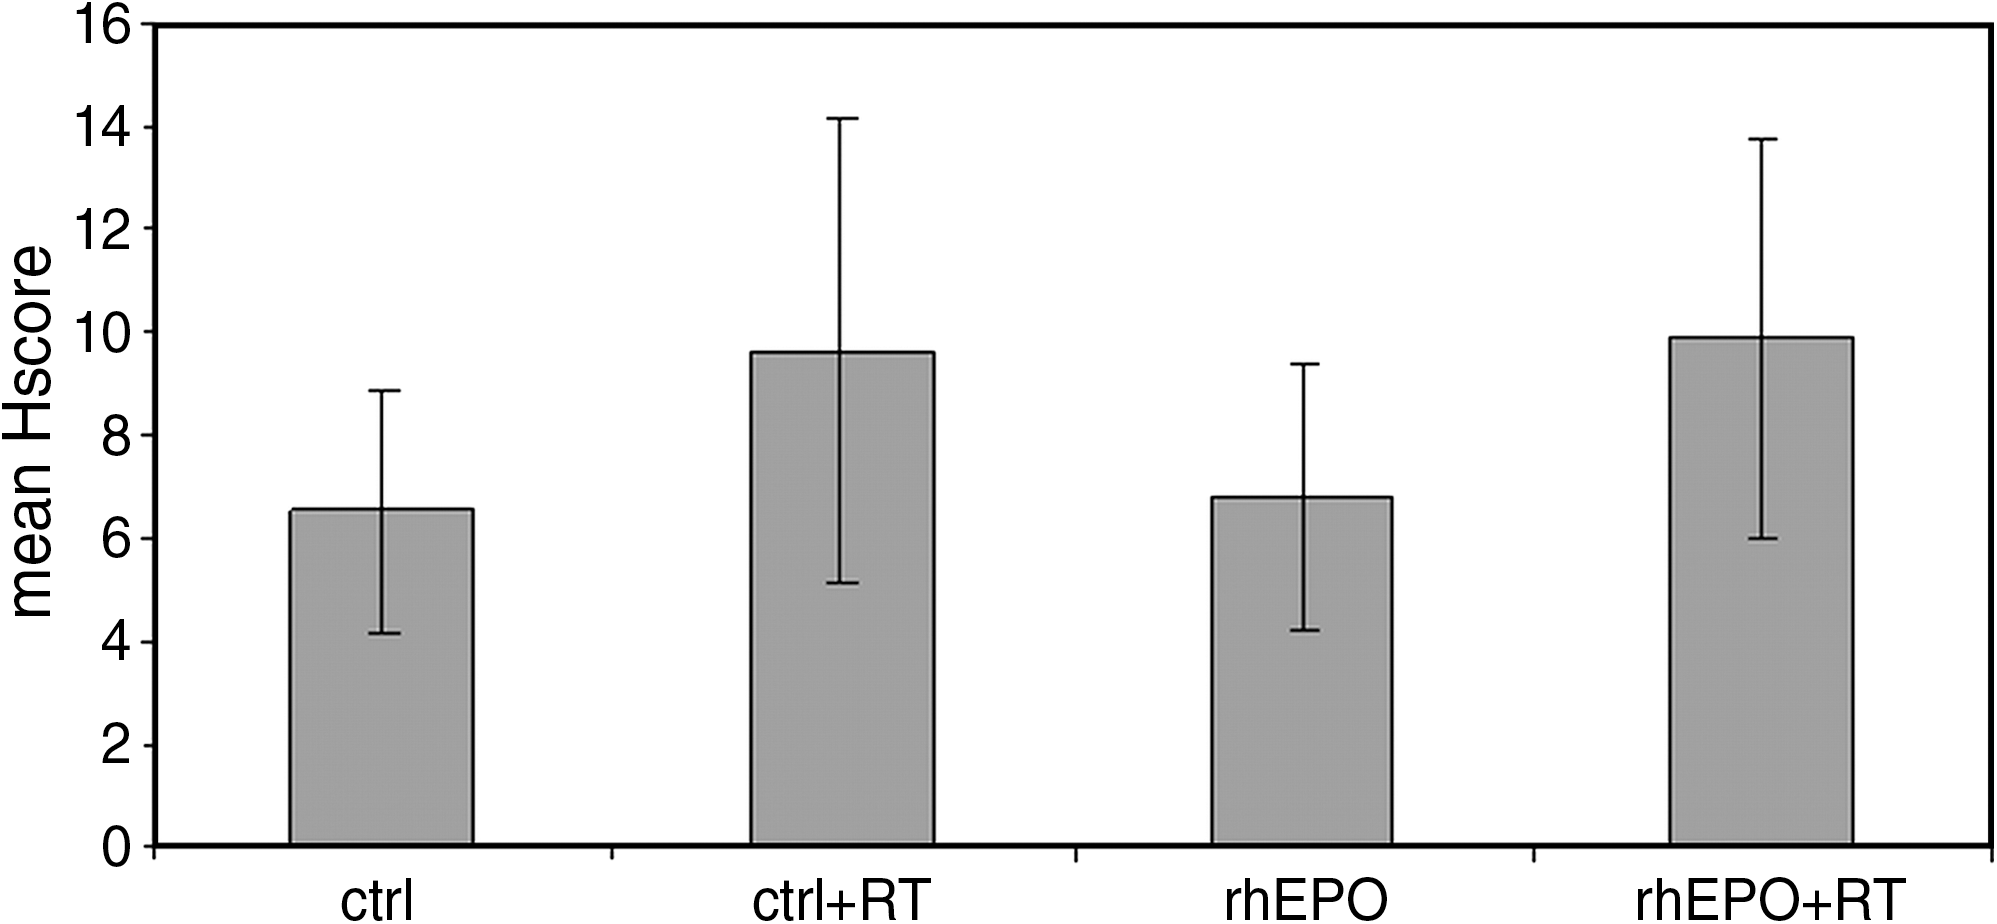
Mean Hscores for N-cadherin (CAD) expression for the different experimental groups was, respectively: ctrl: 6.6 (range, 3.5–10.0; SD 2.4); rhEPO: 6.8 (range, 3.5–10.0; SD 2.6); ctrl+RT: 9.6 (range, 3.5–15.0; SD 4.5); and rhEPO+RT: 9.9 (range, 1.5–15.0; SD 3.9). A significant increase in N-CAD expression was observed in the rhEPO group upon RT treatment (p = 0.04). Additionally, N-CAD expression in the rhEPO group that received RT was significantly higher than in the control group that did not receive RT (p = 0.03). SD, standard deviation; rhEPO, recombinant human erythropoietin; RT, radiotherapy.
Significant differences were found between the different experimental groups in the expression of N-CAD (p = 0.05; ANOVA). While no significant differences were found when comparing N-CAD expression between ctrl and rhEPO (p = 0.88), ctrl and ctrl+RT (p = 0.06), rhEPO and ctrl+RT (p = 0.08), ctrl+RT and rhEPO+RT (p = 0.85), a significant difference was found between the ctrl and the rhEPO+RT groups (p = 0.03), the rhEPO group, and the rhEPO+RT group (p = 0.04). (Table 2; Figs. 6 and 7).
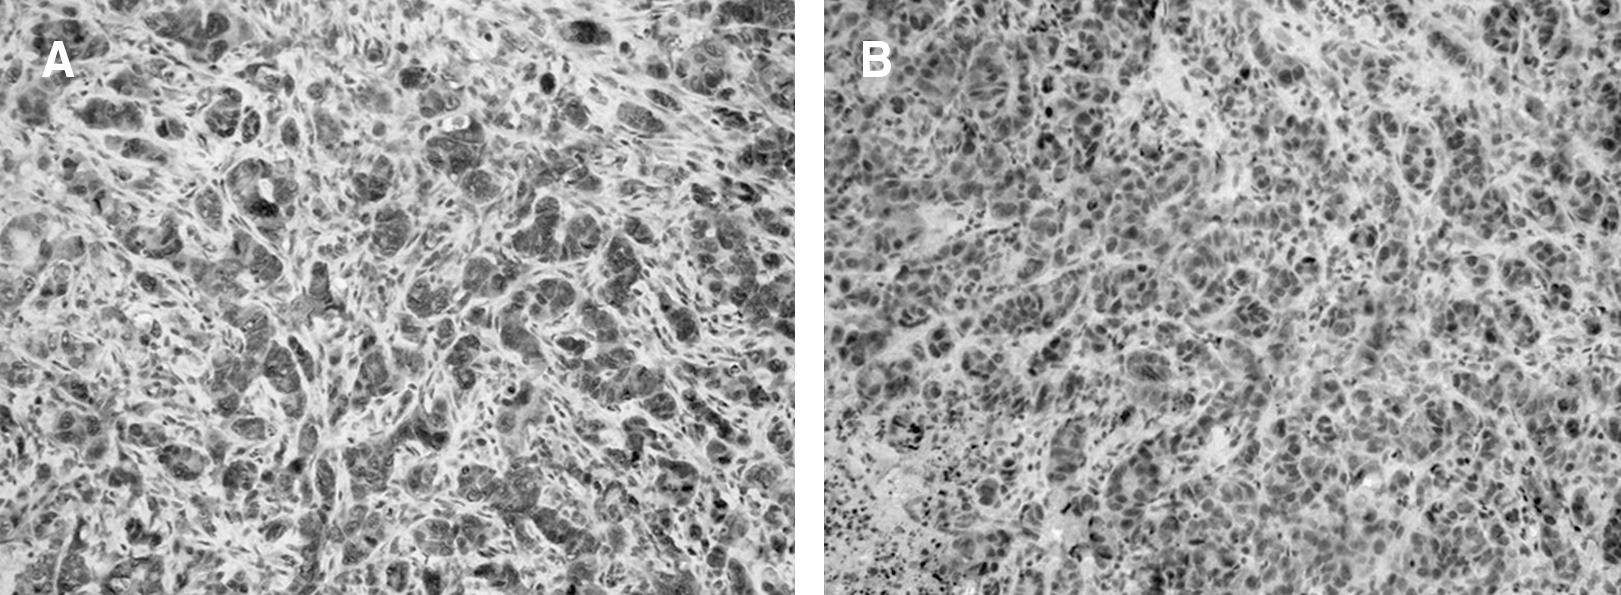
Immunohistochemical analysis of N-cadherin expression: An example comparing a sample with a high Hscore and a sample with a low Hscore. (
Discussion
The aim of this study was to investigate the expression of several proteins related to tumor metabolism and invasion in a rat colorectal cancer model receiving RT in combination with rhEPO treatment. This was done to assess a possible influence of EPO and RT on tumor-cell metabolism and invasion either through a direct effect on the tumor cells or by an indirect effect by changes in the oxygenation status of the tumor. A statistically significant upregulation of hexokinase I (HKI), N-CAD, and glucose transporter 3 (GLUT3) was found when rhEPO treatment was combined with RT.
Our results, first of all, indicate that rhEPO treatment increases tumor oxygenation. To date, the mechanisms by which rhEPO improves tumor oxygenation remain unclear. Besides its effect on hemoglobin levels, several direct effects of rhEPO have been described by which rhEPO can influence tumor oxygenation. Blackwell et al. found that systemic rhEPO administration to nonanemic rats bearing mammary adenocarcinoma flank tumors improved tumor oxygenation independent of the effects on hemoglobin levels. 17 Tovari et al. found that rhEPO had profound effects on tumoral blood vessels in human epidermoid and colorectal cancer xenograft models through changes in vascular endothelial growth factor (VEGF) expression and microvessel morphology. 19 Although there are several reports that RT alone causes an increase in tumor oxygenation, our results did not indicate this. 20,21 We did find, however, that RT causes an increase in tumor oxygenation when rhEPO is administered, possibly indicating a synergistic effect of both treatments.
We further found a significant increase in GLUT3 glucose transporter expression in the rhEPO group upon RT treatment. Facilitative glucose transporters (GLUTs) mediate the transport of glucose and other monosaccharides across the plasma membrane of mammalian cells. The whole family of human GLUT proteins consists of 14 members with different substrate specificities, kinetic properties, and tissue expression profiles. GLUT3 is a high-affinity glucose transporter (K m = 10.6 mM) that is mainly expressed in the brain, where it mediates glucose transport into neurons. As GLUT3 is believed to operate more efficiently at lower substrate concentrations than other isoforms, it is expected to supplement GLUT1 in tissues with a high energy demand. 22 Besides glucose, GLUT3 also transports galactose, mannose, maltose, xylose, or dehydroascorbic acid. Upregulation of GLUT3 has frequently been described in human tumors, where it is believed to be involved in fulfilling the high-energy demand of the tumor. 23,24 Because of its high affinity for glucose and its ability to transport other energy substrates besides glucose, it is tempting to view an upregulation of GLUT3 as a stress reaction of the tumor cell in an effort to absorb as much energy from its environment as possible. As such, an upregulation of GLUT3 may be seen as a survival benefit, allowing the tumor cell to cope with its compromised situation more efficiently.
Our results also indicate a significant increase in HKI expression in the rhEPO group upon RT treatment. Additionally, HKI expression in the rhEPO group that received RT was significantly higher than in the control group that did not receive RT, and HK1 expression in the control group that received RT was significantly higher than in the rhEPO group that did not receive RT. HKI is a metabolic enzyme belonging to the family of the hexokinases, which comprises four members (HKI, HKII, HKIII, and HKIV or glucokinase). Hexokinases have a role in glucose metabolism, converting glucose to glucose-6-phosphate. Overexpression of HK is a common feature in cancer, as it allows the tumor cell to maintain a high rate of glycolysis by maintaining the downhill concentration gradient necessary to move glucose into the cell through glucose transporters. The overexpressed form of HK is preferentially bound to the outer mitochondrial membrane. This interaction markedly reduces the enzyme's sensitivity to product inhibition by glucose-6-phosphate, provides preferred access to mitochondrial-generated ATP, and protects against proteolytic degradation. 25 –27 In addition to their role in glucose metabolism by augmenting cellular energy supply and levels of glucose-6-phosphate, HKI and HKII are also believed to play an active role in regulating cell death. In vitro and in vivo studies have shown that HKI and HKII play a role in protecting against mitochondrial-regulated apoptosis through direct interaction with mitochondria and, more specifically, with the voltage-dependent anion channel (VDAC) through their N-terminal hydrophobic regions. A mechanism has been proposed in which binding of HK to VDAC induces channel closure, leading to the prevention of cytochrome c release, which represents the mitochondrial phase of apoptosis. 26,28 –30 In this respect, HKI overexpression in U-937 cells protected against apoptotic cell death induced by staurosporine, and HKI and II overexpression in HEK293 cells protected against apoptotic cell death induced by hydrogen peroxide. 28,31 Again, the increase in HKI expression upon treatment with rhEPO and RT suggests the activation of an antiapoptotic mechanism in the remaining tumor cells, allowing them to survive in compromised conditions.
Finally, our results indicate a significant increase in neural (N) cadherin expression in the rhEPO group upon RT treatment. Additionally, N-CAD expression in the rhEPO group that received RT was significantly higher than in the control group that did not receive RT. The cadherin family of adhesion molecules regulates cell-cell interactions during development and during normal tissue homeostasis. N-CAD is a cell-adhesion molecule belonging to the family of the cadherins that is normally found in fibroblasts and neural cells and has a role in tumor-cell invasion and metastasis. Metastasis is a complex multistep process involving a series of tumor-host interactions that finally result in the colonization of distant tissue. While E-CAD, which is responsible for maintaining interactions of epithelial cells, is frequently downregulated during tumor progression, N-CAD is frequently upregulated during tumor progression and increases the invasiveness of tumor cells. 32 This switch in cadherin expression, often referred to as the cadherin switch, can be the result of an epithelial to mesenchymal transformation (EMT) of tumor cells. EMT plays a critical role in the progression of tumors toward a more aggressive phenotype that is associated with increased motile and invasive capability. 33 A number of studies described the upregulation of N-CAD expression in several invasive tumor-cell lines and tumor tissues from different origins. 34 Additionally, its exogenous expression in tumor cells induces a scattered morphology and heightened motility, invasion, and metastasis. 35 –37 This N-CAD upregulation provides tumor cells with a way to permeate local and distant tissues and facilitate its survival by interacting with N-CAD-expressing host cells of the stroma or the endothelium through a homophillic interaction. 32,34 Therefore, the increase in N-CAD expression upon treatment with rhEPO and RT suggests that the remaining tumor cells are enhancing their metastatic capacities, enabling them to spread from their primary site to one or more metastatic sites. Upon visual confirmation of this changing phenotype, we observed a shift toward a poorly differentiated form with highly anaplastic cells and an increase in abnormal mitotic figures.
The effects of rhEPO treatment on response to RT, chemotherapy, or photodynamic therapy remain a matter of debate. Whereas some studies indicate that rhEPO treatment has beneficial effects on radiosensitivity 5 –7 and leads to a survival benefit, 8,9 other studies report on a diminished survival in the case of rhEPO treatment. 11,12 Although the latter studies were strongly criticized for study design, conduct, and post-trial analysis, there are, indeed, increasing reports on the modulation of the effects of RT by rhEPO treatment. The mechanism by which this occurs remains unclear. In a recent study by Ceelen et al., an attempt was made to clarify these mechanisms. It was concluded that rhEPO treatment resulted in spatially heterogeneous modulation of RT effects on tumor microvessels. Treatment with rhEPO prevented RT-induced changes in microvascular permeability and tumor vascular volume, accompanied by a larger microvessel diameter and altered spatial complexity. 38
Conclusions
A significant upregulation of HKI, N-CAD, and GLUT3 was observed after treatment with RT in combination with rhEPO treatment. These three proteins have distinct functions in protecting the cell in compromised conditions. As a consequence, these results seem to confirm the results of other groups, whereby rhEPO treatment seemed to modulate the effects of RT on the tumor. The mechanism by which this occurs remains largely unclear and needs further clarification.
Footnotes
Disclosure Statement
No competing financial interests exist.