
Abstract
Fibroblast growth factor 18 (FGF18) is one of the genes downstream of Wnt, one of the most important signaling pathways activated in colon cancer. An FGF18 promoter containing a single T-cell factor/lymphocyte enhancing factor 1 (TCF/LEF1) binding site was inserted upstream of a thymidine kinase (TK) suicide gene module, while a bacterial β-Gal (LacZ) element served as the reporter gene. Following transient transfection with pUCFGF18LacZ, β-Gal staining showed that 5% of SW480, 10% of HCT116, 0% of human umbilical vein endothelial cells (HUVECs) and 0% of normal colon cells (NCCs) had expressed LacZ. β-Gal enzyme-linked immunosorbent assay revealed that the ratio of pUCFGF18LacZ activity to that of positive control was 0.09 and 0.25 in SW480 and HCT116, respectively (significantly higher than mock plasmid), while there were no significant changes in the β-Gal expression in HUVEC and NCC cells transfected with pUCFGF18LacZ or mock plasmid. Following transfection with pUCFGF18TK and pUCCMVTK (positive control), cytotoxicity analysis of transfected cells showed that treatment with ganciclovir (GCV) significantly decreased SW480 and HCT116 cell survival at GCV concentrations above 20 μg/mL. An inverse correlation between GCV concentration and cell viability was evident in both colon cancer cell lines following transfection with these suicide plasmids. pUCFGF18TK and pUCCMVTK induced apoptosis after the administration of GCV in HCT116, but not in SW480, as demonstrated by M30 cytodeath antibody. This discrepancy may stem from differences in the mechanisms of TK/GCV-induced apoptosis in p53-proficient (HCT116) and -deficient (SW480) cells. The specific activity of the FGF18 promoter in HCT116 and SW480 may reflect the advantage of this promoter over artificial promoters containing artificial TCF/LEF binding sites.
Introduction
Colon cancer is the third and fourth most prevalent cancer among Iranian women and men, respectively, 1 whereas in the United States, it is rated the third most common cancer for both men and women. 2 Conventional therapies cannot fully eradicate cancerous cells, and therefore, gene therapy has attracted much attention in recent years. 3 Efficacy of chemotherapy in complete eradication of a few types of cancers, such as leukemia, has led to the hypothesis that all types of cancer can potentially be eradicated by higher doses of chemotherapy, 4 an assumption that is questionable given the side-effects associated with high-dose regimens of chemotherapeutic agents. In suicide gene therapy, a gene construct that encodes an enzyme is introduced to the target tissues. The enzyme converts a nontoxic prodrug to a toxic drug. Therefore, suicide gene therapy opens a new horizon for the local administration of these toxic drugs.
Thymidine kinase (TK) is the first, and the most studied, suicide gene, 5 which accounts for about 10% of all clinical trials evaluating cancer gene therapy. 6 The mechanism of its action exploits a unique characteristic of herpes simplex virus thymidine kinase (HSV-TK), which, contrary to normal mammalian thymidine kinase, preferentially monophosphorylates gancyclovir (GCV), rendering it toxic to normal mammalian cells. Further phosphorylation of GCV-monophosphate by cellular kinases produces a metabolite, which, upon integration into DNA, terminates DNA-strand elongation. 7 In addition to the direct toxicity induced by this suicide gene, a bystander effect also plays an important role in enhancing its efficacy. 8 Earlier clinical trials in using this system have had controversial results. For example, suicide gene therapy in malignant mesothelioma increased the median survival of patients, 9 and clinical trials involving localized prostate carcinoma resulted in a lengthened doubling time for the cancer-marker prostate-specific antigen 10,11 (PSA). However, the results of clinical trials on brain tumors were unsatisfactory. 12
Several strategies have been designed to overcome the toxic effects of the systemic administration of vectors containing suicide genes, 13 such as targeting the construct to the desired cells by inserting monoclonal antibodies (mAbs) specific for tumor cells on the surface of the viral vectors 14 or restricting the expression of suicide gene by tissue- or cancer-specific promoters. 15,16 Cancer-specific promoters are better choices, since they can generally be used in different types of cancers and can evade downregulation in case the cancerous cells dedifferentiate. 16 There are many examples of cancer-specific suicide gene therapy, such as the PSA promoter for prostate adenocarcinoma 17 or carcinoembryogenic antigen (CEA) promoter for colon carcinoma. 18
One of the more successful strategies in selecting the best cancer-specific promoters for suicide gene therapy is to investigate deregulated signaling pathways in cancerous cells in order to identify downstream promoters abnormally upregulated by these pathways.
The most important constitutive pathway showing abnormal activation in colon cancer cells is Wnt. 3,19 Inactivating mutations in the adenomatous polyposis coli (APC) gene are seen in 70%–80% of familial and sporadic cases of colon cancer. 20 If this signaling pathway is activated, for example, by mutations that inactivate the APC gene or β-catenin gene products, proteasome-mediated degradation of β-catenin through axin and GSK3 (glycogen synthetase kinase 3) complex would be disrupted. This would lead to increased β-catenin in the cytoplasm and, subsequently, to its migration into the nucleus. Free β-catenin in the nucleus associates with the HMG-box transcription factor, T-cell factor 4 (TCF4); this complex then activates promoters that contain TCF binding sites. 20 Some examples of genes downstream to this pathway been identified by microarray 21 analysis are vascular endothelial growth factor (VEGF), 22 neural cell adhesion molecule (Nr-CAM), 23 and fibroblast growth factor 18 (FGF18). 24
Considering the importance of this pathway in transforming the epithelial cells of the colon, it has been hypothesized that the Wnt signaling pathway can be exploited in colon-cancer–specific suicide gene therapy. Various studies have utilized this pathway; for instance, swapping out TCF binding sites for the adenoviral E2 promoter in cell lines with an activated Wnt signaling pathway 25 yielded activity comparable to the wild-type E2 promoter. Insertion of five TCF binding sites adjacent to the minimal SV40 promoter showed promising results; however, there was a promiscuous expression in normal cells, 3 which was overcome by replacing the minimal SV40 promoter with a TATA box. 26 Both of these promoters were active in colon cancer cell lines with high activation levels of Wnt. Other studies have reported the use of a minimal cytomegalovirus (CMV) promoter 27 or minimal thymidine kinase promoter 28 besides using artificial TCF/LEF binding sites. 29 These constructs showed both specificity and activity in cell lines with activated Wnt signaling pathways; however, their activity in various colon cancer cell lines has not been confirmed. 28,30
Expression profile data of colon carcinoma have shown that in cancerous tissues, the FGF18 gene is upregulated downstream of the Wnt signaling pathway; therefore, the FGF18 promoter can be used to construct cancer-specific suicide vectors. FGF18 is a heparin-binding extracellular secreting factor, 29 which normally plays a role in chondrogenesis and osteogenesis 31 ; it is only expressed in adult heart tissue. 24
In this study, the unaltered native FGF18 promoter containing one TCF/LEF1 binding site 24 was cloned upstream of the bacterial β-Gal (LacZ) reporter gene and thymidine kinase (TK) suicide gene. The influence of these constructs on two colon cancer cell lines (SW480 and HCT116), which exhibit inherently different levels of activation of the Wnt signal-transduction pathway, and on the normal human umbilical vein endothelial cell line (HUVEC) and normal colon cells (NCCs), was studied.
The application of natural promoters might carry the advantage of mimicking the natural state of the promoters in the cells, utilizing repressor elements to restrict expression in the normal cells. Results obtained in this study may provide an insight into the comparative performances of natural and artificial promoters studied, so far.
Materials and Methods
DNA extraction
Genomic DNA was extracted from venous blood lymphocytes of a healthy person by the proteinase K method. 32 In accord with guidelines, signed consent was obtained from the blood donor; she had no history of familial cancers or of cancer onset before the age of 60 in her relatives. Plasmid DNA and viral DNA from herpes simplex virus were extracted by a miniprep plasmid extraction kit and the QiaAmp Viral DNA Extraction Kit, respectively (Qiagen, Germany).
Fragment amplifications
The CMV and FGF18 promoters were amplified from pcDNA3.1+ (Invitrogen) and human genomic DNA, respectively. The gene was amplified from the herpes simplex virus 1 genome. Primer sequences are given in Table 1.
CMV, cytomegalovirus.
Plasmid design and construction
In this study, six vectors were constructed from using pUCLTRLacZ, which encodes the complete bacterial β-Gal gene between the HTLV-1 long terminal repeat (LTR) promoter and BGH polyA. 33 The LTR was digested out and replaced with CMV or FGF18 promoters to obtain pUCCMVLacZ and pUCFGF18LacZ constructs. The HindIII digested plasmid was also relegated, resulting in pUCLacZ plasmid. In addition, LacZ was digested out from pUClacZ plasmid by XhoI and NcoI, keeping the PolyA tail intact, and the TK gene was inserted in its place to construct pUCTK. CMV or FGF18 promoters were also placed upstream of the TK gene to obtain pUCCMVTK or pUCFGF18TK. Schematic figures of constructed plasmids are given in Figure 1.
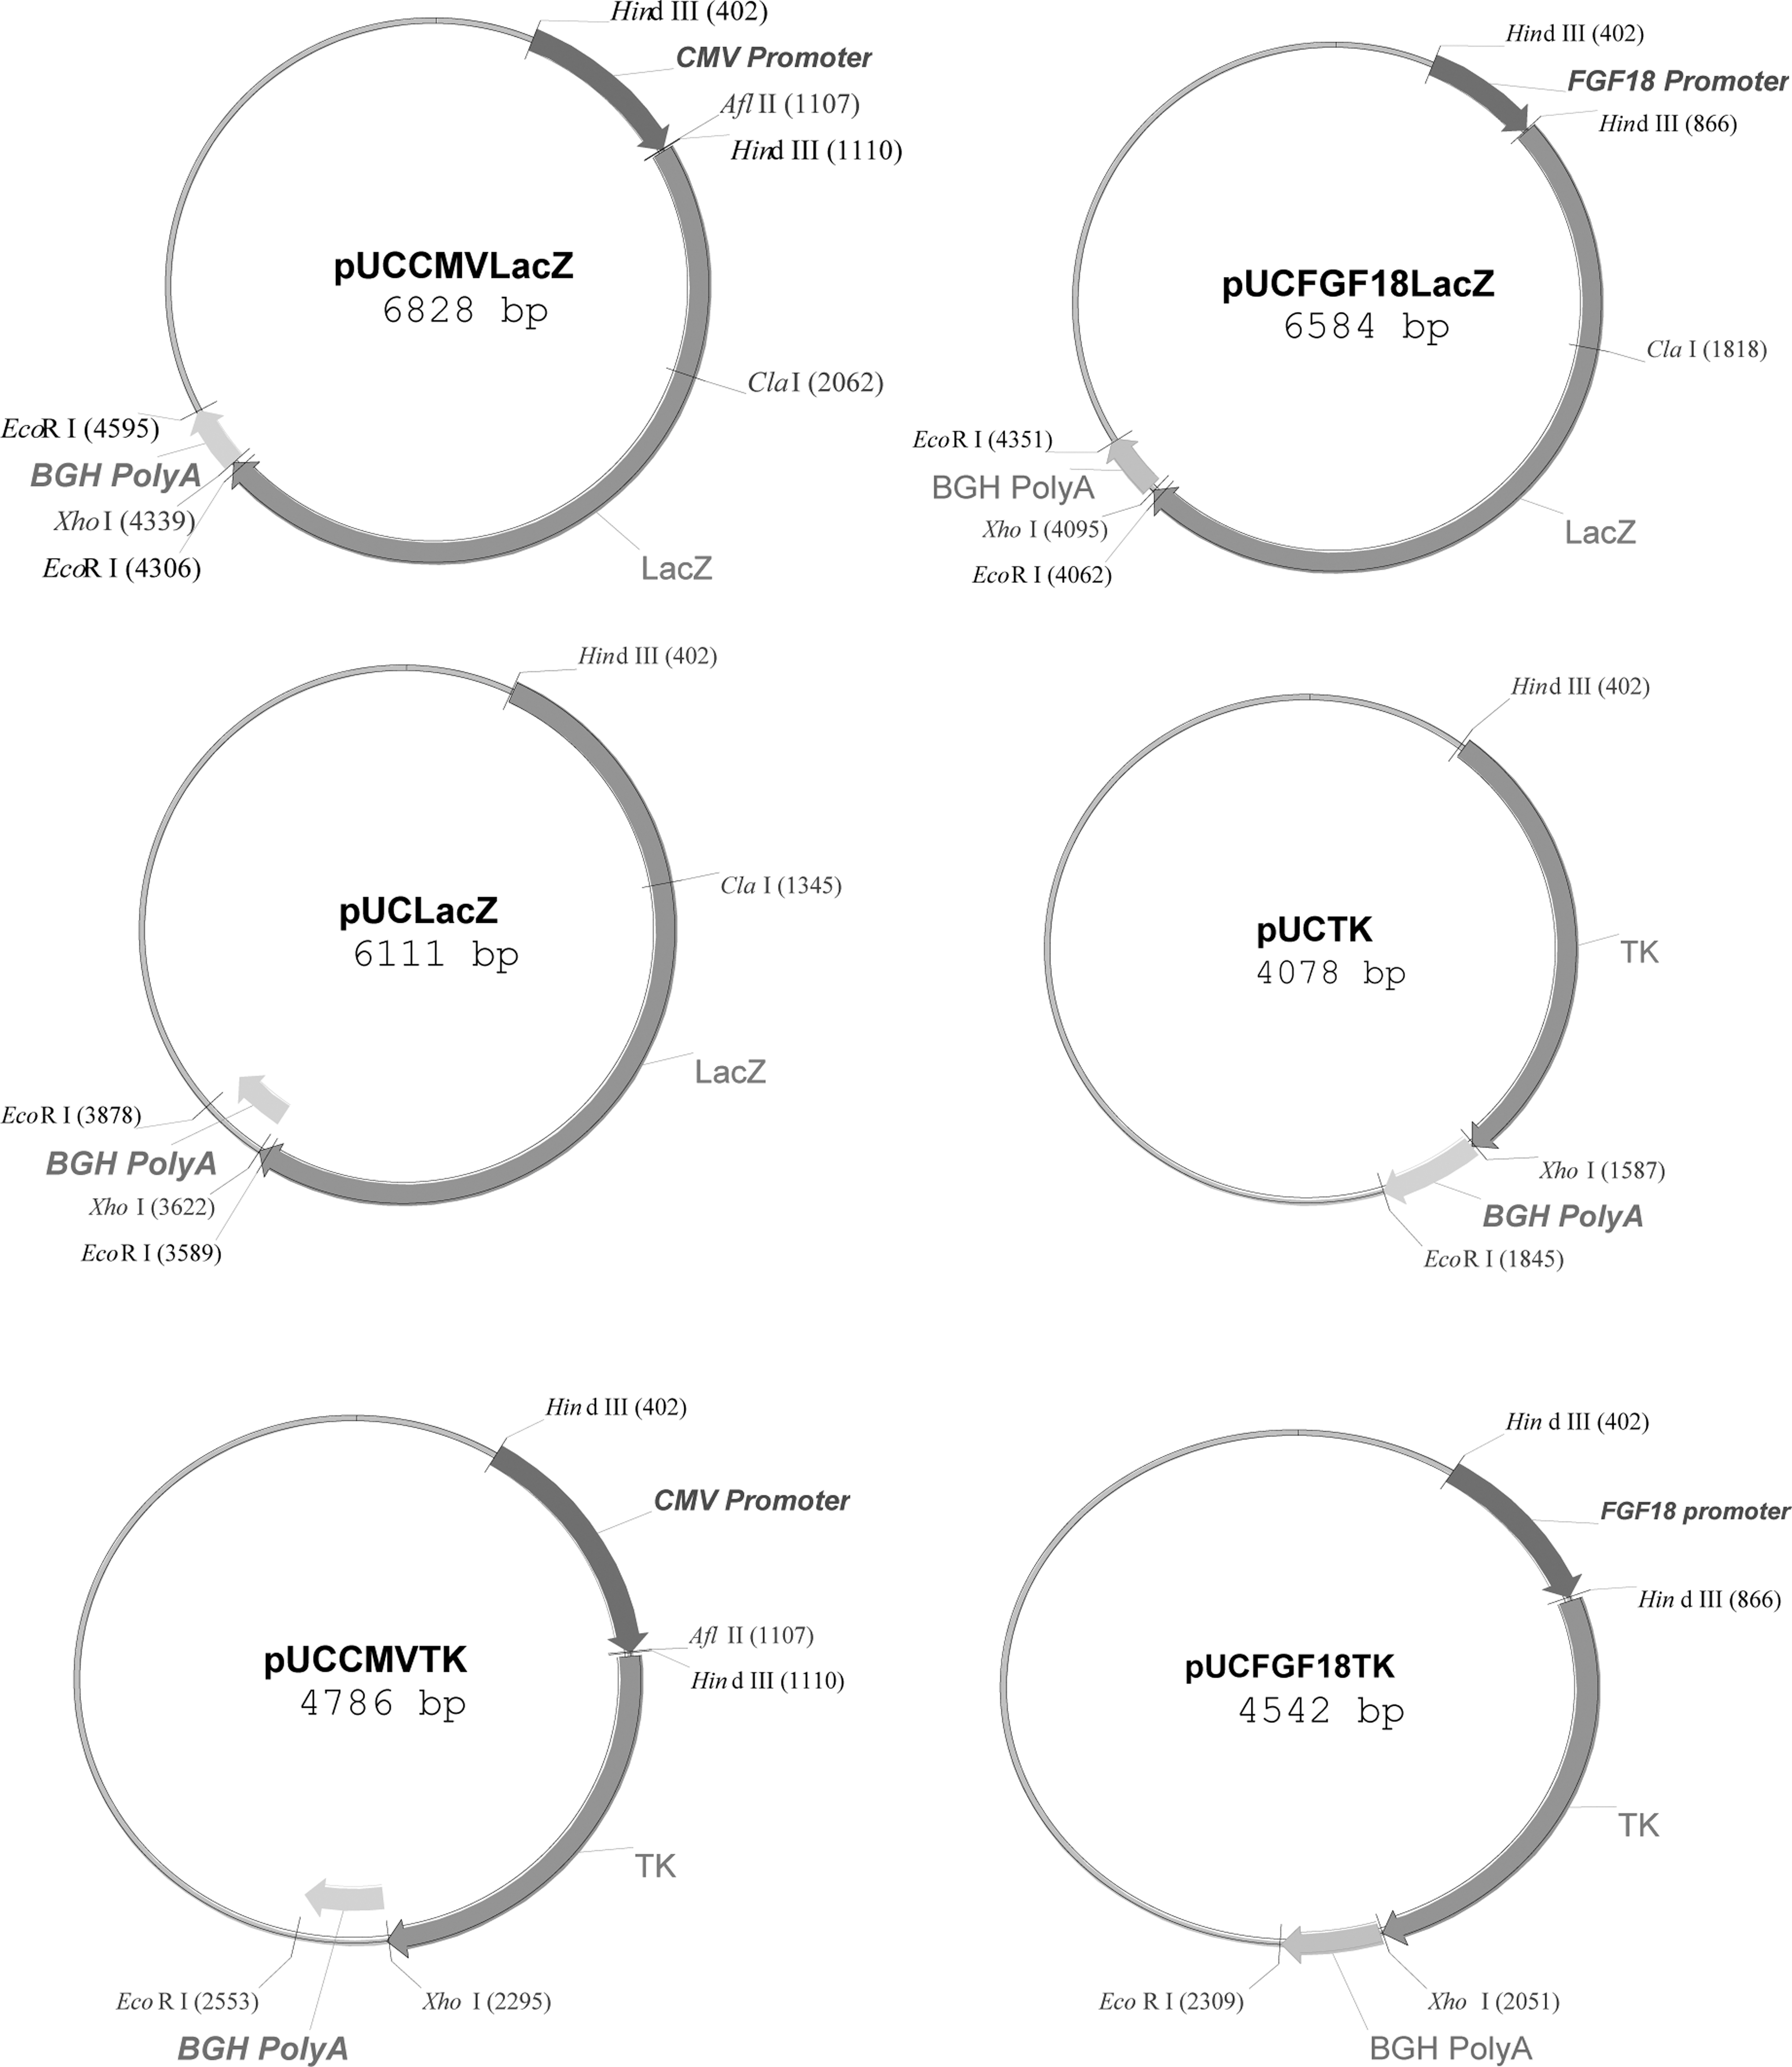
The name and the map of plasmids designed and constructed in this study, pUCTK and pUCLacZ are promoterless plasmids, which were used as negative controls in this study.
In this study, the promoterless plasmids, pUCLacZ and pUCTK, were used as negative controls.
Cell lines and culturing
HUVEC and SW480 cell lines were obtained from National Cell Bank of Iran (NCBI; Pasteur Institute of Iran, Tehran, Iran). The HCT116 cell line was obtained from ATCC (American Type Culture Collection, Manassas, VA). SW480 and HCT116 cell lines were cultured in high-glucose Dulbecco's modified Eagle's medium (DMEM) with 10% fetal bovine serum (FBS) plus 100 unit/mL of penicillin, 100 μg/mL of streptomycin, and 2 mM of
Obtaining primary cells from normal colon tissue
The normal colon tissue specimen was freshly obtained from a 27-year-old man under surgery at Imam Khomeini Hospital (Tehran University of Medical Sciences). He had undergone the surgical procedure because of a volvulus in his colon. He had no history of familial cancer, and none of his first-degree relatives had died from colorectal carcinoma. Before donating his tissue, he had signed the ethical consent. This specimen was proved to be normal in pathologic studies. The CEA was not positive in the donor. This procedure was approved by the ethical committee of Pasteur Institute of Iran.
Immediately upon transferring the tissue to the lab, it was washed with phosphate-buffered saline (PBS). Then, it was chopped into 1-mm pieces. The chopped pieces were washed with PBS and then treated with 200 unit/mL of collagenase (Gibco-BRL) in a CO2 incubator for about 2 hours. Thereafter, the cells were seeded into two to four wells of a 12-well plate (Nunc, Denmark). They were cultured in a mixture of DMEM:Ham's F12(1:1) media (Gibco-BRL), supplemented with 4 mM of
The cells were seeded onto a plate treated with collagen from rat tail (Roche Applied Science, Germany). After two passages, they were trypsinized from the plate and seeded onto noncollagenated plates or flasks for further experiments. In this article, this mixture of adherent cells obtained from normal colon tissue has been named NCCs.
Optimization of transfection methods
One (1) day prior to transfection, 2 × 10⁵ of SW480, HCT116, and HUVEC cell lines and 1.5 × 10⁵ of NCCs were seeded into each well of a 24-well plate. When the cells in each well reached 70%–80% confluency, they were transfected with positive control plasmid (pUCCMVLacZ), using Lipofectamine 2000 (Invitrogen), polyfect, and effectene (Qiagen). Different ratios of DNA and reagents examined in the optimization procedure are given in Table 2. The percentage of transfected cells was calculated by a semiquantitative method, using β-Gal staining. The average ratio of stained cells to the total number of cells was examined in at least five different fields to determine the transfection rate. The death rate for each method was estimated by staining the transfected cells in another well (treated with the same reagent and DNA: reagent ratio) by the trypan blue method. The optimum transfection method was chosen according to the maximum transfection rate and the minimum death rate of the cells. If the death rate of the cells in a method was higher than 30% (high), the method would not be considered as an optimum method. Transfection rate and death rate of cells were compared with nontransfected wells.
Different rates of DNA and reagents were used and summarized in this table, transfection rates were calculated by β-Gal staining (described in Materials and Methods), and death rate of cells were calculated by trypan blue staining of another well with the same condition. The death rate was assumed to be low when it was lower than 10%, moderate when it was between 10 and 30%, and high when it was higher than 30%.
HUVEC, human endothelial vein endothelial cell.
For normalization of transfection in β-Gal enzyme-linked immunorsorbent assay (ELISA), cells were transfected with a mixture of the main reporter and chloramphenicol acetyltransferase (CAT)-expressing construct (pRc/CMV2CAT; Invitrogen, USA) in the ratio of 9:1.
β-Gal staining
Forty-eight (48) hours after transfection, the cells were fixed with 0.5% glutaraldehyde (Sigma, St. Louis, MO). After washing with (PBS), the cells in a 24-well plate (Nunc) were stained with 3 μL of 400 mM of ferrocyanide potassium (Fluka, Switzerland), 3 μL of 400 mM of ferricyanide potassium (Fluka), 3 μL of 200 mM of MgCl2 (Merck, Germany), 15 μL of 20 mg/mL of Xgal (Fermentas, Lithuania) and 276 μL of PBS. The percentage of positively stained cells in each well was estimated by counting the blue cells among the total number of cells in at least five different fields under the inverted microscope (400 × zoom).
β-Gal ELISA
The day before transfection, 4 × 10⁵ cells (3 × 10⁵ of NCC cells) were seeded in each well of a 12-well plate. When the cells in each well reached 70%–80% confluency, the cells were transfected with the respective optimum method of transfection. Then, 48 hours after cotransfecting pUCCMVLacZ or pUCFGF18LacZ or pULacZ (negative control) plasmids with CAT-expressing plasmid (the ratio was 9:1), cells were lysed with 250 μL of lysis buffer. Bacterial β-gal expression was studied by β-gal ELISA (Roche Applied Science), using 200 μL of cell extracts, measuring the optical density (OD) at 405 nm (490 nm as background) every 2 minutes by a microplate reader (Biotek) and calculating the maximum slopes of OD change.
CAT ELISA
First 50 μL of the cell extracts used for β-Gal ELISA were mixed with 150 μL of sample buffer and then added to each well of a CAT ELISA plate (Roche Applied Science). After following the ELISA protocol detailed in the manufacturer's instructions, the OD was measured at 405 nm (490 nm as background) every 2 minutes and the maximum slopes of OD change were calculated.
Cytotoxicity assay
Four (4) and 8 hours after transfection with polyfect and effectene reagents, cells were trypsinized and 104 cells were plated into each well of a flat-bottomed 96-well cell-culture plate (Nunc). On the next day, GCV (Roche, Switzerland) was added to cell medium at final concentrations of 0, 20, 40, 60, 80, and 100 μg/ml. Four (4) days after transfection, the media were replaced with 100 μL of fresh DMEM with 10% FBS plus 50 μL of XTT mixture (Roche Applied Science), as per the manufacturer's instructions. After 4 hours of incubation in a CO2 incubator, the OD of cell medium was measured at 490 nm with the background of 690 nm by a microplate reader (Biotek).
Analyzing the dead cells by staining the cells with M30 cytodeath antibody
Twenty-four (24) hours after transfecting HCT116 and SW480 cell lines with suicide and negative control plasmids, 40 μg/mL GCV was added to the cell medium. Then, 24 hours later, cells were trypsinized and washed with PBS and stained with M30 cytodeath antibody (Roche Applied Science), according to the manufacturer's instructions. Thereafter, cells were analyzed by a flowcytometer with at least 10,000 events per reading in a PAS machine, using flowmax software (Partec, Germany).
The GCV concentrations and cell-harvesting time for flowcytometry experiments were optimized by collecting the cells at different time intervals with different GCV concentrations.
RNA extraction
Twenty-four (24) hours after transfection in a 12-well plate, the cells were washed with PBS and then RNA was extracted with 1 mL of Tripure (Roche Applied Science). 32 The OD ratio of extracted RNA was measured at 260 and 280 nm, and the quality of RNA was considered suitable when the ratio of 260:280 was between 1.5 and 1.8.
cDNA synthesis
The extracted RNA was treated with DNAase to remove the contaminating plasmid DNA. The RNA was converted to cDNA by using M-MuLV as a reverse-transcriptase enzyme and oligo dT as the primer. 32 All reagents were obtained from Roche Applied Science.
Real-time polymerase chain reaction (PCR)
The expression of TK in cells transfected with TK-expressing plasmids was assessed at the cDNA level, using SYBR Green mastermix (AB), in an AB 7300 machine (AB). This amplified a 141-bp fragment of thymidine kinase from the cDNA. β-actin expression was also evaluated at the cDNA level by amplifying a 134-bp fragment, which served as the reference. The sequences of primers for amplifying cDNA from both genes are given in Table 1.
The efficiency of amplification was evaluated by testing serial dilutions of cDNA on which the real-time PCR experiments were performed.
Statistical methods
All experiments were repeated at least three times. The results were analyzed by the Student's t-test and Pearson correlation coefficient, using SPSS software, version 12 (SPSS, Inc., Chicago, IL).
Results
Transfection optimization
An optimized transfection rate for SW480, HCT116, HUVEC, and NCC was achieved by using Effectene at the DNA/reagent ratio of 400 ng/4 μL, and PolyFect at the DNA/reagent ratios of 1600 ng/8 μL, 800 ng/12 μL, and 1600 ng/8 μL, respectively. Table 2 summarizes the transfection and death rates of these cell lines after applying different reagents.
The maximum transfection rates for HCT116, SW480, HUVEC, and NCC cells were 50%, 35%, 10%, and below 10%, respectively.
Semiquantitative analysis showed that FGF18 promoter was active in both colon cancer cell lines but not in HUVEC cell line
Staining results of HCT116, SW480, and HUVEC cell lines transfected with different plasmids are shown in Figure 2. The staining results of NCC are also given in Figure 3.

Staining results of different cells transfected with different plasmids. The blue cells (see online version for color) are the cells that have expressed β-Gal under the control of the respective promoter. All pictures were taken under a Zeiss invert microscope and were taken with a Motic camera, using Motic Image Plus 2 software. Arrows show the size bar.
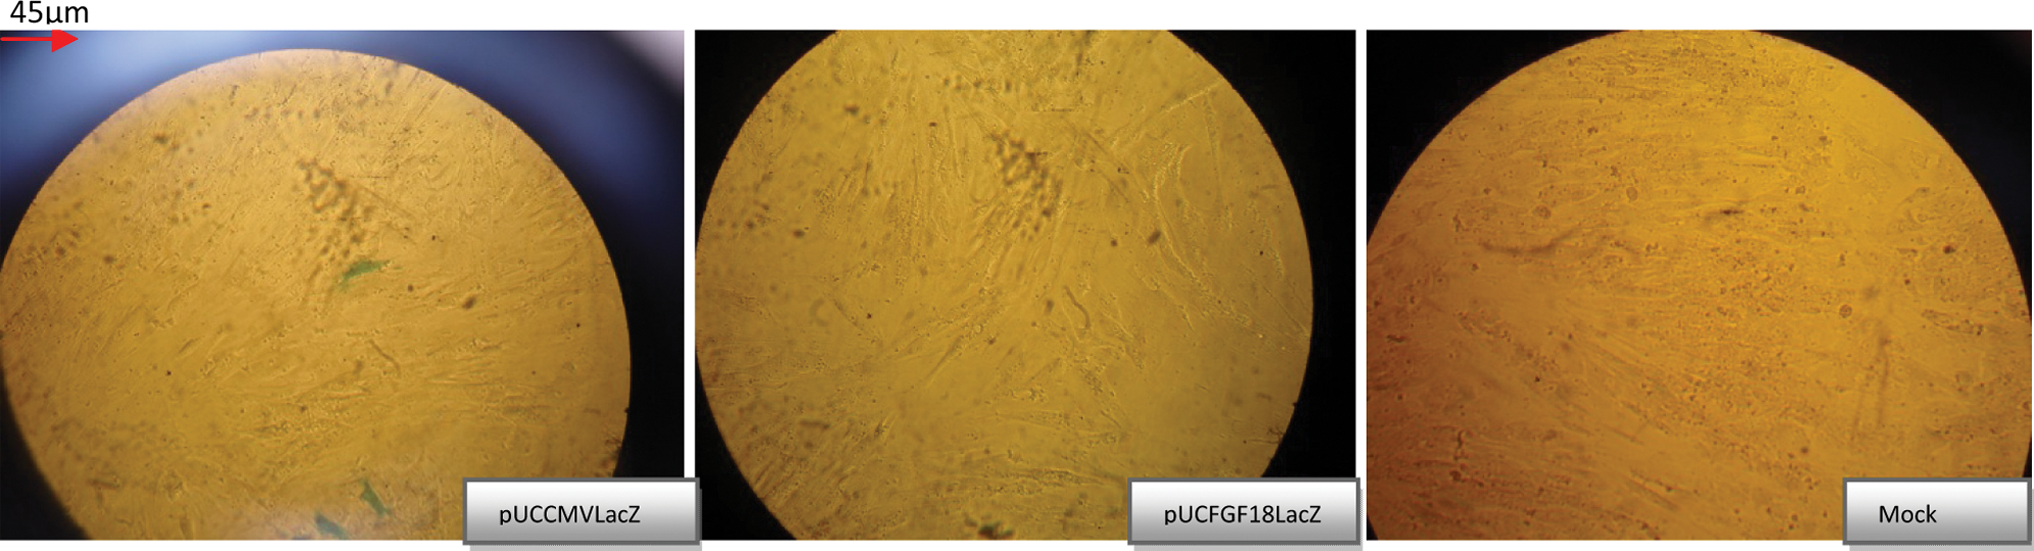
Staining results of normal colon cells (NCCs) transfected with different plasmids. The blue cells are the cells that have expressed β-Gal under the control of the respective promoter. All pictures were taken with a Sony W camera (Japan). Red arrow, at the upper left corner of the first image (see online version for color), shows the size bar.
In SW480, HCT116, HUVEC, and NCC cells transfected with pUCFGF18LacZ, 5%, 10%, 0%, and 0% of the cells were positively stained, respectively.
β-Gal expression under the control of the FGF18 promoter was not observed in the HUVEC cell line. Low rates of transfection in this cell line made it necessary to confirm a lack of β-Gal expression by β-Gal ELISA, which is a quantitative method.
β-Gal ELISA confirmed that FGF18 promoter drives expression of reporter gene in colon cancer cell lines but not in HUVEC and NCC
The transfection rates of all cell lines with the main reporter plasmid (pUCCMVLacZ, pUCFGF18LacZ, or negative control) were normalized by the expression of CAT through cotransfection with pRc/CMV2CAT. For this purpose, the β-Gal maximum slope was divided by the CAT maximum slope of the same cell lysate. Normalized expression of β-Gal, induced by different plasmids in SW480, HCT116, HUVEC, and NCC cells, is shown in Figure 4.

Results of β-Gal ELISA in HCT116, SW480, HUVEC, and normal colon cells (NCCs). Each graph shows the detailed result of β-Gal ELISA and CAT ELISA from cell extract of cells transfected with reporter plasmids. The first bars in each group are indicative of the maximum slope of β-Gal ELISA (β-Gal raw expression), the second bars are indicative of CAT ELISA maximum slope (CAT raw expression), and the third bars show the normalized expression of β-Gal by dividing the β-Gal maximum slope to the CAT maximum slope. The figures over β-Gal and CAT maximum slopes of pUCCMVLacZ- and pUCFGF18LacZ-transfectected cells are estimates of β-Gal and CAT raw expressions, based on plotting the maximum slopes of positive controls (serial dilutions of β-Gal and CAT). The line within each bar is the standard error.
HCT116 and SW480 cell lines transfected with pUCCMVLacZ exhibited significantly higher expression of β-Gal than mock-transfected cells (P-values = 0.003 and 0.007, respectively). Expression of this gene under FGF18 promoter was significantly higher than the negative control in the HCT116 and SW480 cell lines (P-values = 0.001 and 0.004, respectively). The ratios of FGF18 promoter activity, in comparison to CMV promoter activity, in HCT116 and SW480 cell lines were 0.25 and 0.09, respectively.
The lower transfection rate for the HUVEC cell line was compensated for by normalization with CAT expression; the results showed that β-Gal was not expressed by pUCFGF18LacZ in this cell line, at levels comparable to the negative control. However, pUCCMVLacZ transfected cells presented significantly higher β-Gal expression than pUCFGF18LacZ (P = 0.01242) and pUCLacZ (P = 0.01248). From these data, it could be concluded that the FGF18 promoter was not active in this cell line, while CMV promoter activity reached a significant level after normalization with CAT expression.
In NCC cells, which were a mixture of different cells obtained from normal colon tissue, β-Gal expression under the control of CMV promoter was significantly higher than mock plasmid (P = 0.01227) and pUCFGF18LacZ (P = 0.01529). In contrast, the FGF18 promoter did not induce significant levels of β-Gal expression (P = 0.5117), in comparison to mock plasmid.
Real-time PCR assay further proved the expression of TK by FGF18 promoter in both colon cancer cell lines
Considering that the efficiency of real-time PCR for TK and β-actin genes was similar, mean expression ± standard deviation of TK expression induced by pUCFGF18TK, in comparison to pUCCMVTK, was 0.036623 ± 0.003984 in SW480 and 0.025599 ± 0.006353 in HCT116, respectively.
Cytotoxicity assays showed that FGF18TK construct induces cell death in both colon cancer cell lines
Cell viability of SW480 cells transfected with pUCCMVTK and pUCFGF18TK in the presence of 20 μg/mL or higher of a GCV concentration was significantly lower than in untreated cells (P-values = 0.036 and 0.031, respectively).
In HCT116 cells, the viability of pUCCMVTK- and pUCFGF18TK-transfected cells in the presence of 20 μg/mL and higher GCV concentrations was significantly lower than in untreated cells (P-values = 0.011 and 0.009).
In SW480 cells, even 100 μg/mL of GCV could not reduce the viability of mock-transfected cells significantly (P = 0.255198 at 100 μg/mL). Treatment of the mock-transfected HCT116 cell line just decreased the cell number significantly in 100 μg/mL of GCV (P = 0.0119098 for 100 μg/mL).
Pearson analysis also showed that in pUCCMVTK- and pUCFGF18TK-transfected SW480 cells, an increase in the GCV concentration correlated with significantly decreased cell viability (P-values = 0.027 and 0.048, respectively), whereas in mock-transfected cells, this correlation was not significant. The correlation coefficients for viability and GCV concentration were −0.450 and −0.358 for pUCCMVTK- and pUCFGF18TK-transfected cells, respectively.
This analysis also showed significant inverse correlation between viability and GCV concentration in pUCCMVTK- and pUCFGF18TK-transfected HCT116 cells. The correlation coefficients were −0.338 and −0.331 for pUCCMVTK- and pUCFGF18TK-transfected cells, respectively (P-values = 0.029 and 0.032, respectively). This correlation was not significant in pUCTK-transfected cells. The viability graphs are given in Figure 5.

Viability graphs of HCT116 and SW480 cell lines transfected with pUCFGF18TK, pUCCMVTK (positive control), and negative control plasmids after treatment with different concentrations of GCV. The ratios of viability to the negative control are shown in these diagrams.
Unexpectedly and repeatedly in SW480, raising the GCV concentration from 20 to 40 μg/mL increased the cell viability. The reason for this anomaly was not determined.
Staining the cells with M30 cytodeath antibody proved apoptosis in pUCCMVTK and pUCFGF18TK transfected HCT116 cells but not in SW480
The one-tailed Student's t-test analysis of the apoptosis induced by GCV treatment of pUCCMVTK- and pUCFGF18TK-transfected HCT116 cells showed significant differences (P-values = 0.028709 and 0.038934, respectively), compared to nontreated cells (Fig. 6). In mock-transfected HCT116, the rates of stained cells between GCV-treated and untreated cells were not significantly different (P = 0.26064).
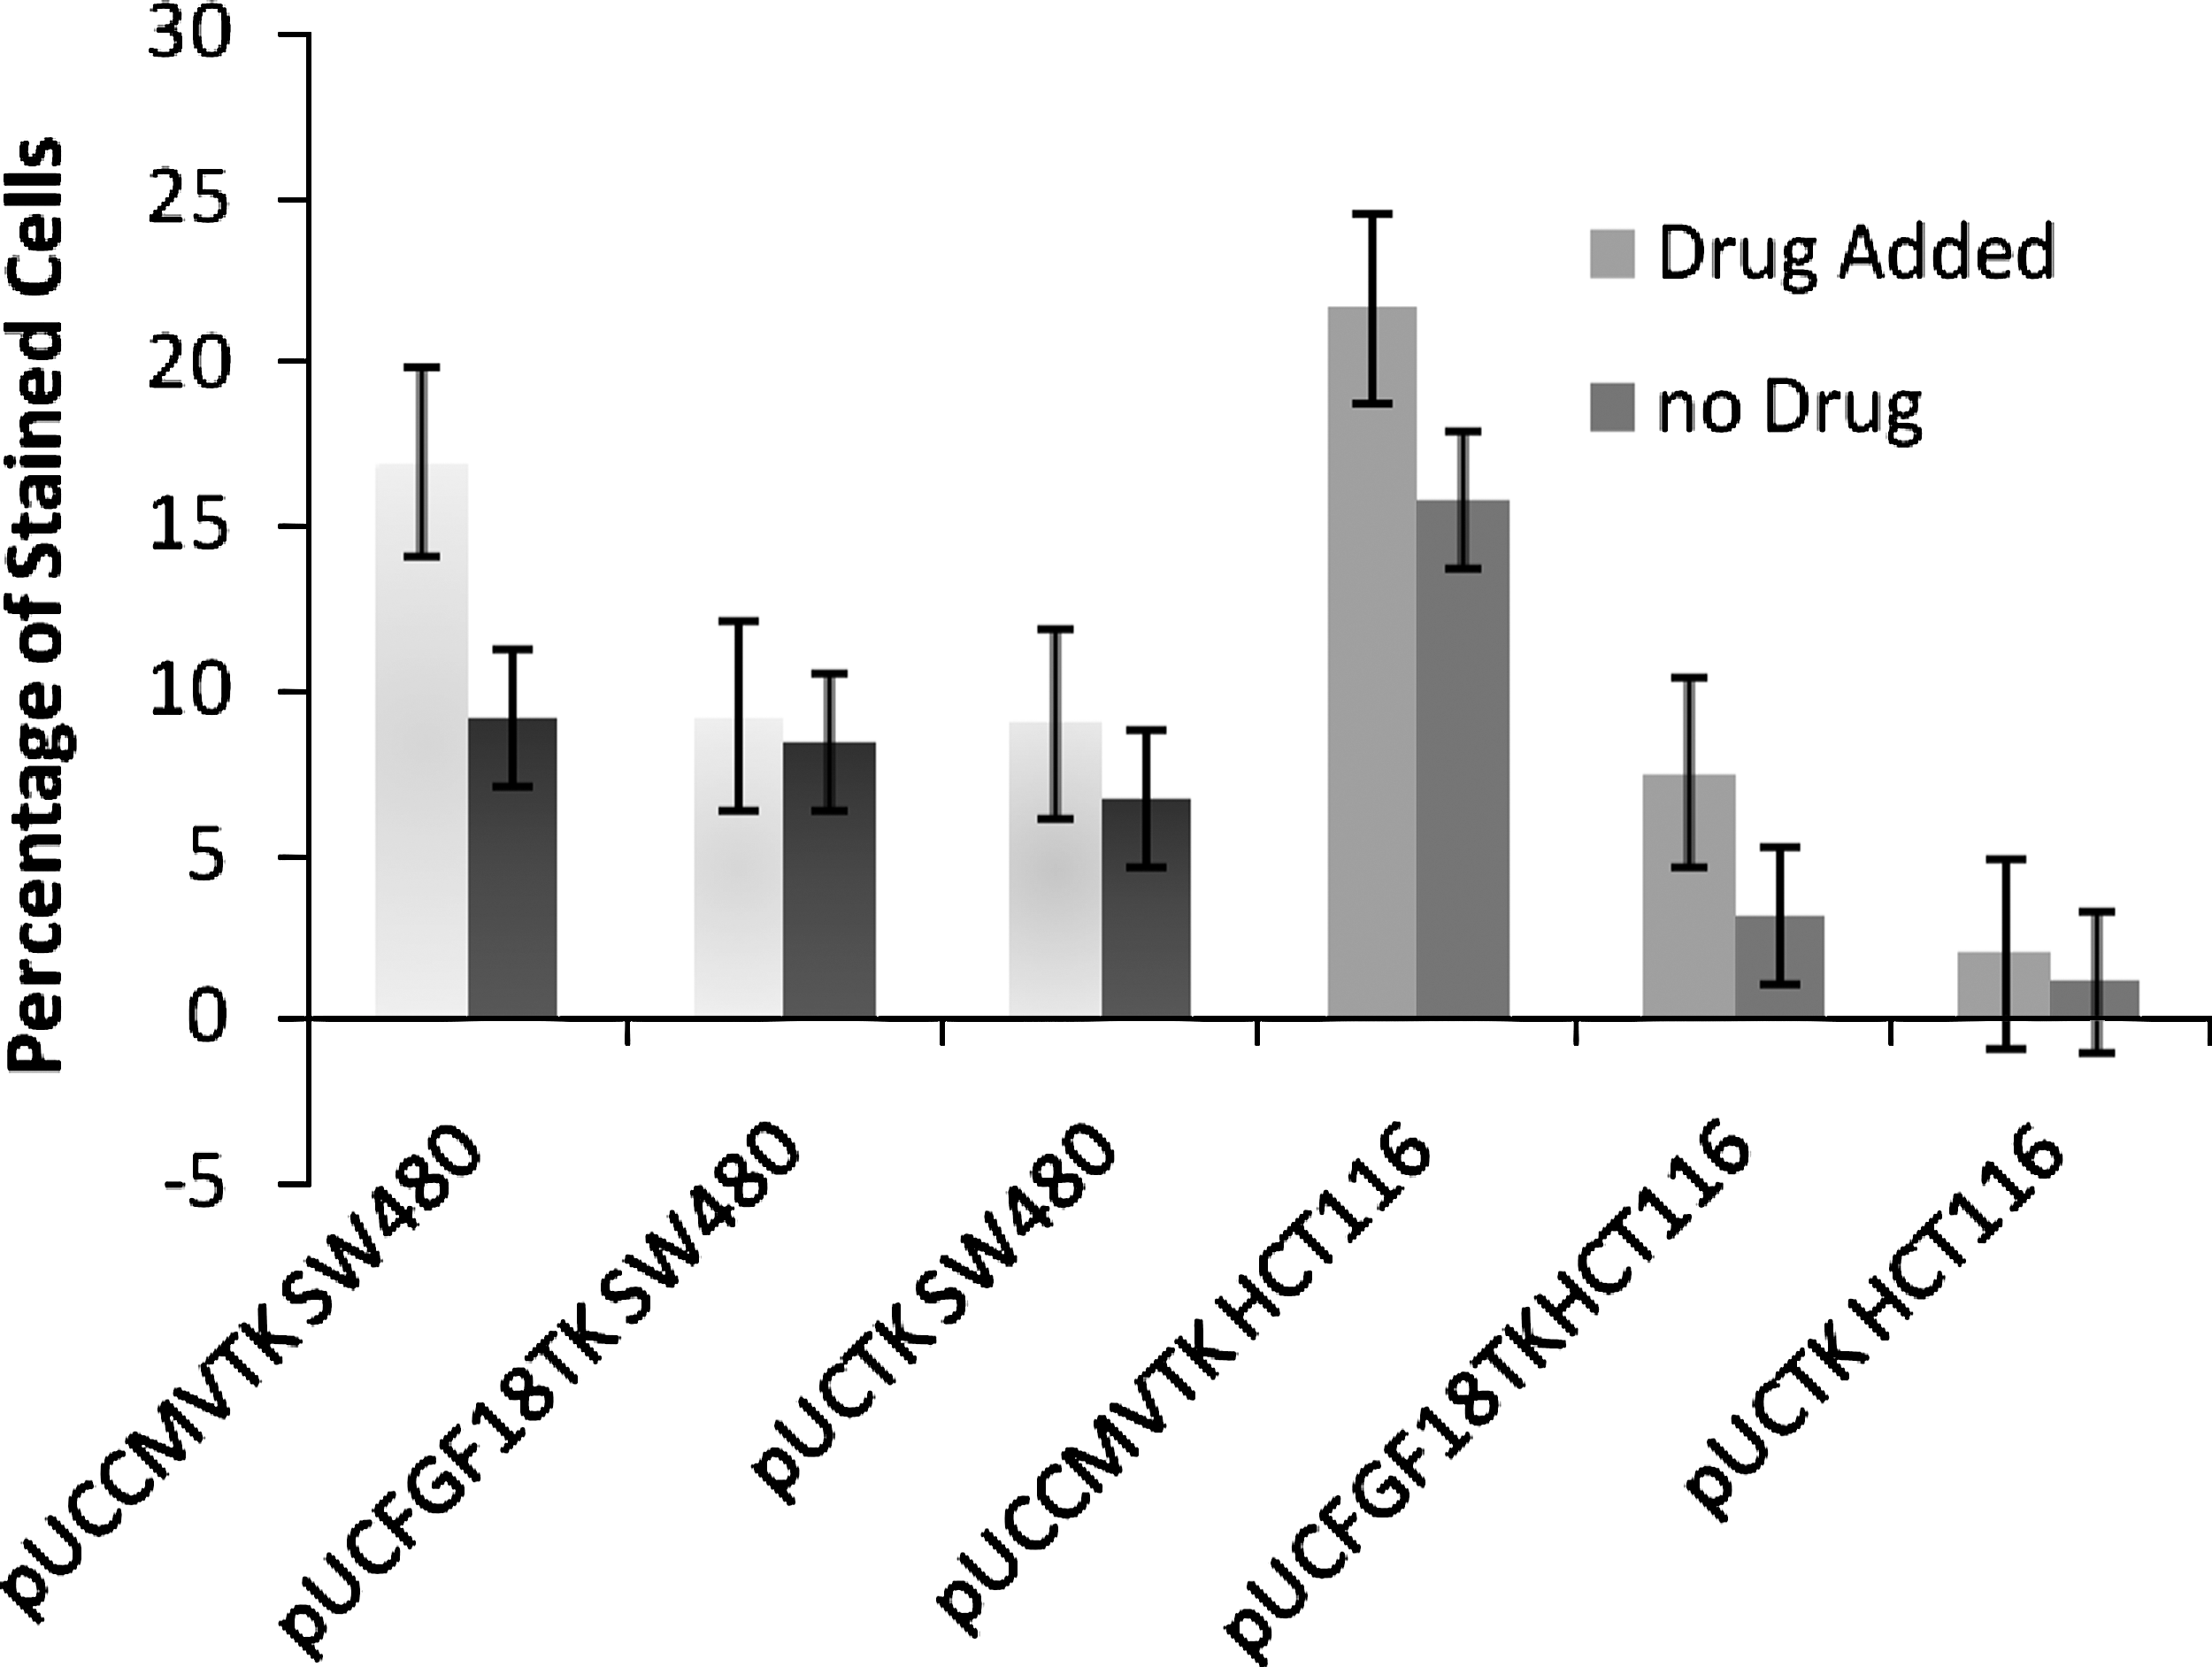
Percentages of stained cells with M30 cytodeath antibody measured by flow cytometry: 40 μg/mL of ganciclovir had been added to the “drug added” group, while the “no drug” group was just transfected with the respective plasmids and was not treated with ganciclovir. The first three groups of bars are the results of experiments on SW480, and the next three groups are the results on HCT116; the line within each bar is the standard error.
The mean (±standard deviation;) rates of apoptosis in treated pUCCMVTK- and pUCFGF18TK-transfected SW480 cell lines were 16.89 ± 10.07 and 9.14 ± 1.56, respectively, whereas in nontreated cells transfected with the same plasmids, the corresponding rates were 9.08 ± 3.85 and 8.37 ± 4.51, respectively. These rates between treated and nontreated cells were not significantly different (Fig. 6).
Discussion
In the systemic administration of suicidal gene constructs, cytotoxic effects of suicide/prodrug on normal cells can be extremely challenging, as reported in the hepatocellular carcinoma model, where the cytotoxicity can induce severe hepatitis. 34 Studying cancerous cell-expression profiles and selecting the most cancer-specific promoters for inducing the expression of suicide genes in the systemic administration of drugs is a rational approach for overcoming these deleterious side-effects. 35
Among various specific promoters activated in colon cancer cell lines, CEA is the most extensively studied. In vitro studies have shown that despite its activity in non-CEA-producing cells, expression driven by this promoter did not reach the therapeutic index. 36 Results on the efficacy of other colon-cancer–specific promoters have been disappointing, except for the cyclooxygenase promoter. 37 However, this promoter is unsuitable for use in systemic suicide gene constructs, since cyclooxygenase is a stress gene and is highly expressed in blood cells.
Wnt is the most important signaling pathway to be abnormally activated in colon cancer 38 ; therefore, several groups have previously used the consensus TCF binding sites activated by this pathway for colon-cancer–specific suicide gene therapy. 3,25 –28
In the study conducted by Brunori et al., the E2 promoter of adenovirus was replaced with four TCF binding sites. 25 This system showed both specificity and efficacy equal to the wild-type promoter; there was a 50–1000-fold reduction of virus replication in cell lines with low activation levels of Wnt, such as lung carcinoma (H1299) and normal fibroblast (WI38), when compared to SW480, which proved its specificity. 25
Placing five TCF binding sites adjacent to the minimal SV40 promoter showed measurable activity in several human colon tumors; however, there was a low level of expression in the nuclei of cells with normal β-catenin levels as well. 3 This promiscuous expression posed a challenge in the case of highly lethal suicide genes, such as ricin and diphtheria toxin. Replacing the minimal SV40 promoter with the TATA box decreased the promiscuous expression of this promoter and increased its specificity. 26
On the other hand, a synthetic TCF/LEF1 binding site place upstream of the FADD (Fas-associated death domain protein) suicide gene was reported to be highly effective in colon cancer cell lines, with no activity in normal cells. 28
The present study was undertaken to assess the similarities and differences (if any) between a native, unaltered promoter downstream of the Wnt signaling pathway and artificial promoters containing responsive elements to this pathway. Although Wnt is the most important pathway activated in colon cancer, there have been no reports analyzing a natural promoter downstream of this pathway for suicide gene therapy. Selection of the FGF18 promoter was based on an analysis of expression profiles that showed overexpression of this gene in adenomas and adenocarcinomas with a mean ratio of 23.9 ± 11, compared to normal sections of colon. 29,39 In addition, normal expression of this gene is restricted to embryogenesis and developmental stages, and its lack of expression has been shown by northern blot analysis 24 in all adult tissues except the heart.
In this study, a fragment encompassing −425 to +31 nucleotide of this promoter (to transcription start site) containing TCF/LEF1 site (−190) 24 was placed upstream of suicide (TK) and reporter (β-Gal) genes. These constructs were delivered to the cells by transient transfection methods. Since introduction of these constructs to human or animal models will definitely exploit transient gene-delivery methods (cationic agents, liposomes or adeno/adeno-associated viral vectors), we preferred to deliver DNA to the cells transiently. In addition to safety concerns, the therapeutic gene in this study was designed to kill the transfected cells, which did not warrant the long-term expression of TK. Besides, an important anticipated mechanism of action of TK/GCV system is the bystander effect. Stable transfection rules out the possibility of including this effect while evaluating the actual potency of suicide gene therapy.
The activity of reporter and suicide constructs was studied in SW480 and HCT116. In the HCT116 cell line with mutant β-catenin, APC has the ability of exporting β-catenin from the nucleus, thus the activation levels of TCF/LEF1 are lower than in other colon cancer lines, such as SW480. In cells such as SW480 with mutant APC, β-catenin export does not occur normally; therefore, TCF/LEF1 attains an enhanced activation status. 40
Analysis of FGF18 promoter activity in these cell lines showed that it was capable of inducing cell death and reporter gene expression even in the HCT116 cell line, which has lower levels of free β-catenin in the nucleus than in SW480. 41
Comparable activity levels in HCT116 and SW480 have not been reported in similar studies, which used artificial promoters responsive to the Wnt signaling pathway. Although one of these artificial constructs showed activity in resected primary, secondary, and metastatic colon cancer tissues, 26 almost all these promoters were moderately effective in colon cancer cell lines with lower activation levels of Wnt, such HT-29 and HCT116. 25,26,28 However, this variation in results should be confirmed by direct comparison of these two sets of promoters.
The strongest speculation about the cause of this discrepancy is that the FGF18 promoter might contain certain unknown responsive elements that may be activated by other deregulated pathways, such as k-ras (which is activated in HCT116). 42,43
In spite of the lower gene delivery efficiency for transfection methods, compared to transduction methods, the expression of the suicide gene in this study attained the therapeutic level.
The cytotoxicity analysis confirmed the negative effect of suicide plasmids on cell viability, upon GCV treatment. The reason for the increased viability of SW480 at the 40-μg/mL GCV concentration, which was observed repeatedly, requires elucidation.
Cytotoxicity assays showed the suicidal efficacy of plasmids. However, to fully elucidate the mechanism behind the cell death, staining with M30 cytodeath antibody was used in preference to Annexin-PI (propidium iodide), since the latter can be influenced by stress associated with the trypsinization of adherent cells.
Cell death was observed in both cell lines by cytotoxicity assays; however, staining with M30 cytodeath antibody showed that apoptosis had occurred in HCT116 (following transfection with suicide constructs and treatment with drugs), but failed to prove this phenomenon in SW480 with the same treatment. This discrepancy might be due to the following: first, since the TK/GCV system acts on proliferating cells, 44 nonproliferating and/or low proliferating cells do not respond well to its cytotoxic effects. Therefore, in the SW480 cell line, which has a higher replication time than HCT116, the apoptotic action of TK/GCV could not be demonstrated by M30cytodeath antibody. Second, TK/GCV is known to induce both apoptosis and necrosis 45 ; this may also rationalize the disparity between the death rates assessed by M30 cytodeath antibody or by cytotoxicity assay.
Further, M30 cytodeath antibody detects a neoepitope of cytokeratine 18, when it is cleaved by caspase 3 46 in the early phase of apoptosis. In P53-deficient cell lines (nonfunctional p53), such as SW480, the main mechanism of apoptosis induced by thymidine kinase/GCV is not through the activation of caspase 3, 47 while in P53-proficient cell lines (cell lines with functional p53), such as HCT116, the mechanism of cell death induced by TK/GCV is caspase 3 dependent. 48 If this assumption proves true upon further analysis, M30 cytodeath cannot be considered as a good marker of apoptosis when activation of caspase 3 is not the main mechanism of apoptosis, as seen in P53-deficient cell lines.
The Wnt signaling pathway is shared in several types of cancers; consequently, it would be useful to study the effects of pUCFGF18LacZ and pUCFGF18TK in other cancer cell lines, especially in hepatocellular carcinoma and melanoma, given that the Wnt signaling pathway is also activated in these cancers. 26 However, the levels of β-catenin in the nucleus determines how effective the FGF18 promoter would be in different cell lines 24,41 ; additionally, the effects of other unknown elements on the activation of this promoter cannot be ignored. Further, inserting other promoters from this pathway in reporter and suicide constructs may be useful in optimizing Wnt signaling-based suicide gene therapy.
Conclusions
These preliminary data should be further confirmed by studying the effect of this construct in other colon cancer cell lines as well as in other normal cells. Specificity of FGF18 promoter must be confirmed by its application in other normal cells, since assessing the activity of the FGF18 promoter in HUVEC and NCC is not sufficient in proving its specificity. Also, this construct should be compared with artificial promoters containing TCF/LEF1 binding sites.
In vivo models must also be included in the design of any further studies in order to realize the potential of this system. In addition, the application of viral vectors would help to approach clinical models in a more practical way.
Footnotes
Acknowledgments
This study was supported by the Pasteur Institute of Iran. The authors thank Anis Jafari, Ph.D., (Molecular Biology Department, Pasteur Institute of Iran) for the critical reading of the manuscript for this article and Amir Amanzadeh, D.V.M., (National Cell Bank of Iran, Pasteur Institute of Iran) for his kind technical assistance in this study and also all personnel of the 1st Ward of Surgery and 1st Operation Room in Imam Khoemini Hospital, and, especially, Mrs. Maryam Noorayee Kia, Mrs. Leyli Ghaffarpoor, and Ahmad Kaviani, M.D., for their kind help in obtaining normal tissue samples.
Disclosure Statement
No competing financial interests exist.