
Abstract
Objective:
Using 153Sm-EDTMP therapy for bone metastases from nasopharyngeal cancer (NPC), we attempted a real-time three-dimensional (3D) dose calculation based on the S-value for voxels. The 3D radionuclide uptake data on SPECT images were factored into the precalculations by the Monte Carlo (MC) method.
Methods:
For the nuclide 153Sm, the S-value for voxels of size 3.45 × 3.45 × 3.45 mm3 in a soft tissue phantom was precalculated on a self-developed program built from the MC program EGS4. Based on the SPECT/CT image of the patient, the 3D dose rate distributions were calculated with the S-value method and compared with the direct MC calculation results. The total volume of the whole calculation region and the bone were chosen as the regions of interest (ROIs); additionally, the dose rate volume histograms (DVHs) for the ROIs were also calculated.
Results:
The iso-dose was administered based on the scan images obtained at 6 hours following injection with the nuclide. In the calculation region, the maximum dose rate was 5.98 × 10⁻⁵ and 6.26 × 10⁻⁵ mGy/(MBq S) for S-value and direct MC calculations, respectively. Once the dose rate was normalized to the maximum dose rate point, the iso-dose curves for both methods of calculation were similar in most regions and reasonably matched the functional image as well. The DVHs of the ROIs indicated that the dose rate distributions were nonuniform, that is, ∼30% of the bone-ROI volume received 10% of the maximum dose rate; however, only 3.8% volume received 50% of the maximum dose rate.
Conclusions:
Using 153Sm-EDTMP therapy for bone metastases from NPC, we attempted to supplement the current dosimetry work at the image-level by a pragmatic and real-time dosimetry calculation based on S-value and functional imaging. More accurate dose calculations for patients undergoing radionuclide therapy will depend on the development of higher image resolution in nuclear medicine and warrant further studies to optimize the pharmacokinetics model.
Introduction
Bone-seeking radionuclides have been applied to a variety of solid cancers with bone metastases, especially to “osteoblastic” ones. As one of the preferred radionuclides in a number of institutions in China, 153Sm-EDTMP comes with a recommended dose of 37 MBq/kg; however, even this dose of 153Sm may cause myelotoxicity. 1 Recent dosimetry work has largely been focused on bone marrow toxicity 2 at the cellular level. However, lower doses may suffice for effective palliation of radiosensitive cancers, as demonstrated in nasopharyngeal cancer (NPC), which is radiosensitive and eminently radiocurable 3,4 ; thus, it is also worthwhile to study individual dosimetry in greater detail.
The S-value–based dose calculation method is rapid and convenient. The basic concept is that the absorbed dose for a particular region of interest (ROI) (the target region) is the sum total of the dose contributions from the target and source regions. Based on the accumulated activities within known regions, the dose rates from source regions to target regions per unit accumulated activity, that is, the S-values, are precalculated and summed up to obtain the absorbed dose for the target region(s). Traditionally, the medical internal radiation dose (MIRD) methodology calculated S-values based on organs, providing the mean doses for organs. 5 To meet the requirements of three-dimensional (3D) dose calculation, a calculation method for S-values based on voxels was presented by Bolch and collegues 6 in the MIRD pamphlet No. 17. Currently, accurate 3D dose distributions can be deduced by utilizing the S-values for corresponding voxels in conjunction with the distribution of activity in the body as documented by 3D functional imaging (SPECT, PET, etc.).
In addition to being a preferred pharmaceutical for palliation of pain caused by bone metastases, 153Sm has been particularly effective in the treatment of prostate and breast cancers. In an attempt at real-time calculation, we have pioneered an application of the S-value method for 3D dose calculations of 153Sm. The application calculates the voxel-based S-values using the Monte Carlo (MC) method; in this case, using 153Sm-EDTMP to treat bone metastases from NPC in an individual patient.
Materials and Methods
Precalculation of voxel-based S-value by the MC method
(1) Calculation phantom: A voxel-based calculation phantom was constructed for determining the voxel S-values (unit: mGy/[MBq S]). The dimension of the voxels was 128 × 128 × 128, the grid size of which could be assigned according to application requirements; the central grid was designated the “source voxel,” whereas the others were labeled the “target voxels.” The composition of the materials and the density of the voxels could be defined according to calculation requirements. The phantom is shown in Figure 1. (2) Precalculated S-values: The MC method (EGS4) was employed to establish the voxel-based 3D absorbed dose calculation program. Such programs may be applied to direct 3D dose calculation in nuclide therapy, as well as in brachytherapy dose calculation.
7
–9
The absorbed dose of a voxel is defined as the ratio of the energy deposition to the mass of the voxel; the formula is as follows: where ɛ
voxel,k
represents the energy deposition in the voxel, whereas (ρ × V)voxel,k
represents its mass. Thus, according to the definition of the S-value, a 3D array summation to assess the dose to a given target voxel is shown below: where “voxel, h” represents the source voxels, whereas “voxel,k” defines the target voxel; and (3) Simulation parameters: The energy spectrum of 153Sm was obtained from the NNDC database online,
10
and the description of the decay properties of the nuclide is given in Table 1. There are different kinds of particles including β rays, low-energy electrons, and gamma rays. These particles can be sampled from the energy spectrum with our calculation program. The medium for the simulation was soft tissue (1.04 g/cm3); scatter data on cross-section for the media were obtained through PEGS4. The cutoff energy for both photons and electrons was 10 keV.
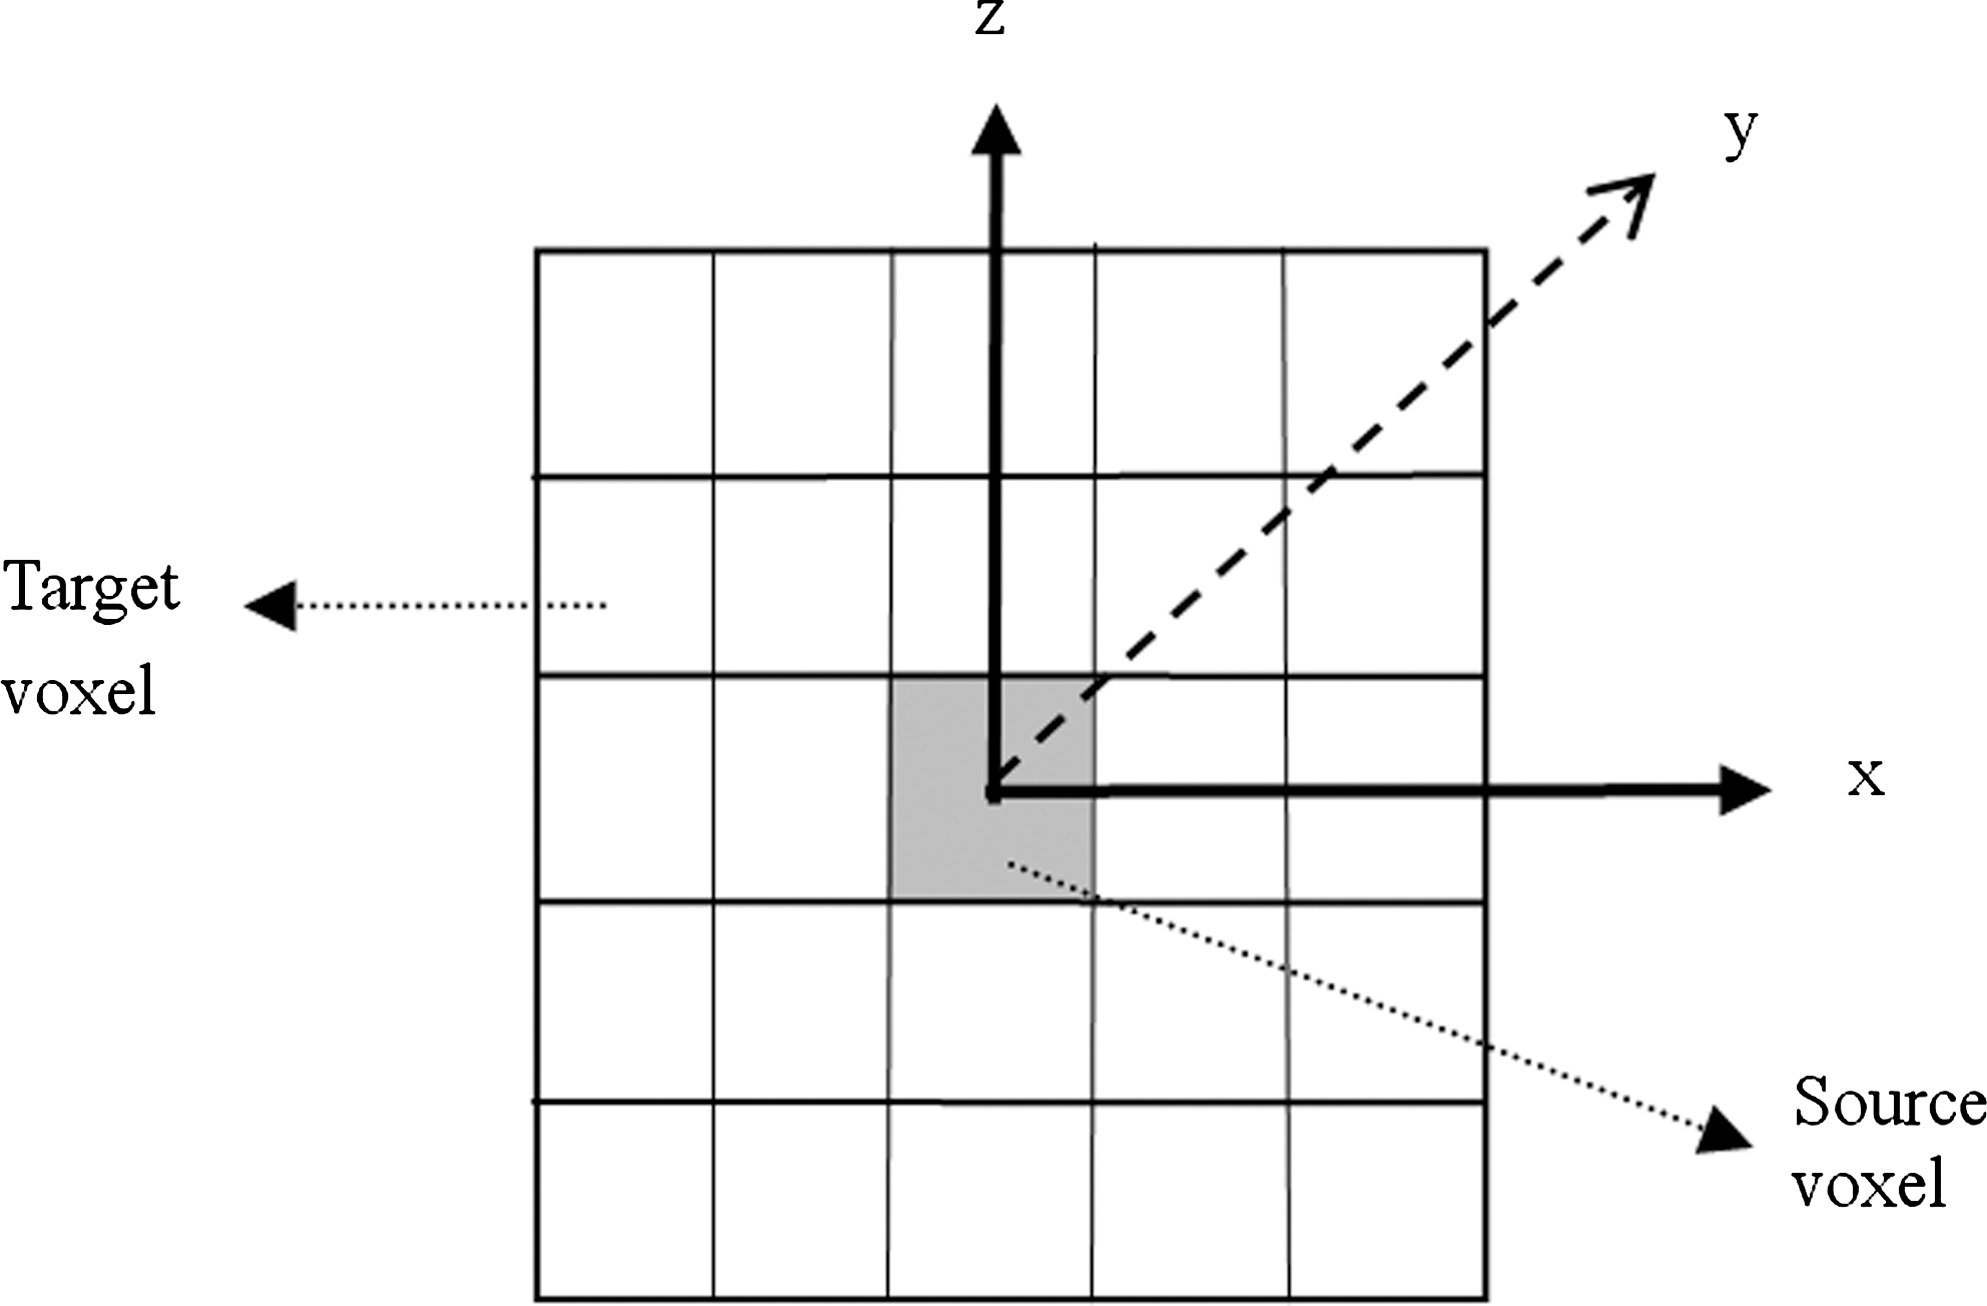
Transverse schematic map of the phantom.
Calculation of the 3D absorbed dose rate for the individual patient
(1) Fusion SPECT-CT for the patient: The patient with NPC and bone metastases was treated with 153Sm-EDTMP (Beijing Atom HighTech Co. Ltd.). The scanner used was Discovery VH (Millennium VG8 Hawkeye) Twin-head Hybrid Imaging System (GE Healthcare). Before SPECT/CT scanning, the scanning coverage of an axis length of ∼40 cm was predetermined on plain film according to the location of the lesions, as shown in Figure 2, wherein the dashed line pane indicates the coverage for scanning purposes. Radionuclide activity appeared to be concentrated in this region. The slice thickness and interval of CT scanning were both set at 10 mm, with a total of ∼40 slices. Using the in-built software, 128 CT images with a resolution of 128 × 128 were reconstructed. During SPECT scanning, a low-energy and high-resolution power collimator was employed. Attenuation correction was performed with CT images obtained by X-rays, whereas scatter correction was conducted with the in-built software. Similarly, 128 SPECT images with a resolution of 128 × 128 were also reconstructed. After SPECT/CT image fusion by the in-built software, composite images with a resolution of 3.45 × 3.45 × 3.45 mm3 were obtained, as shown in Figure 3. (2) Image data conversion: To calculate the dose range accurately, the relationship between the radionuclide activities and the image counts needed to be established. We designed a phantom (Fig. 4) to calibrate the relative radionuclide activity of the SPECT image counts. The phantom, which was made of polymethyl methacrylate, was constructed to accommodate seven cylindrical bottles of 1 cm radius each. The bottles could be filled with radionuclides to cover a range of activity, for example, 0.1, 0.2, …, 1 mGy, etc. After SPECT multiscanning, the radionuclide activity and the image counts could be correlated and expressed as a polynomial. For S-value or direct MC calculation, the SPECT images were exported in the Dicom3 format from the scanner and converted into radionuclide relative activity data by our in-house program (MeDose). A CT phantom (Gammex RMI467) was used to calibrate the relationship between the density and CT HU of the CT image for direct MC calculation. (3) Calculation of 3D dose distribution: The 3D dose rate of the specified region could be calculated by utilizing the precalculated S-values with the SPECT-CT image data of the patient. The S-values and the dose contribution from source voxels to the target voxel were summed up to obtain 3D dose distributions. To calculate the dose of the target voxel, the contributions from 11 × 11 × 11 surrounding voxels were taken into account—this being the number of voxels recommended by MIRD pamphlet No. 17 for most radionuclides. A personal computer took less than a minute for the calculation following the scan. In this case, we calculated the absorbed dose rate with the SPECT-CT images that were captured at 6 hours following radiopharmaceutical injection. (4) Direct MC calculation: For comparison, direct MC simulation was also used to calculate the 3D dose rate distributions for the patient. The CT image provided the CT density of the patient for MC calculation. The parameters of the MC simulation were identical as those aforementioned for the S-value precalculation. The histories were 2 × 10⁹; it took almost 17 hours for computing with the 2.8-GHz CPU personal computer.
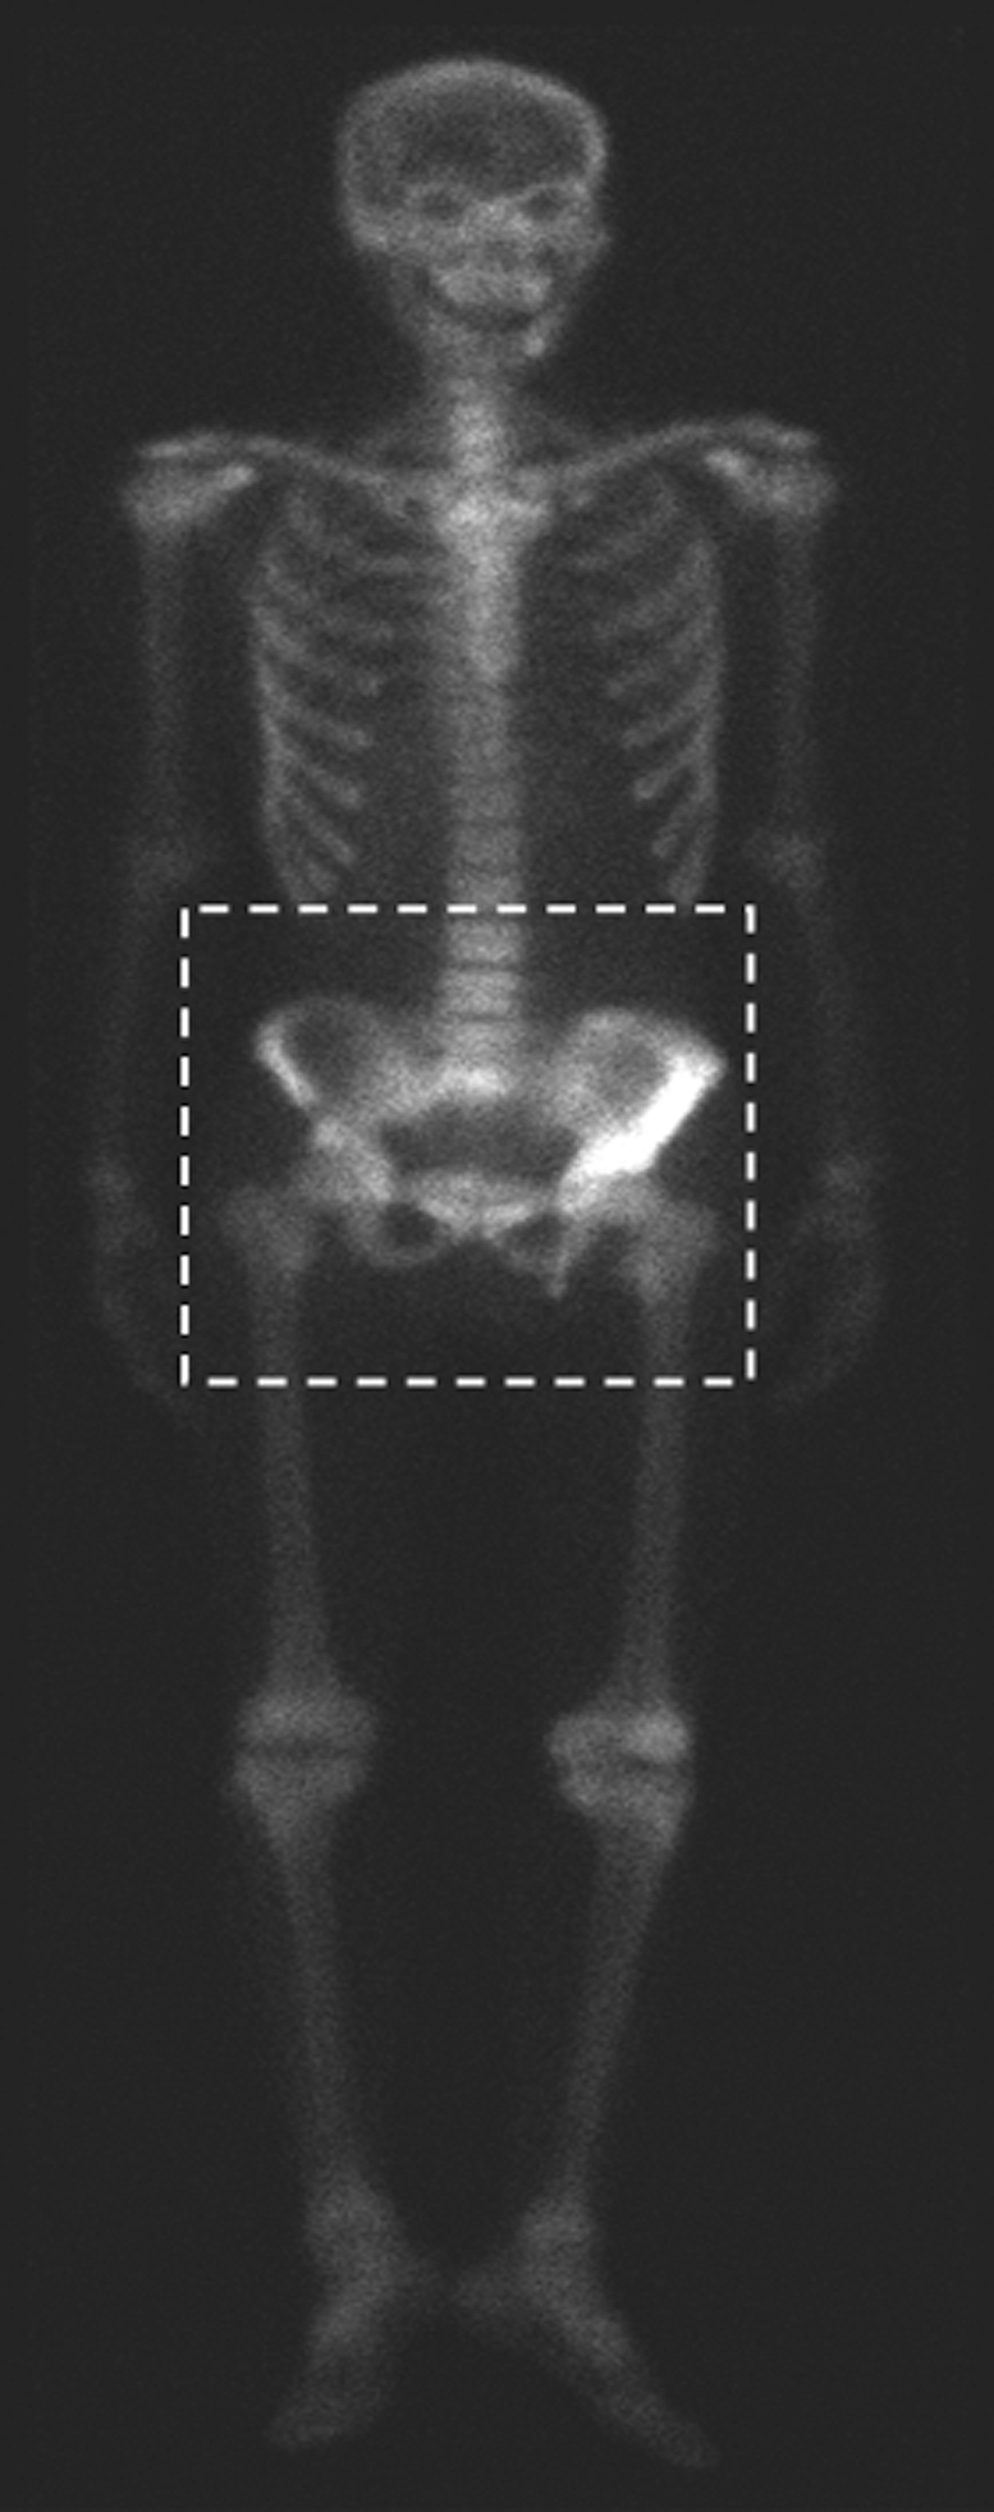
The front scanning image of the patient. The pane indicates the region of interest for calculation.
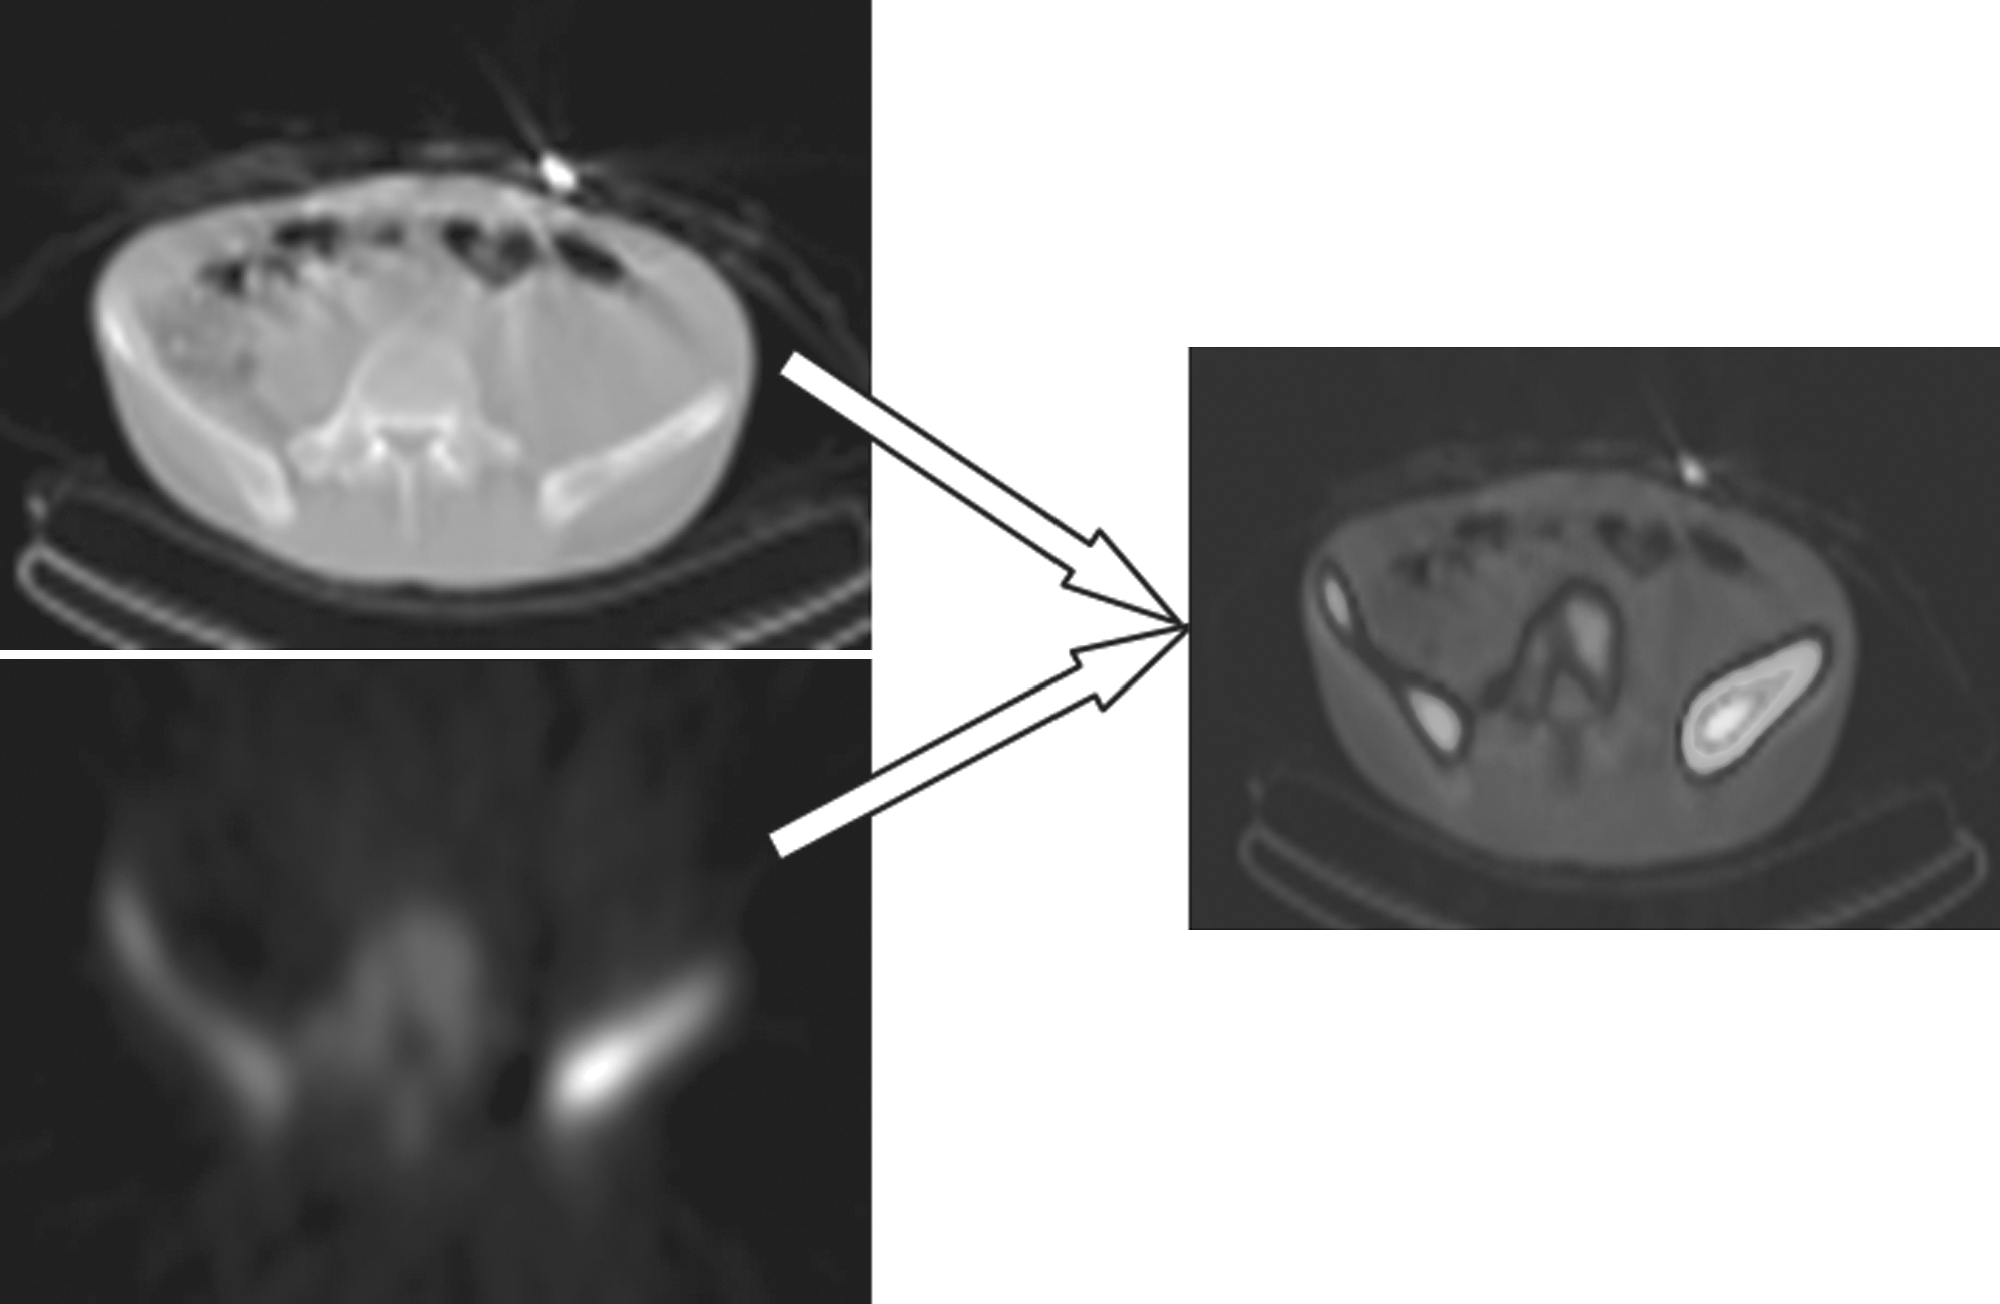
The fusion image of SPECT/CT scanning.
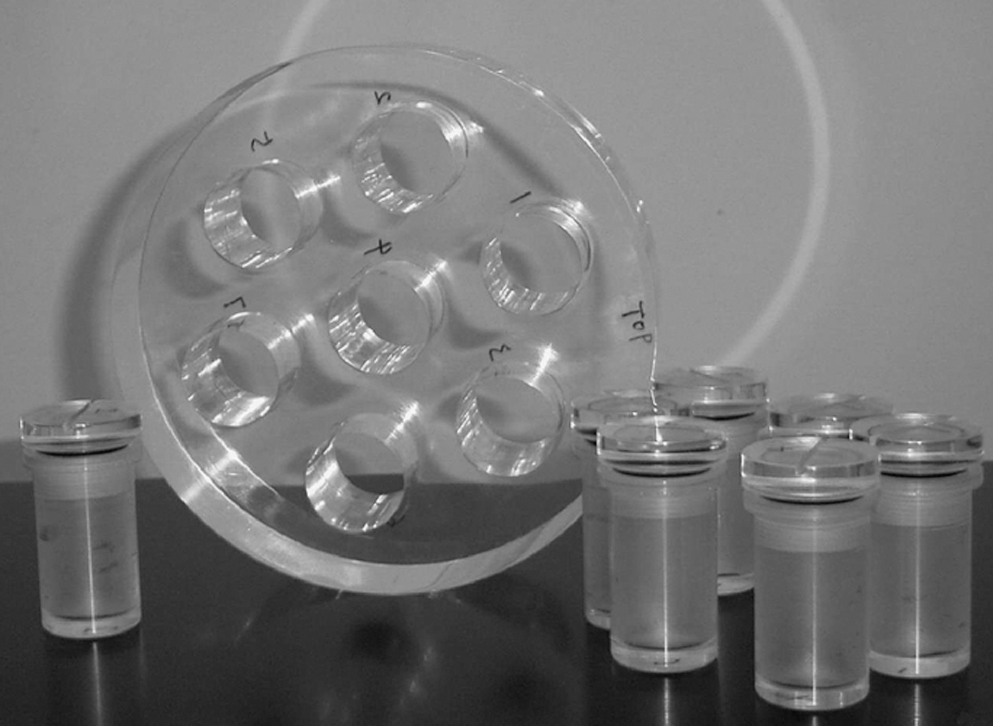
The self-made phantom for the radionuclide activity calibration of the SPECT image counts.
Results
We employed the MC program to calculate the S-value for 11 × 11 × 11 voxels of 153Sm. The calculation error was <1%. The results are shown in Table 2. The dose deposition in the source voxel is higher than that in the surrounding voxels. Further, the results show that the dose rate of the surrounding voxels decreased rapidly with increasing distance from source voxel, for example, the dose rate for the nearest voxel (x = 0, y = 1, z = 0) decreases to 2.4% of source voxel (1.07 mGy/[MBq S]), whereas in a more distant voxel (x = 0, y = 5, z = 0), it is just 2.33 E−05 of source voxel. Assuming that all the energy deposition of the particles is in local voxels, the dose rate distribution for gamma rays is 0.47 mGy/(MBq S), and the distribution for the beta particles and electrons is 1.64 mGy/(MBq S), which is approximately >53% of the S-value of the source voxel.
The typical iso-dose curves are shown in Figure 5. The sample of the fusion SPECT/CT transverse images are listed on the left, whereas in the diagrams on the right, the solid and dashed lines represent the iso-dose distributions normalized at the maximal dose rate point for S-value and direct MC calculations, respectively. In the region considered for calculation, the maximum dose rates were 5.98 × 10⁻⁵ and 6.26 × 10⁻⁵ mGy/(MBq S) for S-value and MC calculation, respectively. From the diagram, it can be seen that the iso-dose distributions for both methods matched each other in most regions and reasonably matched the fusion scan images. The calculation error for the maximum dose rate in these two methods was 4.5%, thus indicating that the S-value calculation results for the most voxels were ∼4.5% lower than the MC calculation results. This error can be attributed to the omission of dose contributions by source voxels falling outside the S-value calculation region, that is, outside the 11 × 11 × 11 voxels surrounding the target voxel in this study. Although the dose rate contribution of a single source voxel outside the calculation region is negligible, the high number of source voxels outside the calculation region resulted in the lower S-value calculation. In the diagram, a small difference in the iso-dose distributions for a few voxels is evident for the two methods of calculation; this may be causing the MC dose calculation for heterogeneous tissue.
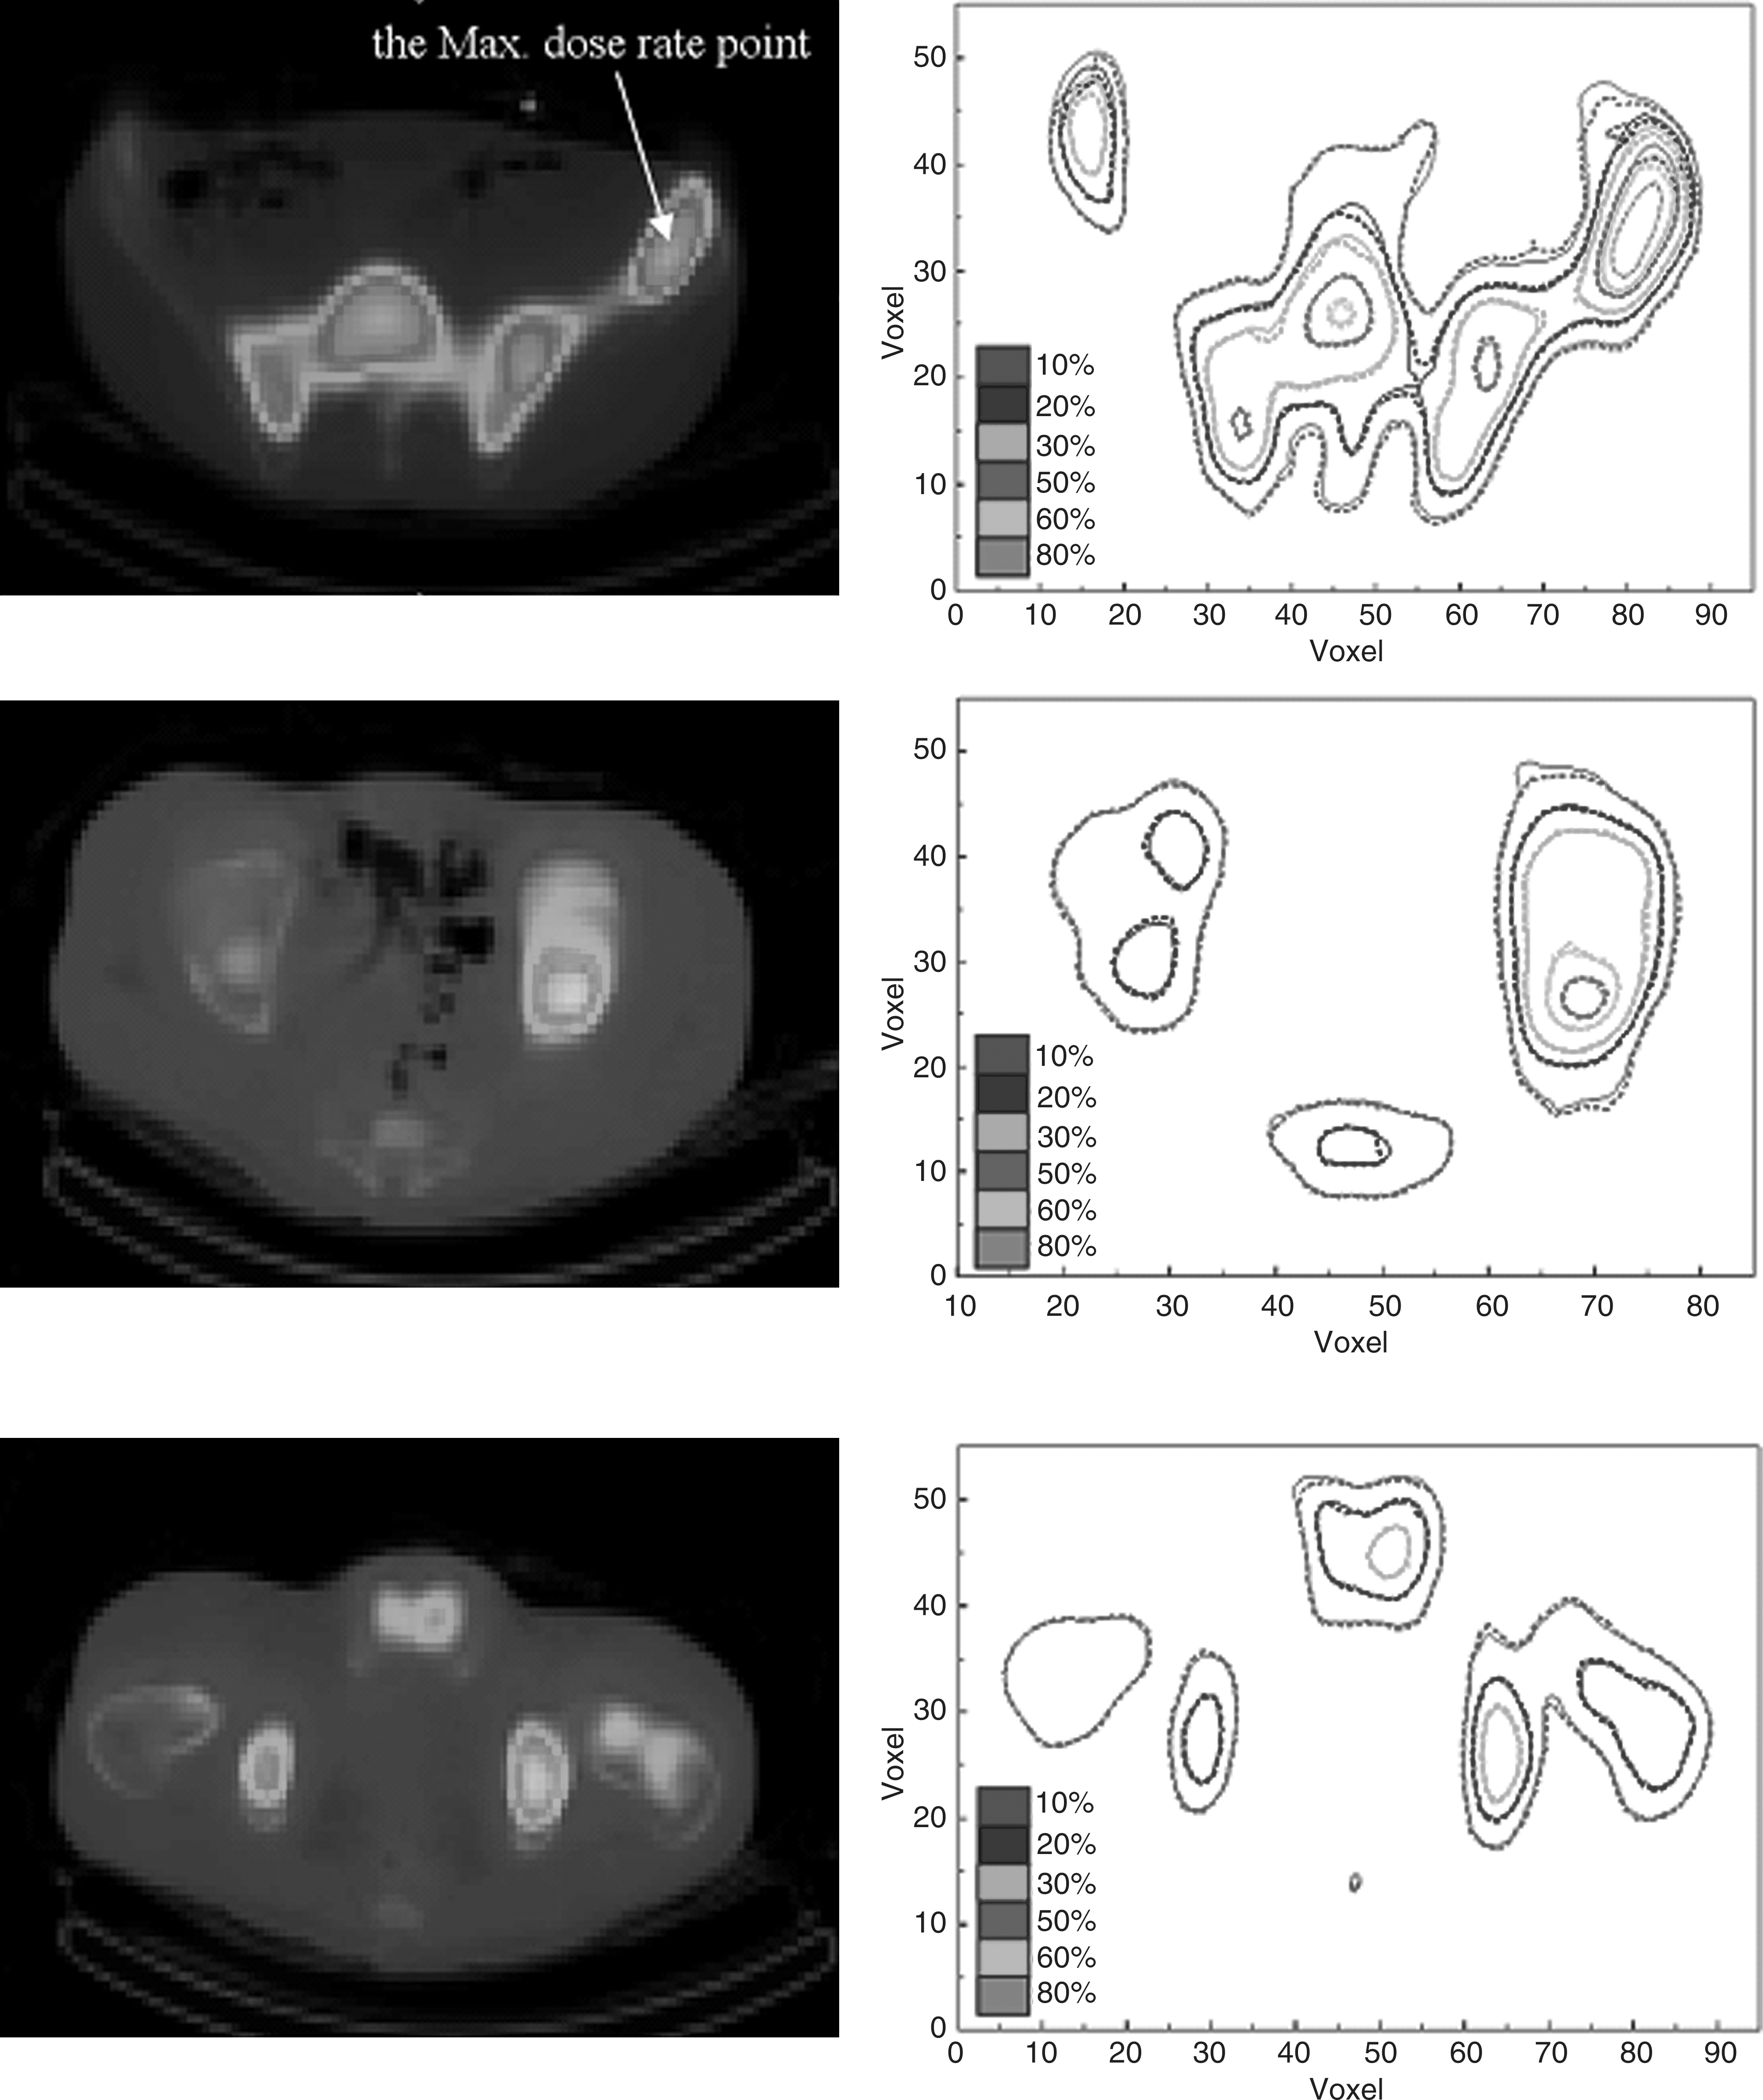
Iso-dose curves of fusion images of different transverse planes. In the right diagrams, the solid and dashed lines represent the results of the S-value and Monte Carlo calculation.
Figure 6 indicates the dose rate volume histogram (DVH) of the ROIs for S-value calculation. The bone and the total volumes of the whole calculation region were chosen to be the ROIs; the y-coordinate indicates relative volume, normalized to the whole volume of interest, whereas the x-coordinate indicates the relative dose rate normalized to the maximum dose rate point. In the figure, the lines with circles and triangles represent the DVH for bone and total volume, respectively. It indicates that the dose distributions of ROIs were nonuniform, that is, 30.0% of the bone volume received just 10% of the maximum dose rate, whereas only 3.8% of the bone volume received 50% of the maximum dose rate.
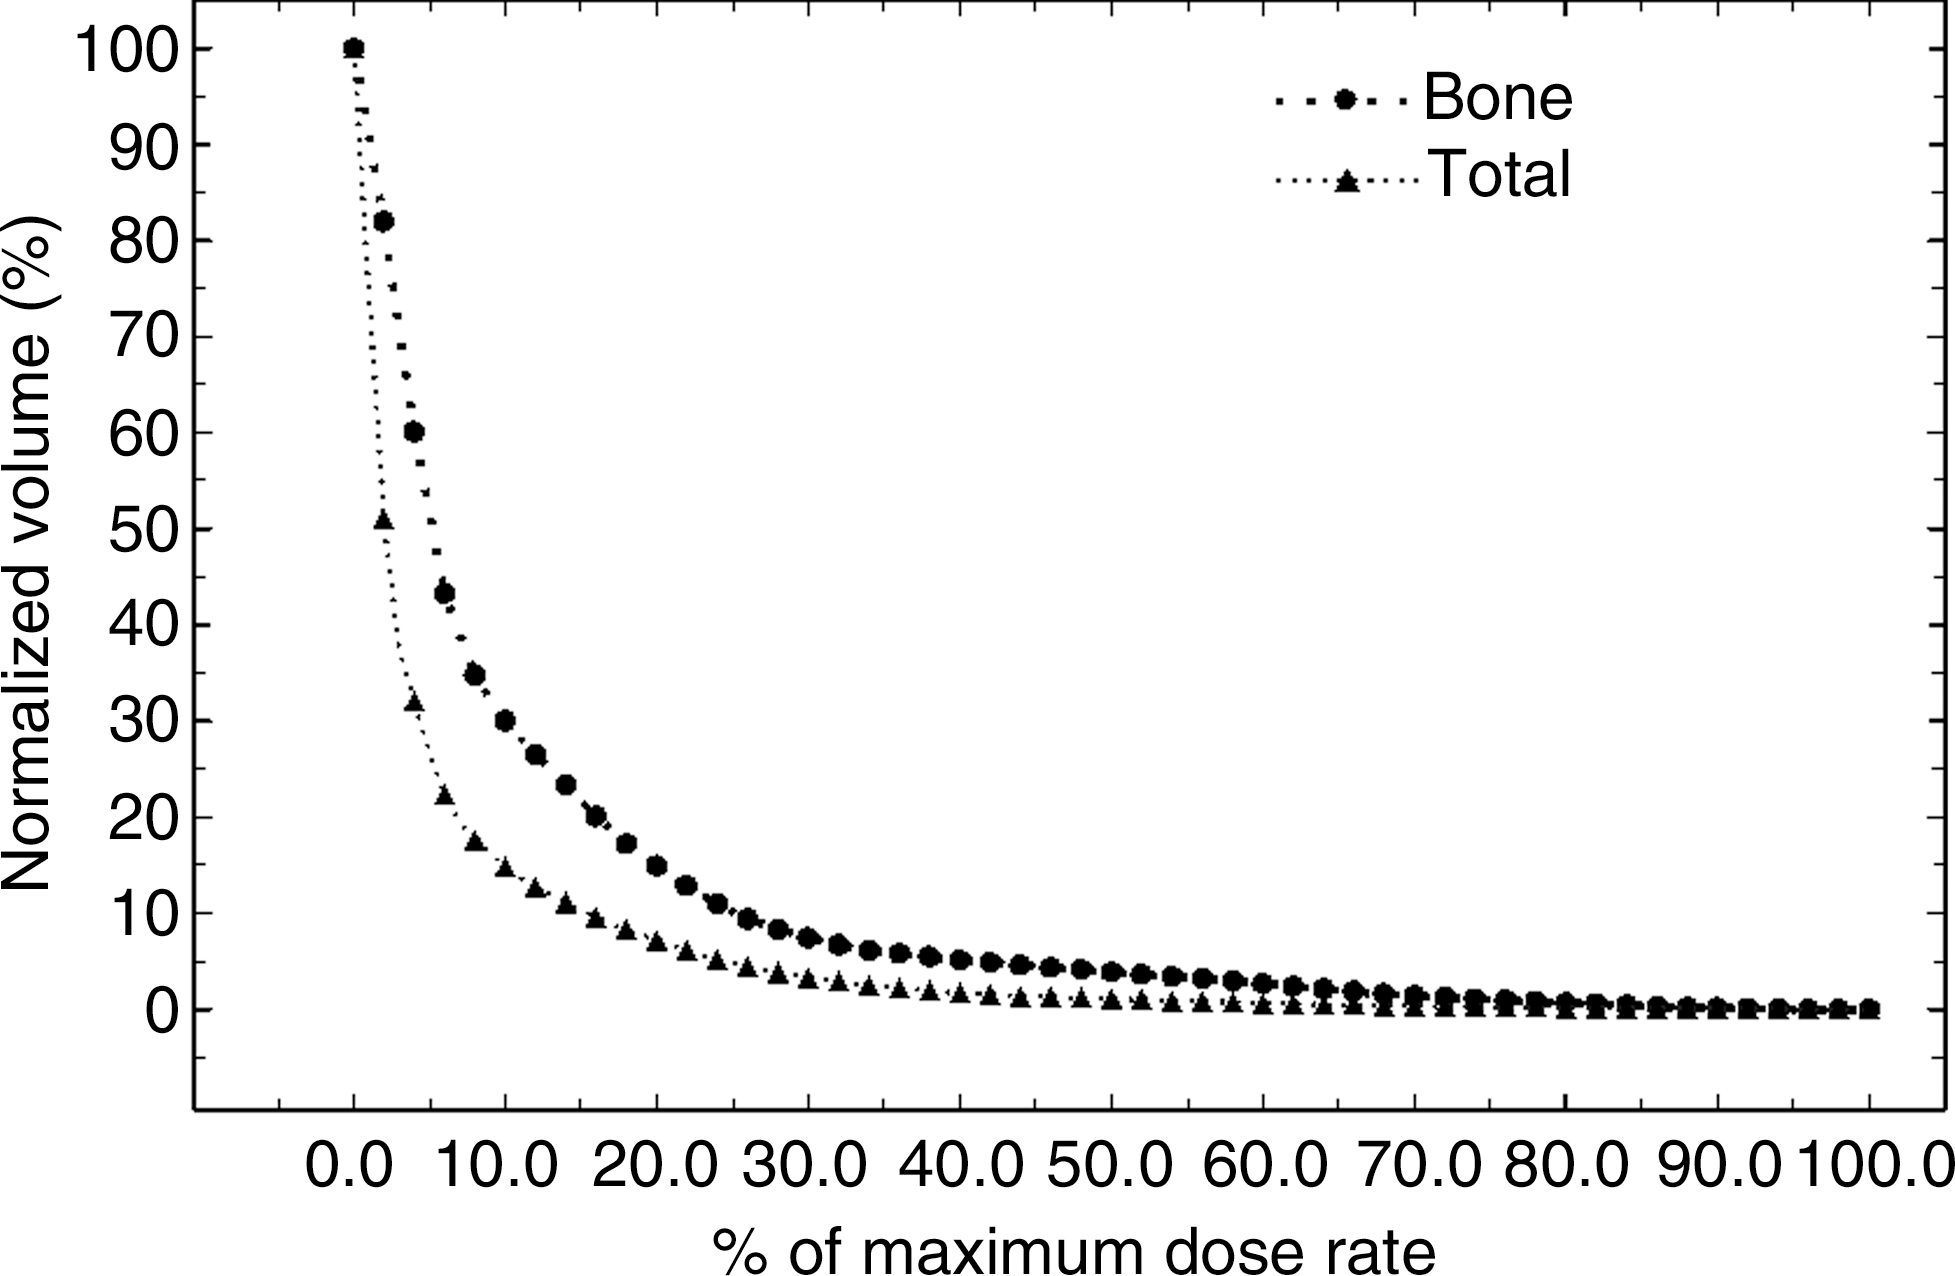
The dose rate volume histogram (DVH) of S-value calculation. The circle-point and triangle-point lines indicate the DVH of the bone and the total volume of the whole calculation region, respectively.
It must be noted that this computation refers to the dose rate for a particular period—6 hours after injection of the nuclide. To comprehensively calculate the cumulative doses following injection, a pharmacodynamic analysis must be performed by documenting the radionuclide output through the urine, etc. Such data would be imperative in all cumulative dosimetry calculations.
Discussion
The MIRD 17 report provides a method of computing the 3D dosimetry based on voxel S-values pertaining to therapeutic application of nuclides such as 131I, 32P, and 90Y. Compared with the MC method, our method of computation is simple and rapid, making it highly suitable for real-time applications in calculating the 3D dosimetry for individual patients. Thus, it presents a great practical value for the clinical application of radionuclides. However, there are certain shortcomings in calculating the S-value–based 3D dosimetry: because of the inherent assumptions for uniform tissue, the computation is only suitable for use in a uniform medium (such as soft tissue)—obviously, this is a deviation from real life applications. Moreover, even for uniform tissue, the S-value method of computation is limited to contributions from a strictly defined number of voxels surrounding the target voxel, resulting in an “interceptive error”; dose variations may be considerable for different media. These shortcomings notwithstanding, this method provides a convenient and prompt method for calculating 3D dosimetry. We also computed the S-values for 153Sm according to the MC method, which provided a useful reference for calculating 3D dosimetry for the clinical application of 153Sm. This article documents an initial attempt at calculating the 3D absorbed dose rate in a clinical setting, wherein the S-value–based calculations were acceptably accurate when compared with the results of a direct MC calculation.
In this study, the S-value–based computation has been applied to a specified resolution of scanned images; however, in vivo, radionuclide distributions may be vastly different and nonuniform. Thus, when the scanned image of the ROI approaches higher resolutions (e.g., 1 × 1 × 1 mm3), the dose within specified volumes inside the patient may be highly heterogeneous, especially in regions with varying concentrations of the radionuclide. Thus, whether for S-value–based or MC-based calculations, further precision in calculating 3D dosimetry for therapeutic applications of radionuclides would rely on enhanced resolution for medical imaging.
Although MC calculations are more accurate than the S-value method, especially in nonuniform media, the method is too time consuming in a busy clinic. 11 –15 In contrast, the S-value approach of using personal computers for rapid, real-time calculations of the absorbed dose seems to be feasible even in a busy clinic. To gauge the feasibility of this pilot study and to fully exploit its potential, in-depth comparisons of our semiquantitative method with other strictly empirical methods for clinical use are necessary. Further, a lot of effort is still required for computing the cumulative dosimetry based on scanned 3D images, necessary for calculating the cumulative dosimetry with the pharmacodynamic parameters. 16 –18
NPC is endemic in the Chinese population and osteoblastic bone metastases do occur. 19 Although osteoblastic bone metastases are less common than those arising from prostate cancer, the number of NPC patients treated by radionuclides has hitherto been disproportionately small, 20 even in endemic areas. 21,22 Despite the radiosensitivity and radiocurability of NPC, the palliative effect of 153Sm on bone metastases of NPC has been less well documented than prostate or breast cancers. The disparity is most likely due to the remarkable difference in prevalence of NPC between China and Western countries—in the past decades, resources dedicated to such research on palliation in China were probably less than optimal. Nevertheless, as NPC is endemic in the Chinese, a better documentation of the effective dose of 153Sm should be undertaken to ensure that, in the near future, appropriate use of available resources for palliative work on NPC could be based on the true effectiveness of 153Sm treatment. As the dose required for NPC is likely to be significantly lower than that required for breast or prostate cancers, the safety margin for 153Sm as applied to NPC may well be higher. In this way, the application of 153Sm is likely to be enhanced for treatment of NPC bone metastases.
Conclusions
As a preferred radiopharmaceutical for bone metastases, 153Sm is usually prescribed empirically. As even the recommended dose of 37 MBq/kg does have myelotoxicities, we attempted to supplement the current dosimetry methodology at the image level with a pragmatic and real-time dosimetry calculation based on functional imaging. Our method seems feasible even in a busy clinic managing a heavy load of patients. As NPC is endemic in the Chinese, much more work is called for to compare this semiquantitative method with the strictly empirical methods currently in use, which might result in a significantly lower yet effective dosing for NPC patients suffering from bone metastases.
Footnotes
Acknowledgments
This work was supported by the National Natural Science Foundation of China (no. 10675175).
Disclosure Statement
No competing financial interests exist.