
Abstract
The purpose of this study was to evaluate the consistency of 3′-deoxy-3′[18F]fluorothymidine (FLT) standardized uptake values (SUVs) over the time course of imaging in head and neck cancer. Thirteen (13) subjects (all male; age: 56.9 ± 6.7 years) with squamous cell head and neck cancer, stage III/IV, were administered FLT and imaged dynamically for 1 hour over the tumor and then underwent whole-body (WB) imaging commencing at 74 ± 6 minutes. Imaging was repeated after 5 days of radiotherapy (10 Gy) and a single course of platinum-based chemotherapy. Volumes-of-interest (VOIs) were created on the last dynamic frame (SUV60). The pretherapy WB and midtherapy images were coregistered to the dynamic sequence and VOIs were applied. Mean and maximum SUVs (SUV60 and SUVWB) and the change with treatment were evaluated. The correlations (Spearman's ρ) between SUV60 and SUVWB for all VOIs (pre- and midtherapy, n = 108 data pairs) were 0.98 for mean and 0.97 for maximum SUVs (p < 0.0001). Average absolute differences between SUV60 and SUVWB were 0.18 ± 0.15 and 0.29 ± 0.32 SUV units, respectively. Correlations (Spearman's ρ) between the change in SUV with therapy were 0.90 for mean and 0.89 for maximum SUV (p < 0.0001), with differences in the change values averaging 0.03 ± 0.36 and −0.17 ± 0.57 units, respectively. FLT SUVs are stable and comparable for images initiated between 55 and 100 minutes postinjection whether acquired pre- or midtherapy in head and neck cancer.
Introduction
3′-Deoxy-3′-[18F]fluorothymidine (FLT) has been documented to be an effective marker for DNA replication and active cellular proliferation, 1 with utility in a number of tumor types for the monitoring of the response to treatment. 2 –6 However, an effective clinical tool requires timing flexibility, patient-to-patient consistency, and uptake stability in addition to proven utility for the monitoring of a particular physiologic process. With these considerations, it was the objective of this study to investigate the stability of FLT standardized uptake values (SUVs) over the time course of imaging in head and neck cancer. In a previous report, the relationships between the influx rate constants, K FLT (derived from the two tissue compartment model) and K Patlak, and the SUV were explored. 7 In the present study, the stability of FLT uptake was examined by comparing the SUV for head and neck tumors determined during a dynamic acquisition versus a later whole-body (WB) acquisition both prior to and midtherapy. Examination of this consistency is important for two reasons—first, to determine the optimal time window to image FLT in head and neck cancer patients, and second, to determine the stability of this window for consistency in monitoring the response to therapy.
Methods
Thirteen (13) subjects (all male; age: 56.9 ± 6.7, range: 45–69 years) with histologically proven squamous cell head and neck cancer, stage III or IV, scheduled to undergo definitive concurrent chemoradiation therapy were enrolled in this study. The primary tumor was moderately differentiated in 7 subjects, poorly differentiated in 3 subjects, undifferentiated in 1 subject, and of unknown differentiation in 2 subjects. Subjects were excluded if they had significant liver, kidney, or marrow dysfunction or previous (within 4–6 weeks prior) chemoradiation therapy. Subjects underwent FLT positron emission tomography (PET) imaging within 30 days prior to the start of treatment (pretherapy scan) and after 5 days of radiotherapy and a single course of a platinum-based chemotherapy (midtherapy scan). Chemotherapy regimens included cisplatinum plus paclitaxel in 8 subjects, carboplatinum plus paclitaxel in 2 subjects, and high-dose cisplatinum only in 3 subjects. All midtherapy FLT PET scans were performed after the fifth and before the sixth radiotherapy fraction, which corresponded to 10 Gy of a prescribed dose of 70 Gy (with the exception of 2 subjects who received 11 Gy administered in five fractions). The time between the fifth treatment and FLT imaging was 3 days or less. Only subjects with complete pre- and midtherapy dynamic and WB imaging were included in these analyses. This research study was approved by the local institutional review board and each subject provided written, informed consent.
The FLT PET image acquisition parameters and a portion of the dynamic data have been reported previously. 7 In summary, dynamic imaging of the neck was obtained for 60 minutes on a Siemens ECAT EXACT HR + PET scanner (Siemens Medical Solutions USA) after the administration of 2.6 MBq/kg (0.07 mCi/kg) of FLT (maximum dose = 185 MBq [5 mCi]). Dynamic image acquisition was followed by WB image acquisition from skull base to proximal thighs obtained at 74 ± 6 minutes (range: 66–100 minutes) postinitiation of the FLT infusion. This time interval was variable because of the requirement for the subject to void between the dynamic and WB imaging to reduce the bladder activity. Dynamic and WB images were iteratively reconstructed (2 iterations/8 subsets, Gaussian 8.0 mm, zoom = 1.2). Time activity curves (TACs) were constructed for volumes-of-interest (VOIs) within the dynamic scan field-of-view using the PMOD Image Display and Analysis functions (PVIEW) and image fusion (PFUS) tools (version 3.0; PMOD Technologies Ltd.). VOIs employing a 50% maximum activity threshold were created by placing a bounding box around the primary tumor and all FLT-avid nodes on the last frame (i.e., 55–60 minutes) of the pretherapy dynamic images (SUV60). Mean SUVs were calculated by averaging all pixel values within the VOI, whereas the maximum SUVs were equivalent to the maximum pixel value within the entire volume. The midtherapy dynamic and the pretherapy and midtherapy WB images (i.e., SUVWB with imaging commencing at 66–100 minutes poststart of FLT infusion) were coregistered to the pretherapy dynamic images and the same VOIs were applied to all datasets. Fifty-four (54) primary tumors or FLT-avid neck nodes were identified in the pretherapy images of the 13 subjects from whom 108 dynamic and WB SUV pairs were available for analysis.
Results
The correlations (Spearman's ρ) between SUV60 and SUVWB for all VOIs (pre- and midtherapy, n = 108 data pairs) were 0.98 for mean and 0.97 for maximum SUVs (p < 0.0001). There were no significant differences between the linear relationship between SUV60 and SUVWB whether derived from pre- or midtherapy data (Figure 1 and Table 1). The average differences (defined as SUVWB − SUV60) and the average absolute differences were −0.04 ± 0.23 (p = 0.12) and 0.18 ± 0.15 for mean SUVs and 0.11 ± 0.42 (p = 0.01) and 0.29 ± 0.32 SUV units for maximum SUVs, respectively. The correlations (Spearman's ρ) between the change in SUV with therapy as determined by the SUV60 and SUVWB were 0.90 for mean and 0.89 for maximum SUV (p < 0.0001). Differences in the change values ([midtherapy SUVWB − pretherapy SUVWB] − [midtherapy SUV60 − pretherapy SUV60]) were 0.03 ± 0.36 (p = 0.6) and −0.17 ± 0.57 (p = 0.04) units for mean and maximum SUVs, respectively.
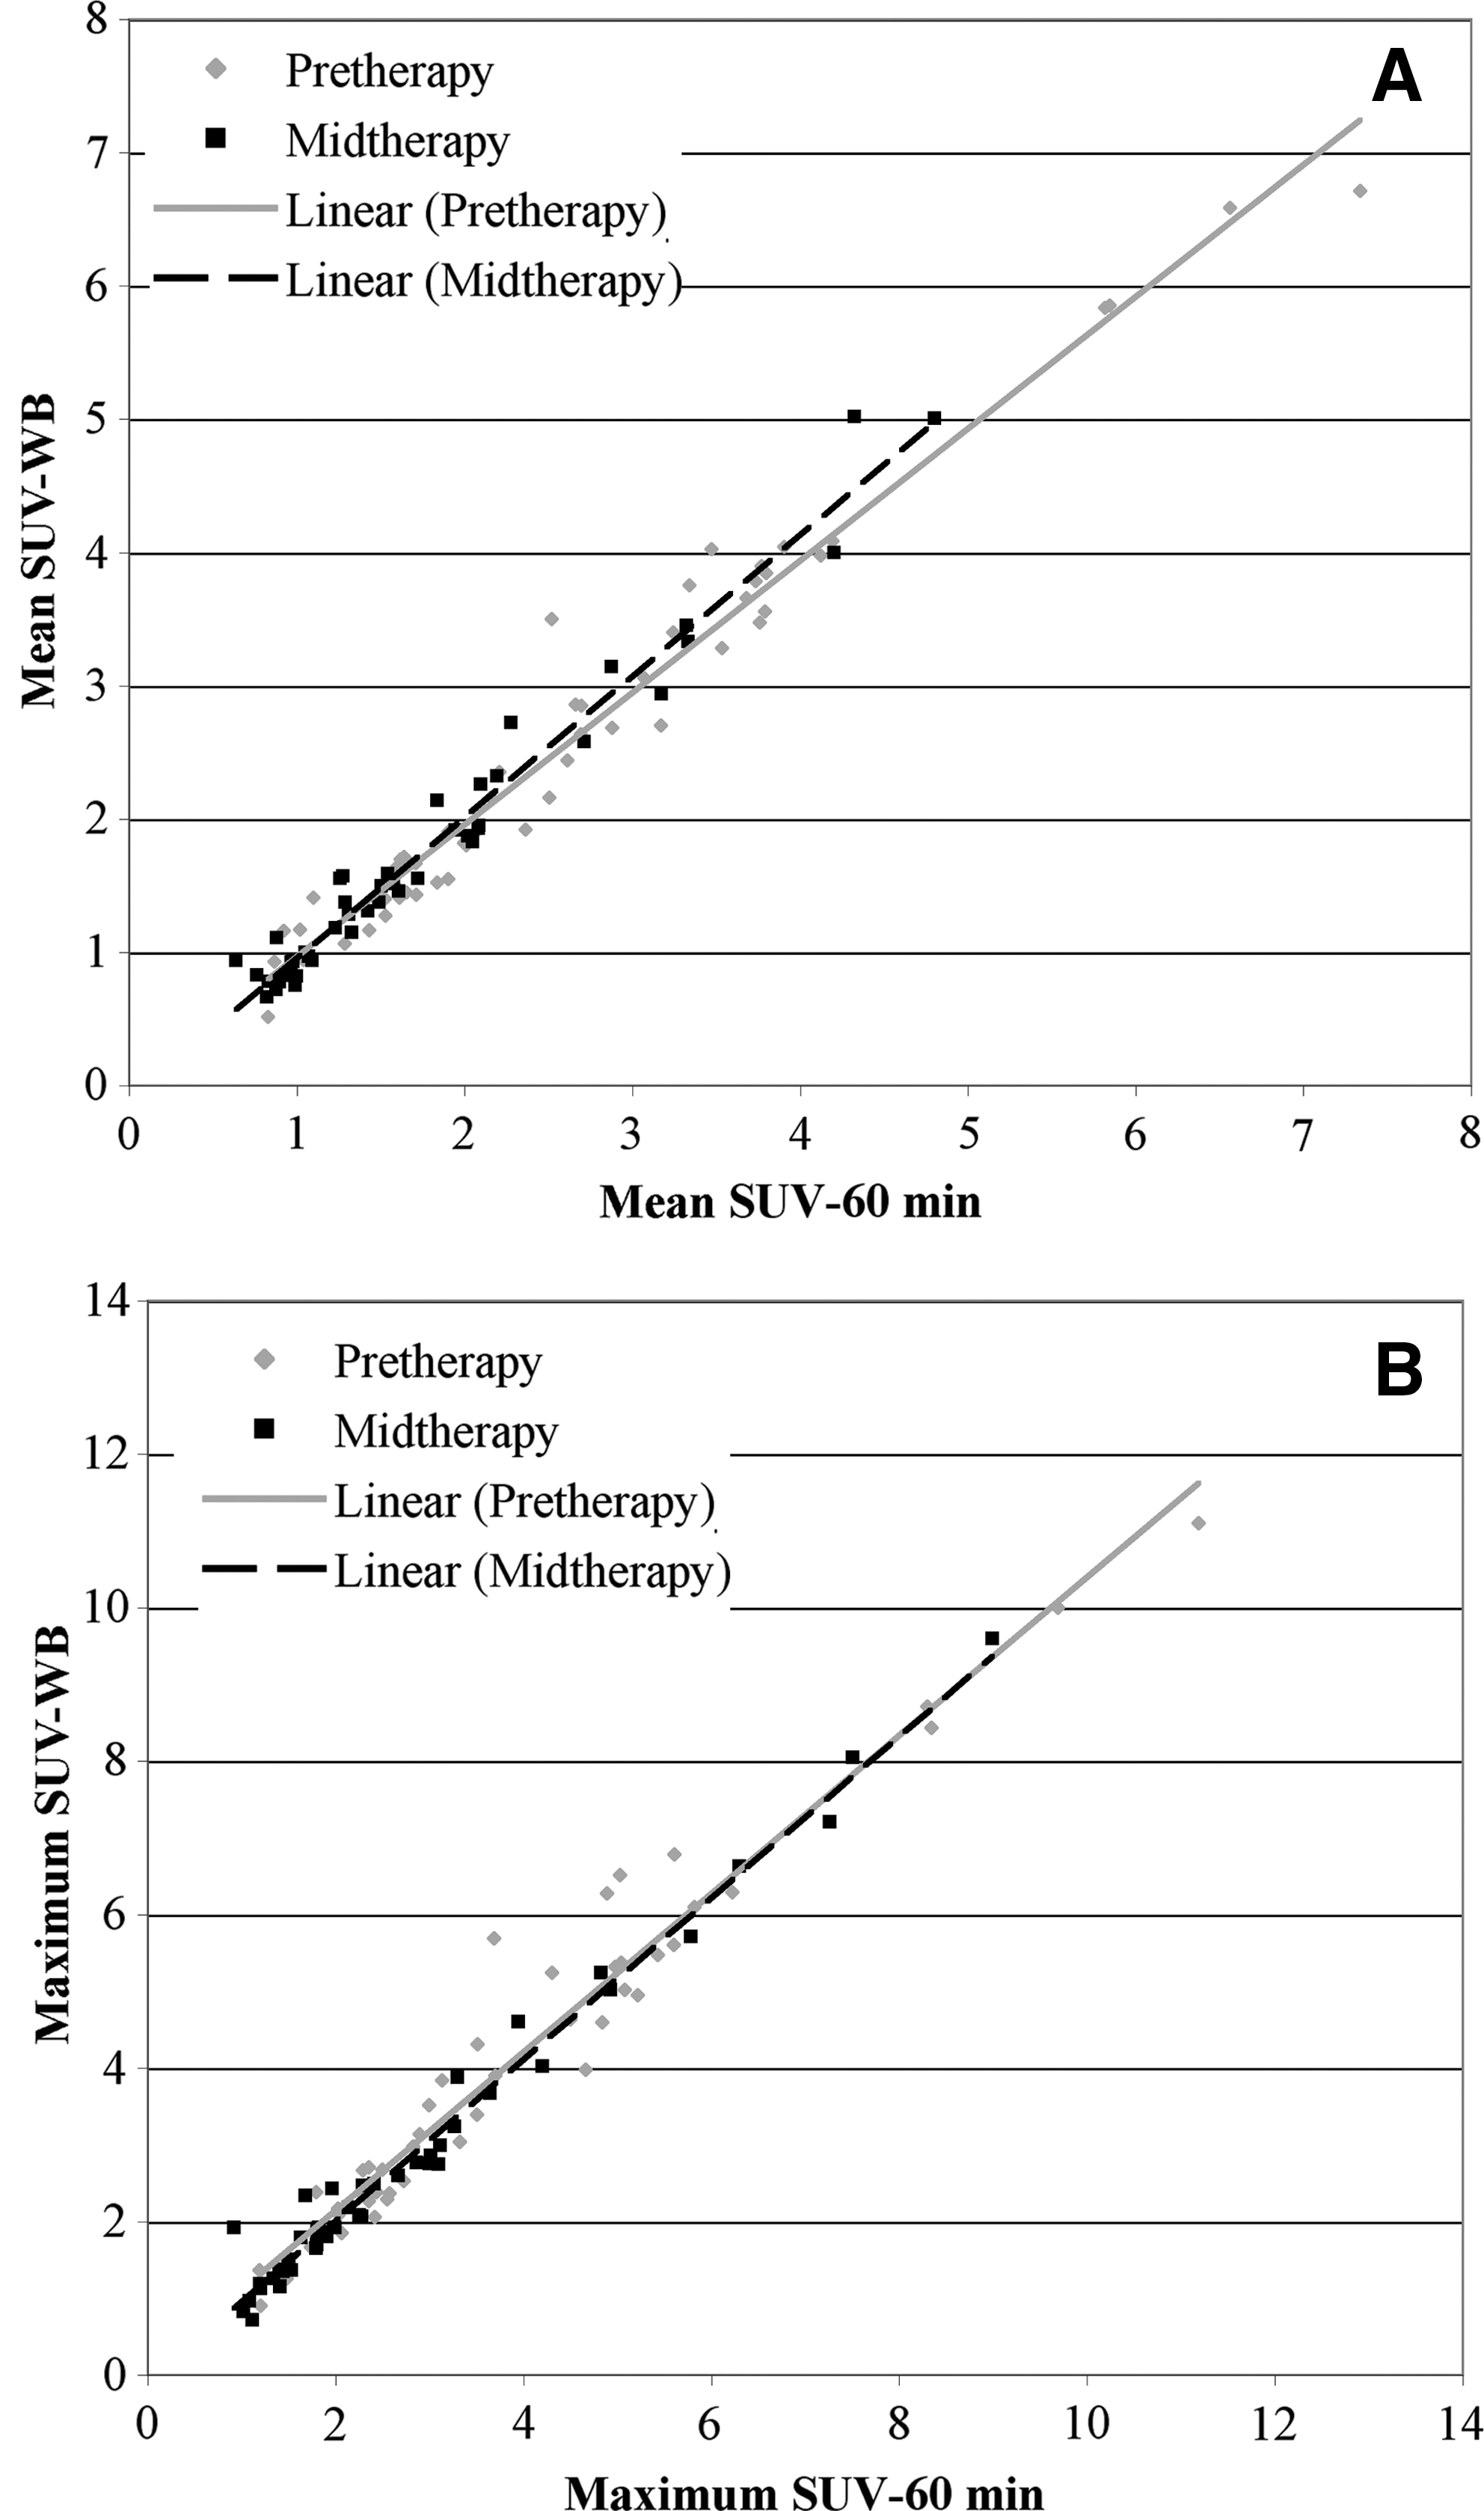
Comparison of the mean (
SUV, standardized uptake values; WB, whole-body.
Conclusions
In head and neck cancer, it has been documented that a strong correlation exists between the mean and maximum SUV60 and the influx parameters, K FLT (0.92 and 0.89, respectively) and K Patlak (0.99 and 0.97, respectively), when these parameters are determined with data incorporating full arterial sampling. 7 In addition, based on TACs acquired over a period of 60 minutes, static imaging should not begin before 45 minutes. This conclusion was based on the determination of the earliest time at which the scans for all subjects, both pretherapy and midtherapy, exhibited an FLT concentration within ± 10% of the apparent plateau level at the end of the dynamic imaging (i.e., 60 minutes). 7 However, the stability of the SUVs at later time points, as would be seen with WB imaging, was not investigated. In the present investigation, it was found that FLT SUVs (both mean and maximum) are stable and comparable for imaging initiated between 55 and 100 minutes postinjection whether images are acquired pre- or midtherapy. The maximum SUV and the change in maximum SUV exhibited statistically significant differences between the dynamic and WB time points. However, there is little clinical relevance in 0.1 unit difference in SUV (3.25 vs. 3.36) or a change difference of 0.2 SUV units (−1.23 vs. −1.40), especially in light of the fact that these values are based on a single pixel and possibly not the same pixel at the various time points.
The level of consistency found in this investigation between subjects and therapeutic states and the stability over time provides support for the clinical application of FLT imaging in the monitoring of the response to therapy in head and neck cancer. Similar types of analyses, designed to ascertain the potential for the simplification of imaging procedures without the loss of critical information content, will be needed to facilitate the clinical application of this agent in other types of cancers.
Footnotes
Acknowledgments
This research was funded in part by the National Institutes of Health (grant 1R21 CA130281-01) and the University of Iowa Carver College of Medicine and Holden Comprehensive Cancer Center. The authors acknowledge the efforts of the University of Iowa PET Imaging Center's technical staff (John Richmond, Christine Mundt, Dean Clermont, Julie Riggert, Beth Johnson, Beth Schmitt, and Kelli Schlarbaum), clinical research nurses (Jo Clark and Jane Hershberger), Kathy Thede-Reynolds, and Kellie Bodeker in making this research possible.
Disclosure Statement
None of the authors have any competing financial conflicts of interest.