
Abstract
Matrix metalloproteinases (MMPs) are principal participants in tumor development. In addition to serve as a useful biochemical marker, MMP expression may also provide a target for the diagnostic in vivo imaging of tumors, using a radiolabeled inhibitor. This study investigates the use of membrane type 1 (MT1)-MMP as target for in vivo tumor diagnosis. Specific binding of the endogenous tissue inhibitor of metalloproteinase-2 (TIMP-2) to MT1-MMP has been previously described. In this study, biodistribution and imaging experiments were performed on MT1-MMP–overexpressing (S.1.5) and control (C.IV.3) tumor-inoculated mice using [123I]-recombinant human TIMP-2 (rhTIMP-2) as radioligand and [123I]-rhTIMP-1 as control. The expression profile was controlled in vitro and on tumor extracts. rhTIMP-2 as well as rhTIMP-1 were labeled using the Iodogen method and characterized. Biodistribution of [123I]-rhTIMP-2 showed a tumor uptake of 2.87% ± 1.58% ID/g at 3 hours postinjection in S.1.5. Tumor values of [123I]-rhTIMP-1 and [123I]-rhTIMP-2 evaluated in S.1.5 and C.IV.3, respectively, were significantly lower. Planar imaging revealed significant uptake of [123I]-rhTIMP-2 in S.1.5 compared with contralateral background areas. This could not be observed in C.IV.3 and with [123I]-rhTIMP-1 in S.1.5. All tumors were well established (200–800 mg). These results suggest that rhTIMP-2 holds potential for development of radiotracers for in vivo imaging in overexpressing MT1-MMP but not in similar tumors that do not express this protease.
Introduction
Cells in tissue degrade and reconstitute the extracellular matrix at the periphery to carry out various cell functions. Extracellular matrix turnover is an integral part of normal and pathological processes, such as development, tissue remodeling, cell growth and differentiation, and invasion and metastasis. 1,2 Matrix metalloproteinases (MMPs) are the principal participants of matrix turnover 3 and are divided into six subgroups: collagenases, gelatinases, stromelysins, matrilysins, zinc- and calcium-dependent endopeptidases, and membrane type-MMPs (MT-MMPs). 4 Many of these enzymes are believed to play a key role in tissue remodeling associated with tumor cell invasion, metastatic dissemination, and angiogenesis. 1,5,6 Because of the direct relationship between MMP overproduction and tumor progression and prognosis, MMPs have been a major cancer drug target during the past decades, resulting in the development of a wide variety of metalloproteinase inhibitors (MMPIs). 7 Moreover, their overproduction by tumor tissue when compared with normal tissues also made them an attractive target for in vivo imaging. 2,5,6 Several attempts with radiolabeled MMPIs to detect tumor cells in vivo, however, have proven unsuccessful. 7 –9 Whether or not this relates to shortcomings of the used imaging probes or to the setup of the reported studies is currently unclear. 9 In addition to custom-made MMPIs, there have been limited attempts to use the specificity of tissue inhibitors of MMPs (TIMPs) to probe for the presence of active MMPs in tissues. TIMPs (TIMP 1–4) represent a family of natural secreted and soluble glycoproteins that inhibit MMP activity by formation of noncovalent binding with their catalytic binding site with high affinity (K d = 10−10 – 10−16 M). 4,10,11 In a small pilot study, 111In-DTPA-N-TIMP-2 was injected in 5 patients with Kaposi's sarcoma; no uptake in the malignancy could be observed. 12 However, Kaposi's sarcoma patients secrete MMP-2 and MMP-9, whereas the available data do not support the hypothesis that 111In-N-TIMP-2 specifically binds these proteases. 7 Given the well-documented high-affinity interaction between MT1-MMP and TIMP-2, this membrane-bound enzyme might be a more suitable candidate for imaging with TIMP-2. 7,9 MT1-MMP is of particular interest because it is essential for angiogenesis and tumor development in vitro as well as in vivo. 13 –15 As abundant presence of MT1-MMPs correlates with the degree of malignancy and metastasis in various tumor types, it is an attractive target for in vivo evaluation of tumor aggressiveness. 14,15 Accordingly, this study reports on the potential usefulness of [123I]-TIMP-2 for molecular imaging of MT1-MMP expression in an in vivo tumor model.
Materials and Methods
Recombinant human TIMP-2 and recombinant human TIMP-1
Production and purification of recombinant human TIMP-2 (rhTIMP-2), 21 kDa, was conducted as previously described. 16 rhTIMP-1, 29 kDa, was a kind gift from Prof. G. Murphy from the Department of Oncology, Cambridge University, Cambridge Institute for Medical Research. rhTIMP-1 served as negative control.
Cell culture
Two stable transfected A2058 melanoma clones were used: one transfected with the pcDNA3 (control plasmid) vector alone (clone C.IV.3) and one with the human MT1-MMP expression vector (pc3MT1800S) (clone S.1.5). Stable transfectants were maintained in supplemented Dulbecco's modified Eagle's medium containing G418 (500 μg/mL) (Invitrogen) as previously described. 17 All culture reagents were purchased from Lonza.
Immunocytochemical staining
MT1-MMP expression in the S.I.5 clone or control C.IV.3 clone was confirmed via indirect immunocytochemical staining of cells cultured as monolayers in four-well tissue culture chamber slides (Nunc Lab-Tek™). Staining was conducted using a Dako LSAB2 kit (Invitrogen) as described earlier. 18 Primary anti-active MT1-MMP was purchased from R&D. Individual green, red, and blue transmission images were collected using a Spot Insight B/W camera (model 3.1.0) in combination with a CRI Micro Color filter (model RGB-ELE) using spot software 3.5.9 for Windows. The individual color transmission images were merged in an RGB image using imageJ software. 19
Western blotting analysis of MT1-MMP in tumor tissue
In vivo expression of MT1-MMP was determined using Western blotting performed as previously described. 17,18 Briefly, samples of total cell extracts were resolved by sodium dodecyl sulfate–polyacrylamide gel electrophoresis (SDS-PAGE) under reducing conditions and proteins were transferred to polyvinylidine difluoride membranes (PVDF transfer membrane; Perkin Elmer). The membranes were exposed to primary antibodies (1/50,000) raised against the hemopexin domain of MT1-MMP (ascites liquid 3H3), kindly provided by M-C Rio (IGBMC), followed by a horseradish peroxidase-conjugated goat anti-mouse antibody (1/1000; Dako). Protein bands were visualized using an enhanced chemiluminescence kit (NEN), according to the manufacturer's instructions.
Enzyme-linked immunosorbent assay TIMP-2 quantification
TIMP-2 concentrations in tumor extracts of C.IV.3 and S.1.5 were determined using sandwich enzyme-linked immunosorbent assays (ELISAs) as previously described. 17 The sensitivity of this ELISA for TIMP-2 was 0.5 ng/mL and the concentration versus absorbance curve was linear in the 0.5–40 ng/mL range. Each sample was run in duplicate.
Synthesis of [123I]-rhTIMP-2 and [123I]-rhTIMP-1
Radiosynthesis was performed using the Iodogen technique as described by Haisma et al. 20 rhTIMP-2 in Tris buffer or rhTIMP-1 in 0.1 M phosphate-buffered saline (PBS) at pH 7.5 and Na123I (37–740 MBq dependent on the experiment) (Bristol-Meyers Squibb) were added to a Iodogen-coated vial. After 10 minutes at room temperature, [123I]-rhTIMP-2/[123I]-rhTIMP-1 were purified on a standard prepacked PD-10 size exclusion column (Amersham Pharmacia) using a 0.5% BSA (bovine serum albumin solution; Sigma) in PBS (referred to as PBS/BSA) as an eluting agent.
Characterization of [123I]-rhTIMP-2 and [123I]-rhTIMP-1
Instant thin-layer chromatography (ITLC) (Pall Corporation) eluted with 20 mM citric acid was performed to check radiochemical purity of the pooled fractions. Radiolabeled proteins were analyzed by SDS-PAGE, and radioactivity associated with the protein bands was measured using ImageQuant software of a Phosphor imaging system (Cyclone; Perkin Elmer). For determination of the purity of [123I]-rhTIMP-2 and [123I]-rhTIMP-1 after radiolabeling, analytic size-exclusion high-performance liquid chromatography was performed using a Shodex KW 802.5 column (7.8 × 300 mm; Thomson Instrument Company). In vitro stability of [123I]-rhTIMP-1 was assessed as previously described for [123I]-rhTIMP-2. 21 For affinity determination, scatchard analysis of [123I]-rhTIMP-2 was performed in triplicate on adherent S.1.5 and C.IV.3 cells. Nonspecific binding was determined using 100-fold molar excess of nonlabeled rhTIMP-2. Nonlinear regression and K d values were determined using GraphPad Prism Software 5.0.
In vivo studies
All procedures involving animals were in conformity with the regulations of the Belgian law and the local Ethical Committee (ECP02/36, ECP03/30, and ECD07/14).
Blood clearance studies
Pharmacokinetic studies were conducted by obtaining blood samples (10 μL) via tail bleeds at various time points after injection of 740 kBq of each of the radioiodinated proteins in 6–8-week-old Swiss nu/nu mice without tumor (n = 3). The data were fitted according to a two-phase exponential decay curve and half-lives were calculated using GraphPad Prism Software.
Biodistribution in S.1.5- and C.IV.3-inoculated mice
Four-week-old male Swiss nu/nu mice were injected subcutaneously in the flank with 5 × 10⁶ C.IV.3 or S.1.5 cells in serum-free medium, suspended in an equal volume of Matrigel (Becton Dickinson Labware). When the tumor reached a volume of ∼1 cm3 (3–4 weeks), the mice (n = 3–5) were used for biodistribution studies. Tumor weight ranged from 120 to 1000 mg (565 ± 287 mg). To study the in vivo specificity of tumor uptake, two separate experiments were performed. In the first, the uptake of [123I]-rhTIMP-2 was compared in a overexpressing tumor model (S.1.5) and a control tumor with minor MT1-MMP expression (C.IV.3). In the second experiment, uptake of [123I]-rhTIMP-2 in S.1.5 was compared with the uptake of [123I]-rhTIMP-1, a comparable endogenous inhibitor, not binding MT1-MMP. 21 About 0.74 MBq (0.5 μg, 200 μL) of [123I]-rhTIMP-2 or [123I]-rhTIMP-1 was intravenously injected in S.1.5- or C.IV.3-inoculated mice. After 1, 3, 6, 9, and 24 hours postinjection (p.i.), the mice were sacrificed by decapitation under isoflurane anesthesia. Blood was drawn, and tissue samples were dissected, washed, dried, weighed, and counted for radioactivity with a Cobra automated gamma counter (Cobra II Series; Canberra Packard). The injected dose (ID) was calculated by weighing the syringes before and after injection of the tracer and by the use of dilution series of the tracer solution, which was also weighed and counted for radioactivity. The concentration of radioactivity was decay corrected and percentage of ID per gram (% ID/g) was calculated for each organ.
Effect of absolute amount
To study the effect of amount of tracer, an additional experiment with 5 μg [123I]-rhTIMP-2 was performed. Twenty-four (24) hours after injection of 37 MBq [123I]-rhTIMP-2 or [123I]-rhTIMP-1, mice bearing S.1.5 of C.IV.3 tumors were sacrificed and radioactivity distribution in blood, tumor, and organs was measured as described earlier.
Metabolite analysis and in vivo blood stability
S.1.5-inoculated mice were injected intravenously (i.v.) with 1.85 MBq [123I]-rhTIMP-2 and S.1.5 tumor tissue was excised 3 hours p.i. Tumor tissue was homogenized using a “potter grinder” and cold extraction buffer (Tris-HCl 0.05 M, NaCl 0.1 M, Tween 2%). All manipulations were performed on ice. The suspension was centrifuged and supernatant was collected. Blood samples, collected in ethylenediaminetetraacetic acid tubes, were centrifuged for 15 minutes at 6000 g. Different molecular weight (Mw) fragments in tumor homogenates and plasma samples were separated by size exclusion on a PD-10 column. The eluate was collected in fractions of 0.5 mL and counted for radioactivity. To validate the extraction procedure, blood and tumor samples from noninjected mice (n = 3) were spiked with 37 kBq of the labeled compound, after which the same procedure was conducted. The extraction yield is expressed as percentage of total radioactivity recovered in the supernatant. In addition, a plasma sample was examined by SDS-PAGE on a 15% polyacrylamide gel to determine the origin of Mw fractions.
Planar gamma imaging
Nu/nu athymic mice bearing well-established S.1.5 or C.IV.3 tumors (1 cm3) under the forepaw (n = 3–5) were tail-vein injected with 37 MBq (5 μg) 123I tracer. All mice received 0.1% NaI in their drinking water 24 hours prior to injection of the tracer to prevent thyroid uptake of free iodine. During all imaging experiments, the animals were anesthetized with isoflurane (induction 5%, maintenance 1%–2% by inhalation) and placed in a prone position. At 1, 6, and 24 hours p.i., images were acquired using a Prism 3000XP Single-Photon Emission Computed Tomography camera equipped with a high-resolution parallel-hole collimator. All images were acquired into 256 × 256 matrices (FOV: 23.5 × 12.46 cm), with a photopeak window set at 15% around 159 keV, and processed with a HERMES image process system. Regions of interest were drawn and mean tumor-to-contralateral background ratios were calculated for all animals. Image time was corrected for radioactivity decay of [123I] and equal intensity is shown for comparison. At the end of the experiment, all mice were sacrificed and dissected.
Statistical analysis
Experimental data of biodistribution and imaging experiments were analyzed with GraphPad Prism software. Data are expressed as mean ± standard deviation and statistical significance of differences between [123I]-rhTIMP-2 and [123I]-rhTIMP-1 and between uptake in S.1.5 and C.IV.3 tumors was analyzed by a nonparametric Mann–Whitney U-test. A p-value of <0.05 was considered significantly different.
Results
Characterization of the used cell lines
Immunocytochemical staining of MT1-MMP on cells cultured in chamber slides showed specific staining of S.1.5 cell membranes and almost no membrane staining on C.IV.3 cells (Fig. 1A). As the cells were not permeabilized, only membrane-expressed MT1-MMP was detected. To confirm the in vivo expression, Western blotting was performed on tumor tissue. Both 63 and 60 kDa bands, corresponding to pro-MT1-MMP and an active form of MT1-MMP, respectively, were detected at higher levels in clone S.1.5. A similar profile of MT1-MMP was observed in vitro using S.1.5 cells (Fig. 1B). A larger band of 43 kDa was detected in both S.1.5 tumor and cell extracts; this is a cell-surface associated inactive form that results from MMP-dependent processing of the 60 kDa form. 21 In the cell extracts, this band is more abundant, most probably because of the heterogeneity of the tumor mass, existing from tumor cells, combined with tumoral fibroblast and other stroma cells.
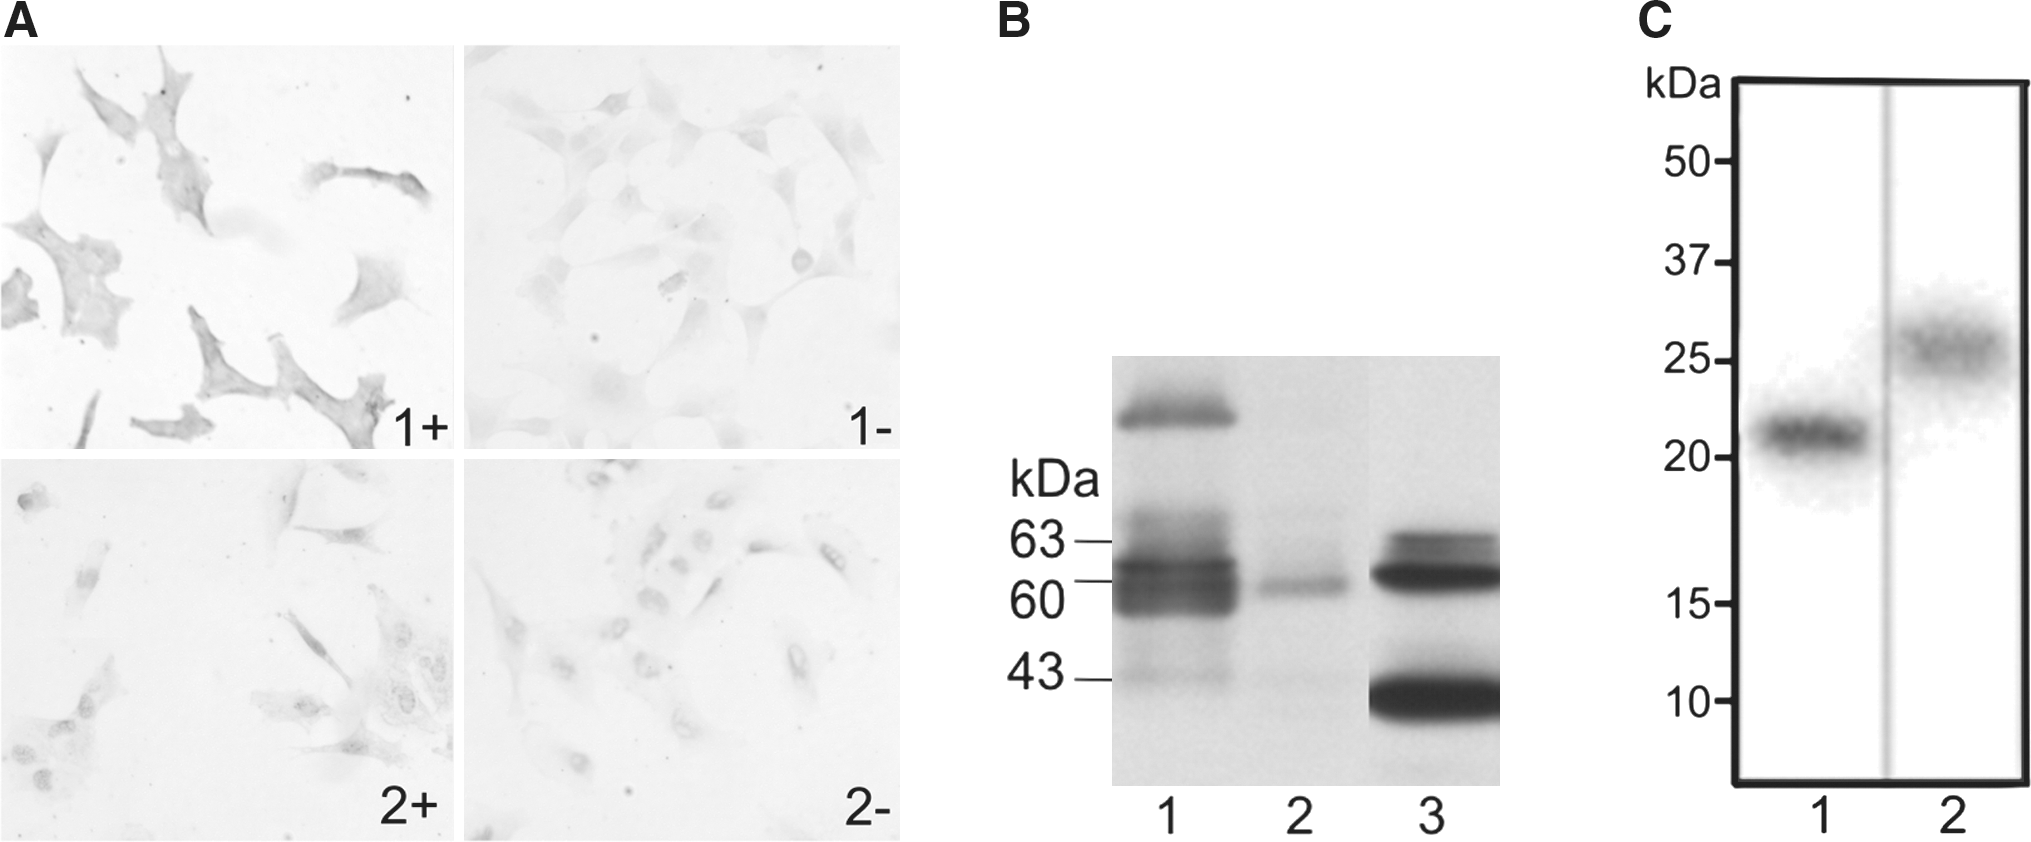
Analysis of MT1-MMP expression in a A2058 clone transfected with control vector (C.IV.3) and a clone transfected with MT1-MMP cDNA (S.1.5).
Radiolabeling and quality control
The overall radiochemical yield was 68% ± 13.0% and 66% ± 7.5% for [123I]-rhTIMP-2 and [123I]-rhTIMP-1, respectively. High specific activities were obtained, ranging from 24 to 240 GBq/μmol. Radiochemical purity of the [123I] tracers recovered at the end of synthesis was ≥98% as determined by ITLC and radio-high-performance liquid chromatography. Protein integrity was also demonstrated by analyzing the radioactivity after SDS-PAGE separation. Electrophoresis of the radiolabeled proteins showed >99% of the total radioactivity associated with the protein band of M r ∼ 21,000 for rhTIMP-2 (Fig. 1C, lane 1) or M r ∼ 29,000 for rhTIMP-1 (Fig. 1C, lane 2). Radiochemical stability of [123I]-rhTIMP-1 was >90% up to a 24 hours incubation period in PBS or Dulbecco's modified Eagle's growth medium as determined by ITLC analysis. After 24 hours in mouse serum at 37°C, a loss of 20% of the radiolabel could be observed. These results are comparable to those of [123I]-rhTIMP-2, published earlier. 21 Scatchard analysis of [123I]-rhTIMP-2 on adherent S.1.5 cells was performed resulting in a K d of 1.18 ± 0.11 nM and a B max of 83.60 fmol/cell. As expected, for C.IV.3 and the control protein [123I]-rhTIMP-1 no specific binding could be shown.
Enzyme-linked immunosorbent assay
TIMP-2 is an endogenous inhibitor of all MMPs. The presence of host TIMP-2 might influence the tumor uptake by competition. ELISA analysis was performed in duplicate and revealed a TIMP-2 concentration ranging from 56.8 to 89.6 ng/mL in C.IV.3 tumors and from 115.5 to 154.8 ng/mL in S.1.5 tumors.
Biodistribution
The diagnostic potential of proteins for in vivo tumor imaging depends on their rapid blood clearance and ability to accumulate in the tumor. To determine the blood clearance of [123I]-rhTIMP-2 and [123I]-rhTIMP-1, pharmacokinetic studies were conducted. After injection in nontumor-bearing nu/nu mice (n = 4–6), both [123I]-rhTIMP-2 and [123I]-rhTIMP-1 displayed a rapid equilibration phase (T 1/2 α, 1.92 and 1.32 minutes, respectively) and subsequent slower elimination phase (T 1/2 β, 143 and 112.6 minutes) from the circulation. Both constructs have approximately the same size, 21 and 29 kDa, and show similar fast excretion from the body.
To evaluate the MT1-MMP tumor-targeting potential of [123I]-rhTIMP-2, studies were performed in nu/nu mice bearing subcutaneous S.1.5 or C.IV.3 control tumors (n = 3–6), using 0.5 μg of purified radioiodinated rhTIMP-2 or rhTIMP-1. The results of the distribution of radioactivity of [123I]-TIMP-2 in the tissues of S.1.5-bearing mice are summarized in Figure 2A. A higher blood concentration can be observed at all time points compared with the pharmacokinetic studies in tumor-free nu/nu mice. Among normal tissues, kidneys showed the highest concentration of [123I] activity, indicating renal elimination of the small protein (<30 kDa). Kidney uptake was highest with 25.3% ± 2.9% ID/g at 1 hour p.i. and decreased to 1.87% ± 0.2% ID/g at 24 hours p.i. Dehalogenation was indicated by uptake in the stomach of 16.3% ID/g at 1 hour p.i. The maximum activity measured in the tumor was 2.9% ± 1.6% ID/g at 3 hours, with a corresponding tumor-to-blood ratio of 0.41 and a tumor-to-muscle of 3.21, after which a slow decrease of 0.2% ± 0.1% ID/g 24 hours p.i. was seen (Fig. 2C). In the S.1.5 tumor-inoculated mice, radioactivity concentration decreased slower in the tumor than in the blood, reflecting specific binding to tumor tissue. The high blood concentration of [123I]-rhTIMP-2 in S.1.5-inoculated mice, however, resulted in rather low tumor-to-blood ratios.

Comparison of [123I]-TIMP-2 distribution in S.1.5-
A control cell line, C.IV.3, with minor expression of MT1-MMP, and a control protein, rhTIMP-1, were included to study the specific in vivo targeting of MT1-MMP (n = 3). As the tumor has a different MT1-MMP expression pattern, reduced uptake of [123I]-rhTIMP-2 was expected. As seen in Figure 2B, [123I]-rhTIMP-2 accumulated only marginally in the C.IV.3 tumors, without retention. After 3 and 6 hours p.i., the total activity was 1.1% ± 0.7% and 0.5 ± 0.2% ID/g, respectively, which is significantly lower than in S.1.5 xenografts (p < 0.05; Fig. 2B, C). But the radioactivity uptake of all well-perfused organs in C.IV.3-inoculated mice was also significantly lower compared with S.1.5-inoculated mice, reflecting the lower blood concentrations than in S.1.5-inoculated mice.
[123I]-rhTIMP-1 was injected in 4 S.1.5 tumor-bearing mice per time point and comparable blood and organ values were seen with [123I]-rhTIMP-2. At 1 hour p.i., no difference was observed in tumor tissue, probably reflecting the tracer concentration in the blood flow of the highly vascularized S.1.5 tumors. But significantly lower absolute tumor values (p < 0.05) were measured in the control experiment at 3 and 6 hours p.i., with a minimal and declining tumor uptake (Fig. 2C). This further supports a MT1-MMP–dependent [123I]-rhTIMP-2 retention in the tumors.
To investigate the origin of higher [123I]-rhTIMP-2 concentrations in the blood of MT1-MMP–overexpressing tumor-bearing animals (S.1.5), blood concentrations of [123I]-rhTIMP-2 in tumor-free Swiss nu/nu mice (n = 3) were compared with those in tumor-inoculated mice. Not only blood values were significantly lower in tumor-free mice (p < 0.05 at 3, 6, and 24 hours p.i.), but also they were lower in C.IV.3-inoculated mice (p < 0.05 at 1, 3, and 6 hours p.i.). The blood values of control protein ([123I]-rhTIMP-1), on the other hand, were comparable to those of [123I]-rhTIMP-2 in S.1.5 (Fig. 2D).
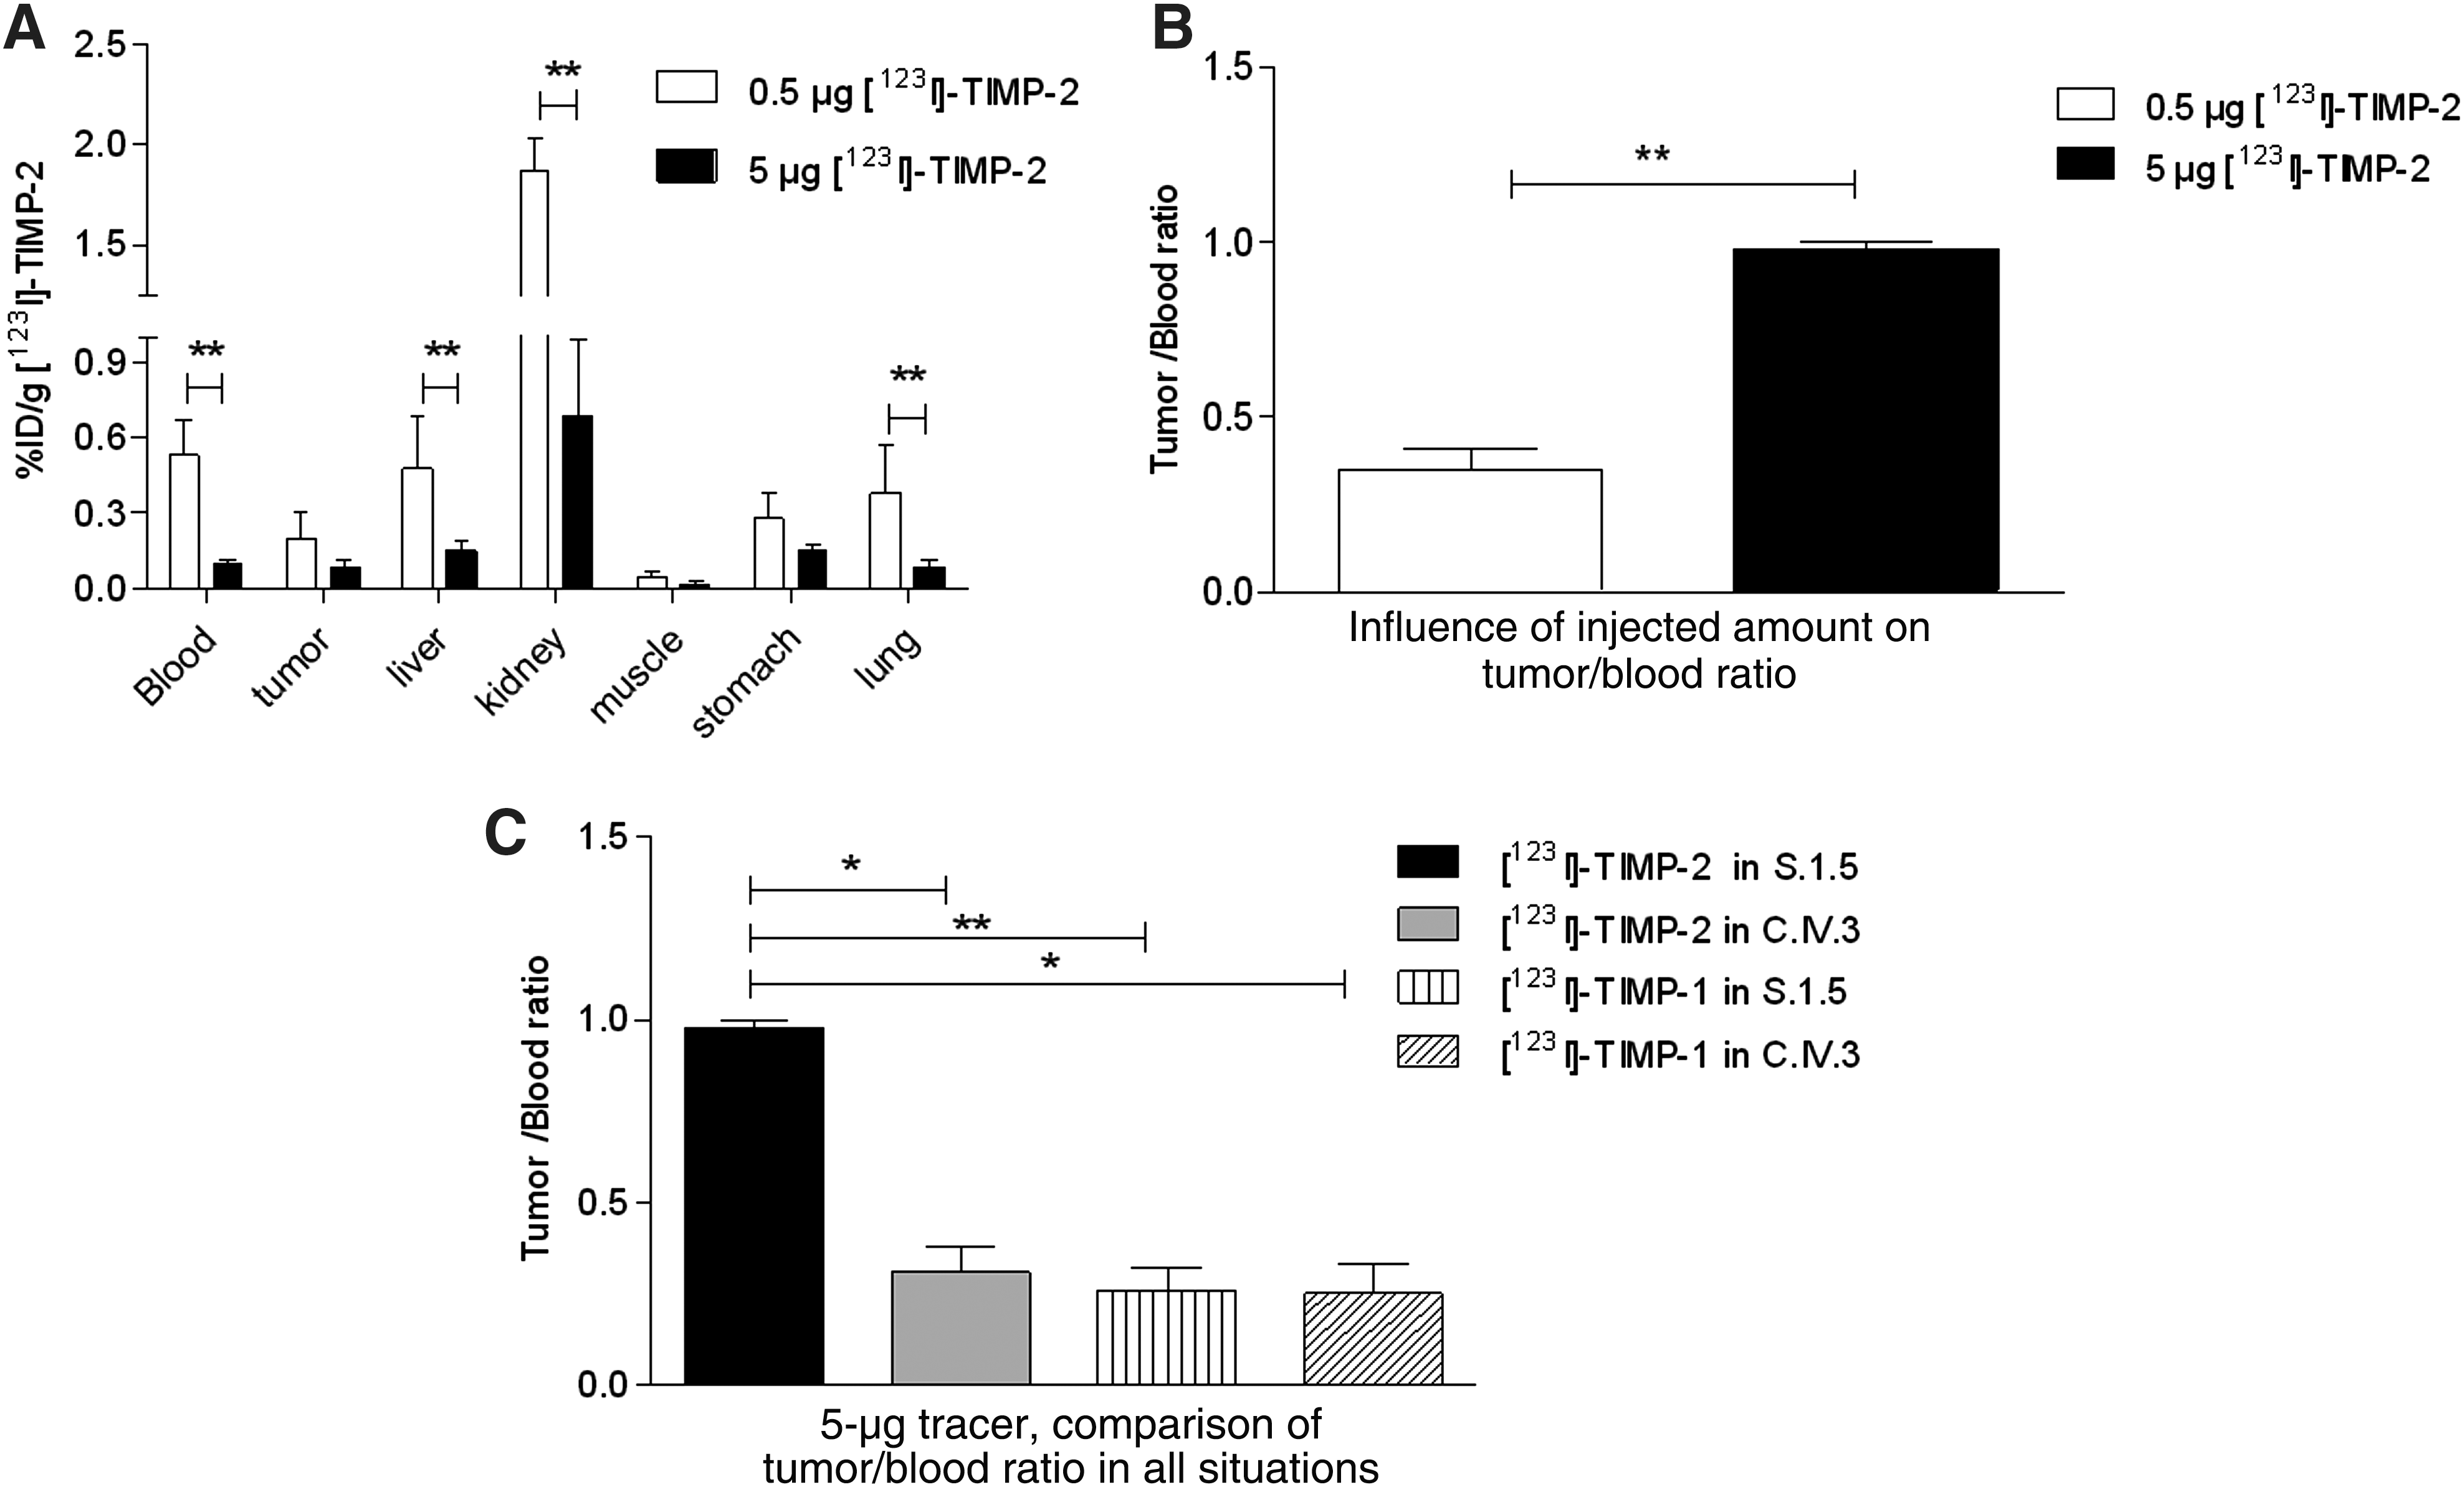
Figure 3 compares the influence of total amount of protein injected on the biodistribution of [123I]-rhTIMP-2 in S.1.5-inoculated mice. A 10-fold higher amount (5 μg) has been injected and mice (n = 6) were sacrificed at 24 hours p.i. Blood, liver, kidneys, and lungs showed significantly lower % ID/g uptake using 5 μg [123I]-rhTIMP-2 compared with 0.5 μg (p < 0.01), whereas the uptake of radioactivity in less-perfused organs was analog (Fig. 3A). Lower blood values (0.10% ± 0.02% ID/g) and higher tumor uptake (0.14% ± 0.03% ID/g) consequently resulted in a higher tumor-to-blood value of 0.98 ± 0.02 (Fig. 3B). Given the three times higher tumor-to-blood ratio of 5 μg [123I]-rhTIMP-2 in S.1.5, control experiments were repeated with 5 μg protein. As anticipated, [123I]-rhTIMP-1 showed negligible tumor uptake of 0.08% ± 0.02% and 0.05% ± 0.02% ID/g in S.1.5 and C.IV.3, respectively. Data of [123I]-rhTIMP-2 in C.IV.3 (0.03% ± 0.02% ID/g) were comparable, accounting for the wash-out of the protein. As both blood and tumor showed no retention of the inhibitor, tumor-to-blood ratios are not significantly different among controls (p < 0.05) and are lower than [123I]-rhTIMP-2 in S.1.5 (Fig. 3C).
Planar gamma imaging
Planar imaging of both [123I]-rhTIMP-2 and [123I]-rhTIMP-1 was performed in S.1.5 and C.IV.3. Figure 4 shows the images of tumor-bearing mice at different time intervals after injection. The S.1.5 tumor was clearly depicted using [123I]-rhTIMP-2. High uptake can be observed in stomach, bladder, and kidneys. Regions of interest were drawn and tumor-to-contralateral background ratios were calculated (n = 4–10) (Table 1). Significant differences at all time points between [123I]-rhTIMP-2 and [123I]-rhTIMP-1 in S.1.5 and [123I]-rhTIMP-2 in S.1.5 and C.IV.3 can be observed (p < 0.05). No significant differences were noticed among controls. This is consistent with Western blot results of tumors showing a higher MT1-MMP expression in S.1.5 tumors.
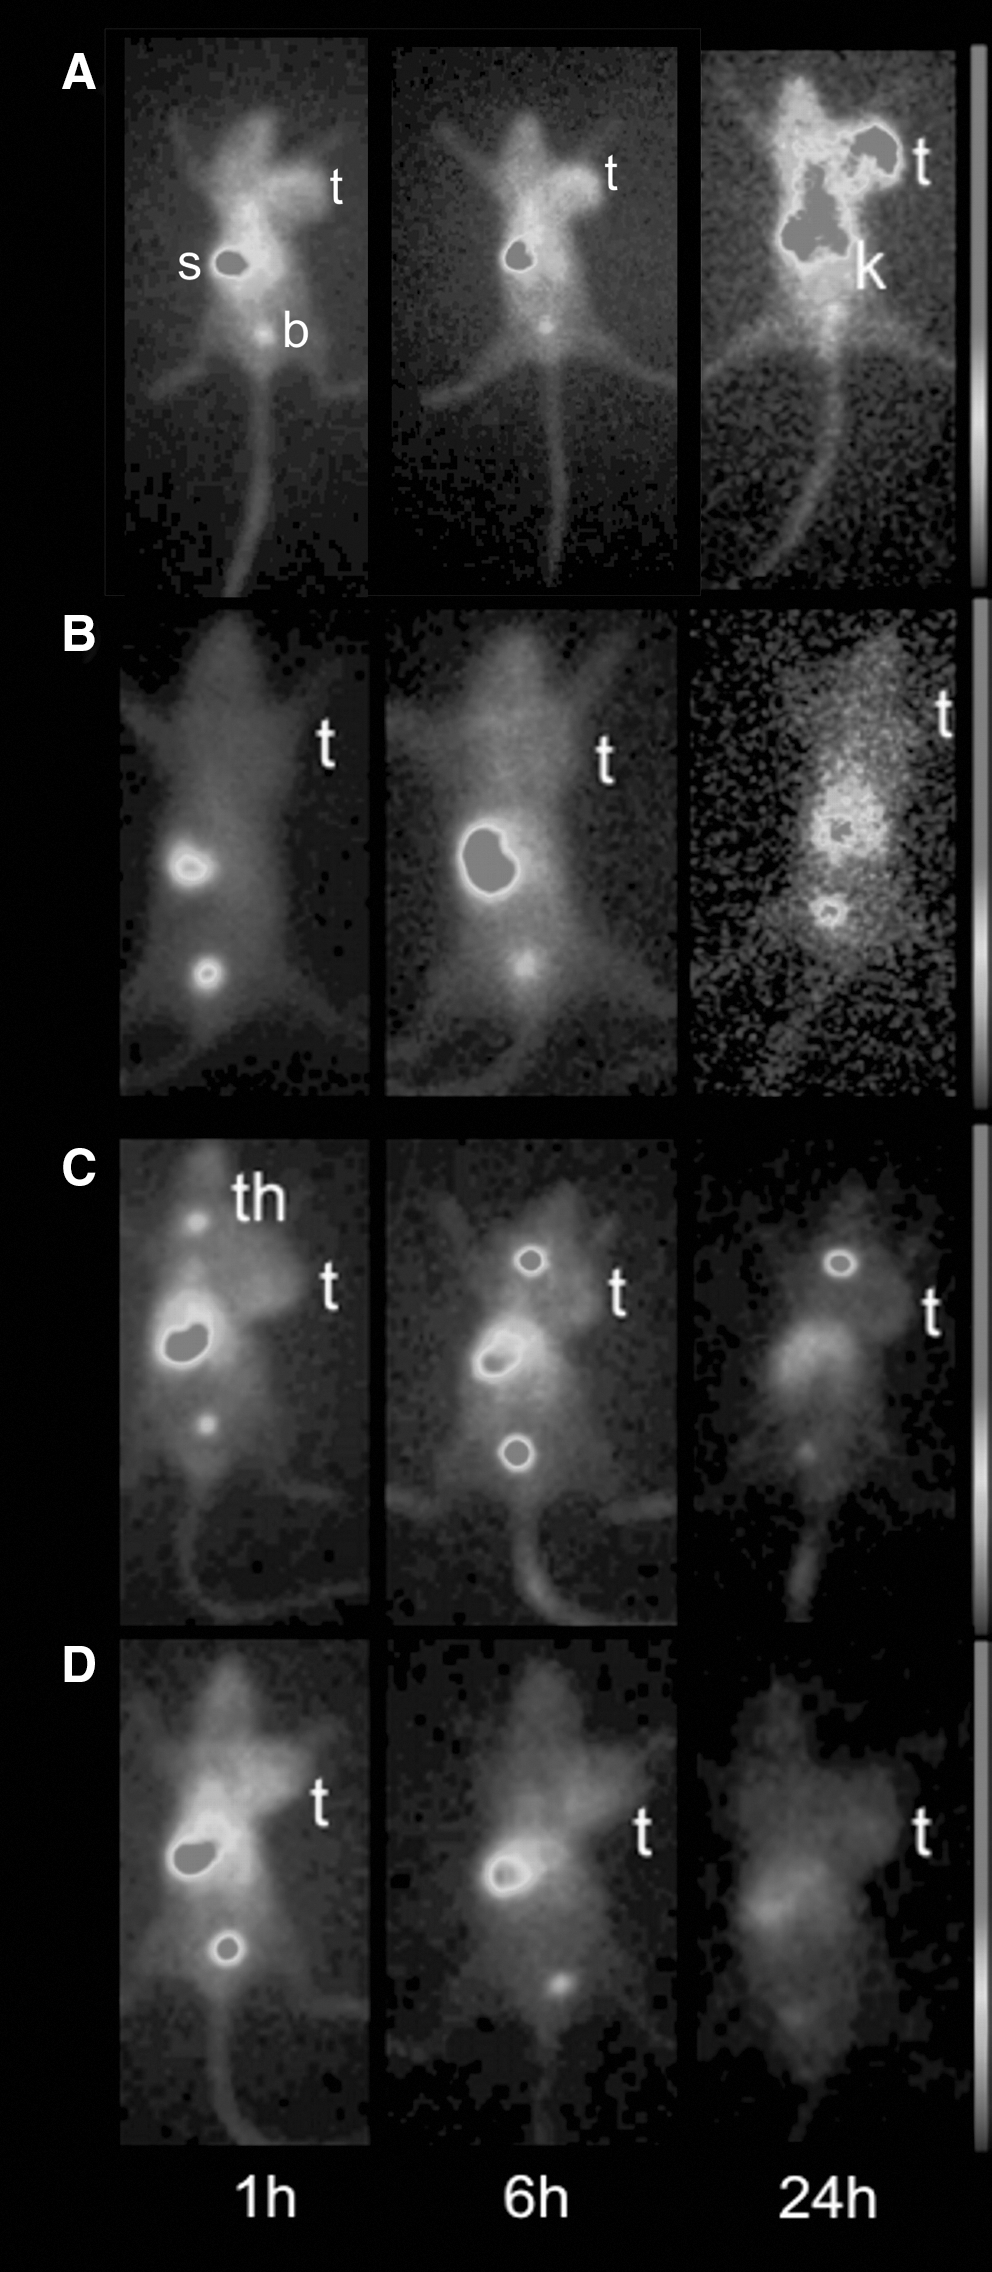
Detection of MT1-MMP overexpression in S.1.5 tumors with 5 μg [123I]-TIMP-2 and control experiments. Planar gamma imaging of anesthetized (1%–2% isoflurane) nu/nu mice bearing S.1.5
Tumor-to-contralateral background ratio values represent the mean ± standard deviation of data from three measurements per animal and 3–5 animals per experiment.
Values of [123I]-TIMP-2 in S.1.5 images were compared with all controls separately for significance level. All controls were not significantly different among each other. p < 0.05; Mann–Whitney U-test.
TIMP-2, tissue inhibitor of metalloproteinase-2.
In vivo stability and metabolization
From the blood clearance studies, biodistribution, and imaging experiments, only the quantitative presence of radioactivity in the blood and organs can be determined. Information on the integrity of the proteins cannot be obtained by these experiments. To identify the compound located in blood and tumor tissue, metabolization studies in the S.1.5-inoculated mice (n = 4) were performed. The tracer was extracted from tumor tissue at 3 hours after injection of [123I]-TIMP-2, and plasma was separated by centrifugation. Spiked plasma and tumor samples did not show protein degradation. Blood samples as well as tumor extracts were separated using SEC on PD10 and resulted in two distinct peaks of radioactivity encompassing fractions 7–10 (high Mw compound) and 16–24 (low Mw compound). Figure 5A demonstrates that 54% ± 1.8% of high Mw and 40.9% ± 1.9% of low Mw compound were detected in the blood at 3 hours p.i. In the tumor, 89.1% ± 0.3% of the activity was represented by a low Mw compound. To identify the high-Mw degradation product, samples of plasma, free iodine, and pure [123I]-TIMP-2 were analyzed by SDS-PAGE. On a 15% polyacrylamide gel (Fig. 5B), three clear bands were detected in the plasma: one of 21 kDa, corresponding to the intact tracer, one of ± 100 kDa, and free [123I]. The larger band could be attributed to a 123I-protein coupled to shed MT1-MMP, MMP-2, other MMPs, or 123I-protein complexed to serum proteins.

Metabolization profile of [123I]-TIMP-2 in S.1.5-inoculated mice at 3 and 24 hours p.i.
Discussion
The present study demonstrates that rhTIMP-2 and rhTIMP-1 can be successfully iodinated with high specific activity and excellent in vitro stability. Further, the potential use of [123I]-rhTIMP-2 for in vivo imaging in a mouse tumor model overexpressing MT1-MMP is described. Iodination was chosen over 111In-DTPA conjugation construction in these scouting experiments, because of the possible heterogeneity of the DTPA-conjugate. 8
Overexpression or absence of the targeted proteinase in vitro as well as in vivo was documented in two A2058 clones that overexpressed MT1-MMP (S1.5 clone) or not (C.IV.3). 17 Reverse transcriptase (RT)–polymerase chain reaction, Northern blotting, immunocytochemistry, Western blotting, and flow cytometry (data not shown) demonstrated high levels of MT1-MMP transcripts and protein only in S1.5 tumors and cells that had been generated by transfection with MT1-MMP cDNA. On the contrary, the control clone C.IV.3, transfected with an empty vector, exhibited only minimal amounts of MT1-MMP. TIMP-1 was used as control, as it shows a comparable binding as TIMP-2 to all soluble MMPs but is unable to bind MT1-MMP. 22
The present study demonstrates the expected specific binding capacity of [123I]-rhTIMP-2 on S.1.5 cells, resulting in a K d of 1.18 ± 0.12 nM, but not of [123I]-rhTIMP-1. These results were comparable to binding assays performed on clone S.1.11, another MT1-MMP–overexpressing A2058 clone (A. Noël, personal communication, unpublished data), on MT1-MMP–transfected COS-1 cells (1.39 nM) 23 and HT1080 fibrosarcoma tumor cells (2.54 nM). 24,25 Interactions between MT1-MMP and TIMP-2 have been previously well characterized. It is widely accepted that binding of TIMP-2 with MT1-MMP occurs primarily through N-terminal domain interactions, thereby forming a secondary complex receptor for pro-MMP-2 activation. 26,27 Studies to displace MT1-MMP–bound TIMP-2 in a purified system with active MMP-2 showed minimal displacement of inhibitor, under the experimental conditions, because of the high-affinity interaction between TIMP-2 and MT1-MMP. 27 There is also evidence that [125I]-rhTIMP-2 internalizes and that this reflects the internalization of MT1-MMP. 17,28 –30
One of the major advantages of small antibody fragments and small proteins, such as TIMPs, for in vivo imaging, is their rapid blood clearance. Pharmacokinetic studies performed in tumor-free nu/nu and nmri mice showed a similar clearance rate for [123I]-rhTIMP-2 and [123I]-rhTIMP-1. Biodistribution studies in S.1.5-inoculated mice, however, demonstrated significantly higher blood concentrations for both [123I]-rhTIMP-2 and [123I]-rhTIMP-1 at early time points and a consequently higher overall organ uptake when compared with C.IV.3-inoculated mice, tumor-free nu/nu mice, or nmri mice. 31 The underlying cause for the observed higher blood activity is currently unclear. A possible explanation is that soluble forms of MT1-MMP, present in the plasma, arise from cell surface shedding 32 and may significantly bind TIMP-2, accounting for the high [123I]-rhTIMP-2.
However, this cannot explain the high concentration of [123I]-rhTIMP-1 present in the plasma of S.1.5-inoculated mice, because TIMP-1 cannot bind the catalytic domain of MT1-MMP. 22 An alternative (and not mutually exclusive) explanation is that S.1.5 cells result in the accumulation of other active MMPs in the plasma, such as activated MMP-2, as previously documented. 18 This could account for the increased levels of both [123I]-rhTIMP-1 and −2 because both bind to activated MMP-2 in a stoichiometric 1:1 ratio. 33 In the series presented, high-Mw complexes were identified in plasma in the metabolization studies. Hypothetically, these high-Mw complexes may be attributed to [123I]-TIMP-2/MMP-complexes. Further investigations to clarify this issue are warranted.
Because of the high retention of [123I]-rhTIMP-2 in the blood of S.1.5-inoculated mice, calculated tumor-to-blood ratios were situated more or less in the same range as for the control (C.IV.3) tumors. However, when considering the radioactivity concentrations for both proteins in both tumors, it is clear that higher uptake of [123I]-rhTIMP-2 in S.1.5 cannot solely be assigned to higher blood concentrations of the tracer, given the lower tumor uptake of [123I]-rhTIMP-1. Importantly, when compared with Western blot results, absolute tumor uptake in S.1.5 was not as high as expected from earlier in vitro experiments. In this regard, ELISAs have shown a TIMP-2 concentration of 56.8–89.6 and 115.5–154.8 ng/mL in C.IV.3 and S.1.5 tumor extracts, respectively. Thus, the higher endogenous TIMP-2 expression in S.1.5 might have affected tumor uptake by a competitive effect. Both the endogenous TIMP-2 competitive effect and the higher tracer presence in the blood compartment should be, at least partially, overcome by increasing the injected protein amount and augmenting specific activity. Thus, instead of 0.5 μg protein, ∼5 μg [123I]-rhTIMP-2 was administered to S.1.5- and C.IV.3-inoculated mice. At 24 hours p.i., significantly higher tumor-to-blood ratios for 5 μg tracer in S.1.5 were calculated. Increasing the amount of protein injected has a direct influence on blood concentration, because all well-perfused organs have significant lower uptake of the radioactive tracer, whereas in other tissues, such as tumor and muscle, no difference can be observed. As anticipated, the decrease of blood radioactivity favorably modified tumor-to-blood values for [123I]-rhTIMP-2 in S.1.5-inoculated mice when compared with controls.
These higher T/B values resulted in a distinct S.1.5 tumor visualization with [123I]-rhTIMP-2 by planar gamma imaging. No tumor localization in the control groups was evident, with the images only showing blood pool activity. Uptake in stomach, bladder, and kidney region was comparable for all groups and most likely due to dehalogenation and kidney clearance. Higher blood saturation of [123I]-rhTIMP-1 in S.1.5-inoculated tumors is clearly not sufficient for delineation of the tumor. This finding further proves that defined localization of the tumor in S.1.5-inoculated mice is attributable to specific targeting of [123I]-rhTIMP-2 to MT1-MMP. As previously described, the TIMP-2/MT1-MMP complex is internalized and TIMP-2 is degraded in intracellular organelles. Because of this internalization and subsequent recycling of MT1-MMP, [123I]-rhTIMP-2 could be metabolized intracellular, resulting in low-molecular-mass degradation fragments. 17 The presence of ∼90% of low-Mw compound in tumor extracts in the metabolization studies indicates that internalized protein is indeed degraded in the tumor, however, without affecting tumor imaging.
Experiments with MMPIs or with a MT1-MMP blocking antibody could be performed in the future to give a clearer view on specificity of [123I]-rhTIMP-2 uptake at the tumor site and the origin of blood retention. It is also important to notice that in vivo, not only tumor cells but also mainly surrounding stroma cells and tumorigenic endothelial cells express MT1-MMP. 13 Therefore, it would be interesting to evaluate tumors expressing lower levels of MT1-MMP to study the influence of induced overexpression on blood uptake of the tracer. In addition, other tumor models with less-explosive growth than S.1.5 will probably give rise to smaller malignancies with less-necrotic and -hypoxic areas, which could influence tracer uptake.
Conclusions
In conclusion, [123I]-rhTIMP-2 is a radioligand that binds both in vitro and in vivo to MT1-MMP–expressing tumor cells. Despite the high variation in blood concentrations, possibly caused by cell shedding or release of active MMP-2, and the dehalogenation (reflected by high stomach uptake) of [123I]-rhTIMP-2 in vivo, this study shows the potential of MT1-MMP imaging as tumor marker. The development of more stable radioligands with high affinity for MT1-MMP, such as monoclonal antibodies and antibody constructs, could overcome the problems associated with [123I]-rhTIMP-2. In the future, molecular imaging of this protease could be useful for in vivo evaluation of specific MT1-MMP–inhibiting strategies.
Footnotes
Acknowledgments
This work was supported by the European Union, Framework 6, Cancer Degradome project (grant LSHC-CT-2003-0503297). The authors thank the Laboratory of Tumor and Developmental Biology, University of Liège, Sart-Tilman, for the provided proteins and Western blotting analysis. The authors also thank Prof. G. Murphy of the Cambridge Institute for Medical Research for the TIMP-1. Many thanks should be addressed to Bart Lucas of the Laboratory of General Biochemistry and Physical Pharmacy, University Ghent, for his know-how concerning the use of the microscope and photographic devices.
Disclosure Statement
No competing financial interests exist.