
Abstract
Purpose:
The present study was initiated to study the autophagic and apoptotic response to sonodynamic therapy (SDT) in murine leukemia L1210 cells in vitro.
Methods:
L1210 cells were examined after 6 hours of incubation following SDT induction with ultrasound at a frequency of 1.1 MHz and an intensity of 3 W/cm2 in the presence of 1 μg/mL protoporphyrin IX. Apoptosis rate and cell survival rate were assessed through double fluorescent staining with Annexin V-PE and 7-amino-actinomycin D as determined by flow cytometry. Transmission electron microscope and fluorescence microscope were used to identify the formation of acidic vesicular organelles (autophagic vacuoles) during autophagy. Western blots were used to examine the processing of light chain 3 (LC3)-I to LC3-II and Atg5 expression levels.
Results:
This study showed that SDT treatment reduced the numbers of viable cells to 30.17% and enhanced the apoptotic cells to 19.37% (p < 0.05 compare with control). Additionally, autophagic vacuoles formation clearly occurred after SDT and simultaneously accompanied by obvious LC3 processing and increased Atg5 expression levels.
Conclusions:
In L1210 cells, both apoptosis and autophagy were involved in cell damage induced by SDT treatment at the experimental conditions.
Introduction
S
It was initially believed that SDT can kill cells via apoptosis and necrosis. 9 –13 Many studies have documented SDT induced apoptosis in a variety of cell types by an array of different sensitizers. However, little information concerning other cellular responses to SDT is known. Recently, David Kessel's work revealed that both autophagy and apoptosis were observed in L1210 cells after PDT. 14 An autophagic response to PDT has also been observed in many other cell lines with different photosensitizers. 15 Similar to PDT, SDT is a combined and complicated stimulus; so, in the present study, it is very important for us to know whether autophagy was involved in SDT induced cytotoxicity in L1210 cells.
Autophagy is a regulated process of degradation and recycling of cellular constituents, participating in organelle turnover and in the bioenergetic management of starvation. 16 During autophagy, parts of the cytoplasm or entire organelles, including mitochondria, endoplasmic reticulum, and ribosomes, are sequestered into double-membraned vesicles, called autophagic vacuoles (AVOs) or autophagosomes. Autophagosomes ultimately fuse with lysosomes, thereby generating single-membraned autophagolysosomes and degrading their content. 17 –19 The microtubule-associated protein light chain 3 (LC3) is usually used as a classical marker for autophagosome. 20 LC3 has two forms: type I is cytosolic and type II is membrane-bound. LC3-II is actually converted from LC3-I by protease. LC3 is cleaved by a cysteine protease to produce LC3-I. When autophagy is not activated, LC3-I is localized homogenously in the cytoplasm; however, on initiation of autophagy, LC3-I, in turn, is converted to LC3-II through the action of E1- and E2-like enzymes. LC3-II is covalently attached to phosphatidylethanolamine on its C terminus, and it remains associated with the membrane of autophagosomes after these vacuoles are formed. Therefore, up-regulation of LC3-II can be detected by immunoblot analysis, because LC3 type I and type II have different molecular weights (18 and 16 kDa, respectively). Atg proteins are required for AVOs formation. Atg5 is involved in the early stage of autophagosome formation, which has been previously characterized as a protein specifically required for autophagy. 21 Lysosome, an acidic organelle, plays an important role in the fusion of autophagosomes and lysosomes. Therefore, co-localization between LC3 (an autophagosomal membrane marker) and lysosomal associated membrane protein 2 (LAMP2, a lysosomal marker) can also be used as a method to evaluate autophagic response in cells. 22
In this study, to explore the possibility that autophagy may occur in cell damage after SDT, L1210 cells were examined after SDT induction with ultrasound at a frequency of 1.1 MHz and an intensity of 3 W/cm2 in the presence of 1 μg/mL PpIX. After 6 hours of incubation post-SDT, the apoptosis rate and cell survival rate were assessed by flow cytometry. Transmission electron microscope and fluorescence microscope were used to identify the formation of AVOs during autophagy. Western blots were used to examine the processing of LC3-I to LC3-II and Atg5 expression levels. Confocal laser scanning microscope was performed to detect the co-localization between mitochondria and Atg5, and between LC3 and LAMP2. The findings may provide new insight about cellular responses to SDT treatment.
Materials and Methods
Reagents
PpIX disodium salt (Sigma Chemical Company) was dissolved in 0.01 M phosphate-buffered saline (PBS) (pH 7.4), sterilized, aliquoted, and stored in the dark at 4°C. All other reagents were commercial products of analytical grade.
Cell culture
Murine leukemia L1210 cells line was from American Type Culture Collection (ATCC, CCL-219TM). The cells were cultured in DMEM (GIBCO) containing 10% horse serum, 100 U/mL penicillin, 100 μg/mL streptomycin (GIBCO), and 1 mM L-glutamine (AMRESCO). Cells were maintained at 37°C in a humidified 5% CO2 atmosphere. Cells in the exponential phase were used in each experiment.
Ultrasonic exposure system
The experimental set up for insonation is shown in Figure 1. The focused ultrasound transducer with a circular ceramic plate of 15 mm in diameter, manufactured by the Institution of Applied Acoustics, Shaanxi Normal University (Xi'an, China), was submerged in degassed water at room temperature facing directly upward. The focal length of the transducer is 26 mm. The same transducer was used for all experiments and was driven at a frequency of 1.1 MHz. The electrical signal was generated and amplified by a multi-functional generator (Model AG1020; T&C Power Conversion, Inc. Rochester, NY) before being applied to the transducer. To specify the intensity in the insonation experiment and have an easy and obvious understanding, the reading output power of the amplifier representing our spatial average ultrasound intensity in this experiment system is used.
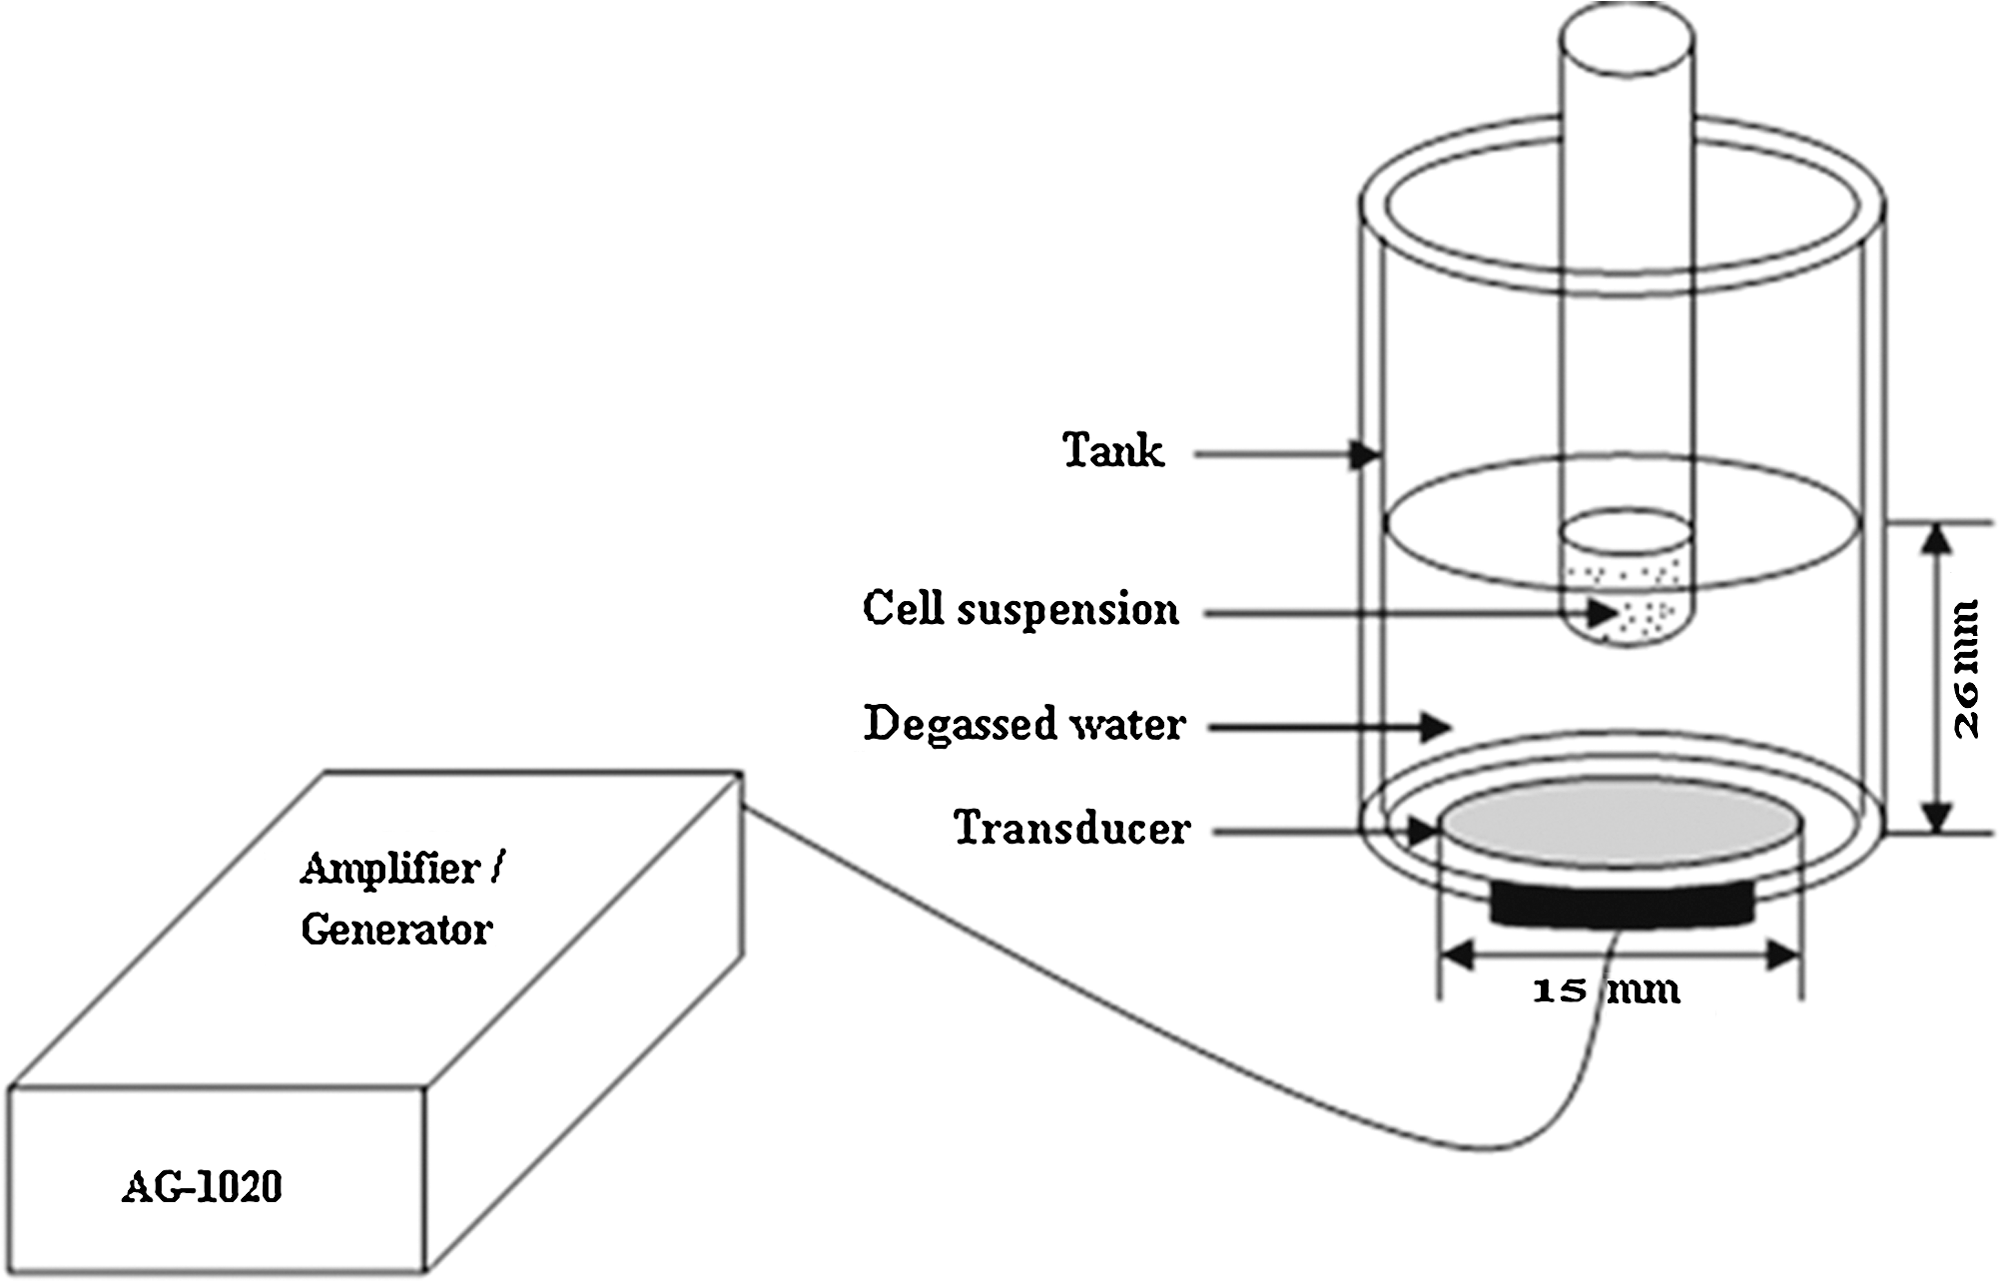
Ultrasound exposure set up.
A disposable sterile polystyrene test tube (diameter 10 mm, height 75 mm) containing 1 mL air-saturated cell suspension (1 × 10⁶ cells/mL) was placed into the focal area of the transducer for insonation. The tube was rotated at 20 rpm by a micro-motor to ensure an even distribution of cells within the medium. For all experiments, the coupling water in the tank was degassed and maintained at room temperature during irradiation. Temperature increase inside the test tube was measured before and after ultrasound treatment with a digital thermometer, and no significant variation of temperature was detected (±1°C). Thus, any bio-effects observed in this study were considered nonthermal.
Treatment protocols
L1210 cells were collected by centrifugation, resuspended in culture medium at a concentration of 1 × 10⁶ cells/mL. The suspensions were put into polystyrene tubes (1 mL) and then divided randomly into four groups: (1) control (CT), (2) PpIX (P), (3) ultrasound (U), and (4) ultrasound plus PpIX (UP). PpIX solution was added to each tube of the UP and P groups to a final concentration of 1 μg/mL. Instead of PpIX, an equivalent quantity of culture medium was used for the CT and U groups. Sono-sensitization with PpIX involved a 60 minutes drug-loading incubation at 37□, allowing sufficient time for cell uptake of the sensitizer to reach the maximum level. The cells were then exposed to ultrasound at a frequency of 1.1 MHz and an intensity of 3 W/cm2 for 1 minutes duration. After treatment, cell suspensions were cultured for an additional 6 hours and then subjected to different analysis.
Detection of cell apoptosis using flow cytometry
Quantification of cell apoptosis was performed by the Guava Nexin Assay (Millipore), which utilizes Annexin V-PE to detect externalization of phosphatidylserine on the external membrane of apoptotic cells; the cell impermeant dye, 7-amino-actinomycin D, is also used as an indicator of cell membrane integrity. This assay was exactly performed according to the manufacturer's instruction.
Supravital cell-staining with Monodansylcadaverine for autophagy detection
Monodansylcadaverine (MDC) is a marker for lysosomal activity and fused autolysosomes. 23 After different treatments, cells were stained with MDC at a final concentration of 20 μM for 20 minutes at 37°C. After labeling, cells were washed with PBS, and images were obtained with a fluorescence microscope (Nikon E600). Excitation wavelength was 360–380 nm, and emission wavelength was 520–560 nm.
AVOs detection with acridine orange staining
Acridine orange moves freely across biological membranes when uncharged. Its protonated forms accumulate in acidic compartments, where it forms aggregates that fluoresce bright red.
To assess changes in formation of AVOs and morphology of cells after SDT, cells were incubated with acridine orange (0.5 mg/mL; Sigma) for a period of 20 minutes at 37°C. Pictures were acquired using the fluorescence microscope with a CCD camera at the same exposure settings. Excitation wavelength was 488 nm (blue), and emission wavelengths were 510–530 nm (Green) and 650 nm (red).
Quantification of AVOs with acridine orange staining using flow cytometry
In acridine orange-stained cells, the cytoplasm and nucleolus fluoresces bright green and dim red, whereas acidic compartments fluoresce bright red. The intensity of the red fluorescence is proportional to the degree of acidity. 24 Therefore, by comparing the ratio of mean red and green fluorescence intensity within different cell populations, a change in the degree of acidity could be measured. Cells were stained with acridine orange for 20 minutes at 37°C and washed once with PBS. Green (510–530 nm) and red (650 nm) fluorescence emission from 5000 cells illuminated with blue (488 nm) excitation light was measured with a FACS Calibur (Guava technologies Inc., Millipore).
Immunocytochemistry
To further provide the evidence of SDT induced autophagy in L1210 cells, the ability of SDT to induce the co-localization between mitochondria and Atg5, and between LC3 and LAMP2 was examined.
The control and SDT treated cells were harvested and then fixed with 4% paraformaldehyde for immunofluorescence assays. Cells preincubated with 20 nM Mito Tracker Green (Molecular Probes Inc.) were stained for the detection of co-localization of damaged mitochondria and Atg5 (Sigma). In the same way, cells were double stained with LC3 (mouse monoclonal from Sigma) and LAMP2 (rat monoclonal from Santa Cruz) for detection fusion of autophagosomes and lysosomes. The corresponding secondary antibodies were performed by immunoglobulin FITC or TRITC conjugates (ZSGB-BIO). Cells were imaged with a confocal microscope (Leica TCS SP5).
Transmission electron microscope observation
To confirm the presence of autophagy in L1210 cells, cells were harvested and then fixed with 2.5% glutaraldehyde for 1 hours, followed by postfixation for 1 hours in 1% osmium tetroxide. After washing in PBS, the cells were dehydrated by graded alcohol, embedded in Epon812, and ultrathin sectioned. The sections were stained with uranium acetate and lead citrate, observed, and viewed with a transmission electron microscope (H-600, Hitachi).
Western blots analysis the processing of LC3-I to LC3-II and Atg5 expression levels
After SDT treatment, cells were washed by PBS and lysed with 100 μL RIPA buffer (including 0.1M NaCl, 5 mM EDTA, 0.1M Na2HPO4, PH 7.5, 1% Triton, and 0.1% sodium dodecyl sulfate) containing protease inhibitors (PMSF and pepstatin A) for 0.5 hours. The protein content of the lysate was measured using the BCA protein assay reagent. Aliquots containing 40 μg of protein were analyzed on 12% sodium dodecyl sulfate-polyacrylamide gel electrophoresis gels and transferred protein onto polyvinylidene fluoride membranes (0.22 μm, Millipore). Membranes were then incubated at room temperature for 2 hours in blocking buffer [5% low-fat milk powder in Tris-buffered saline-Tween 20 (0.05%) (TBST)]. The membranes were incubated overnight at 4°C with primary antibodies against a goat polyclonal antibody LC3 (Santa Cruz) and a rabbit polyclonal antibody Atg5 (Sigma). The bound primary antibodies were then tagged with horseradish peroxidase-labeled secondary antibodies at room temperature for 1 hours, and the immune complexes were detected by enhanced chemiluminescence system. Anti-actin was used to control equal loading. The ratios of LC3-II/actin and Atg5/actin in each experiment were calculated by Quantity one software (version 4.6.2; Biorad). The values were expressed as the mean ± S.D. from at least three independent experiments.
Statistical analysis
Statistical significance was evaluated by a paired t-test. Differences are assumed to be significant if p < 0.05 and p < 0.01.
Results
SDT-induced apoptosis in L1210 cells
The fraction of cell population in different quadrants was analyzed using quadrant statistics. 25 In this article, the apoptotic cells included cells in both LR (lower right) and UR (upper right) quadrants, which represented the early and late apoptotic cells, respectively. Cells in the UL (upper left) quadrant represented cells that had died by necrosis. Cells in the LL (lower left) quadrant represented the viable cells.
As shown in upper of Figure 2, the number of viable cells in control and PpIX groups was 94.56% and 93.88%, respectively (Fig. 2A, B). Ultrasound alone reduced the viable cells to 71.87% (Fig. 2C), whereas SDT treatment further decreased the viable cells to 30.17% (Fig. 2D). Moreover, compared with control, the number of apoptotic cells in ultrasound alone and SDT groups were 16.52% (p < 0.05) and 19.37%, respectively (p < 0.01) (Fig. 2, lower).

Detection of apoptosis on SDT-treated L1210 cells using flow cytometry (upper) and quantification of the apoptosis rates (lower). The cells were double stained with AAnnexin V-PE (yellow fluorescent marker for apoptosis) and 7-AAD (red fluorescent marker for death) after exposure to ultrasound;
SDT-induced autophagy in L1210 cells
The morphologic and biochemical features of autophagy occurring in L1210 cells after SDT treatment were consistent with the development of an autophagic response.
Fluorescence images of L1210 cells
The pattern of MDC labeling in L1210 cells can be observed in Figure 3; cells in control and PpIX groups exhibited diffused MDC staining throughout the cytoplasm; and very little punctate staining was observed (Fig. 3A, B). Ultrasound alone increased the number of cells strongly stained with punctate spots (Fig. 3C), which was more significantly enhanced in the presence of 1 μg/mL PpIX (Fig. 3D).
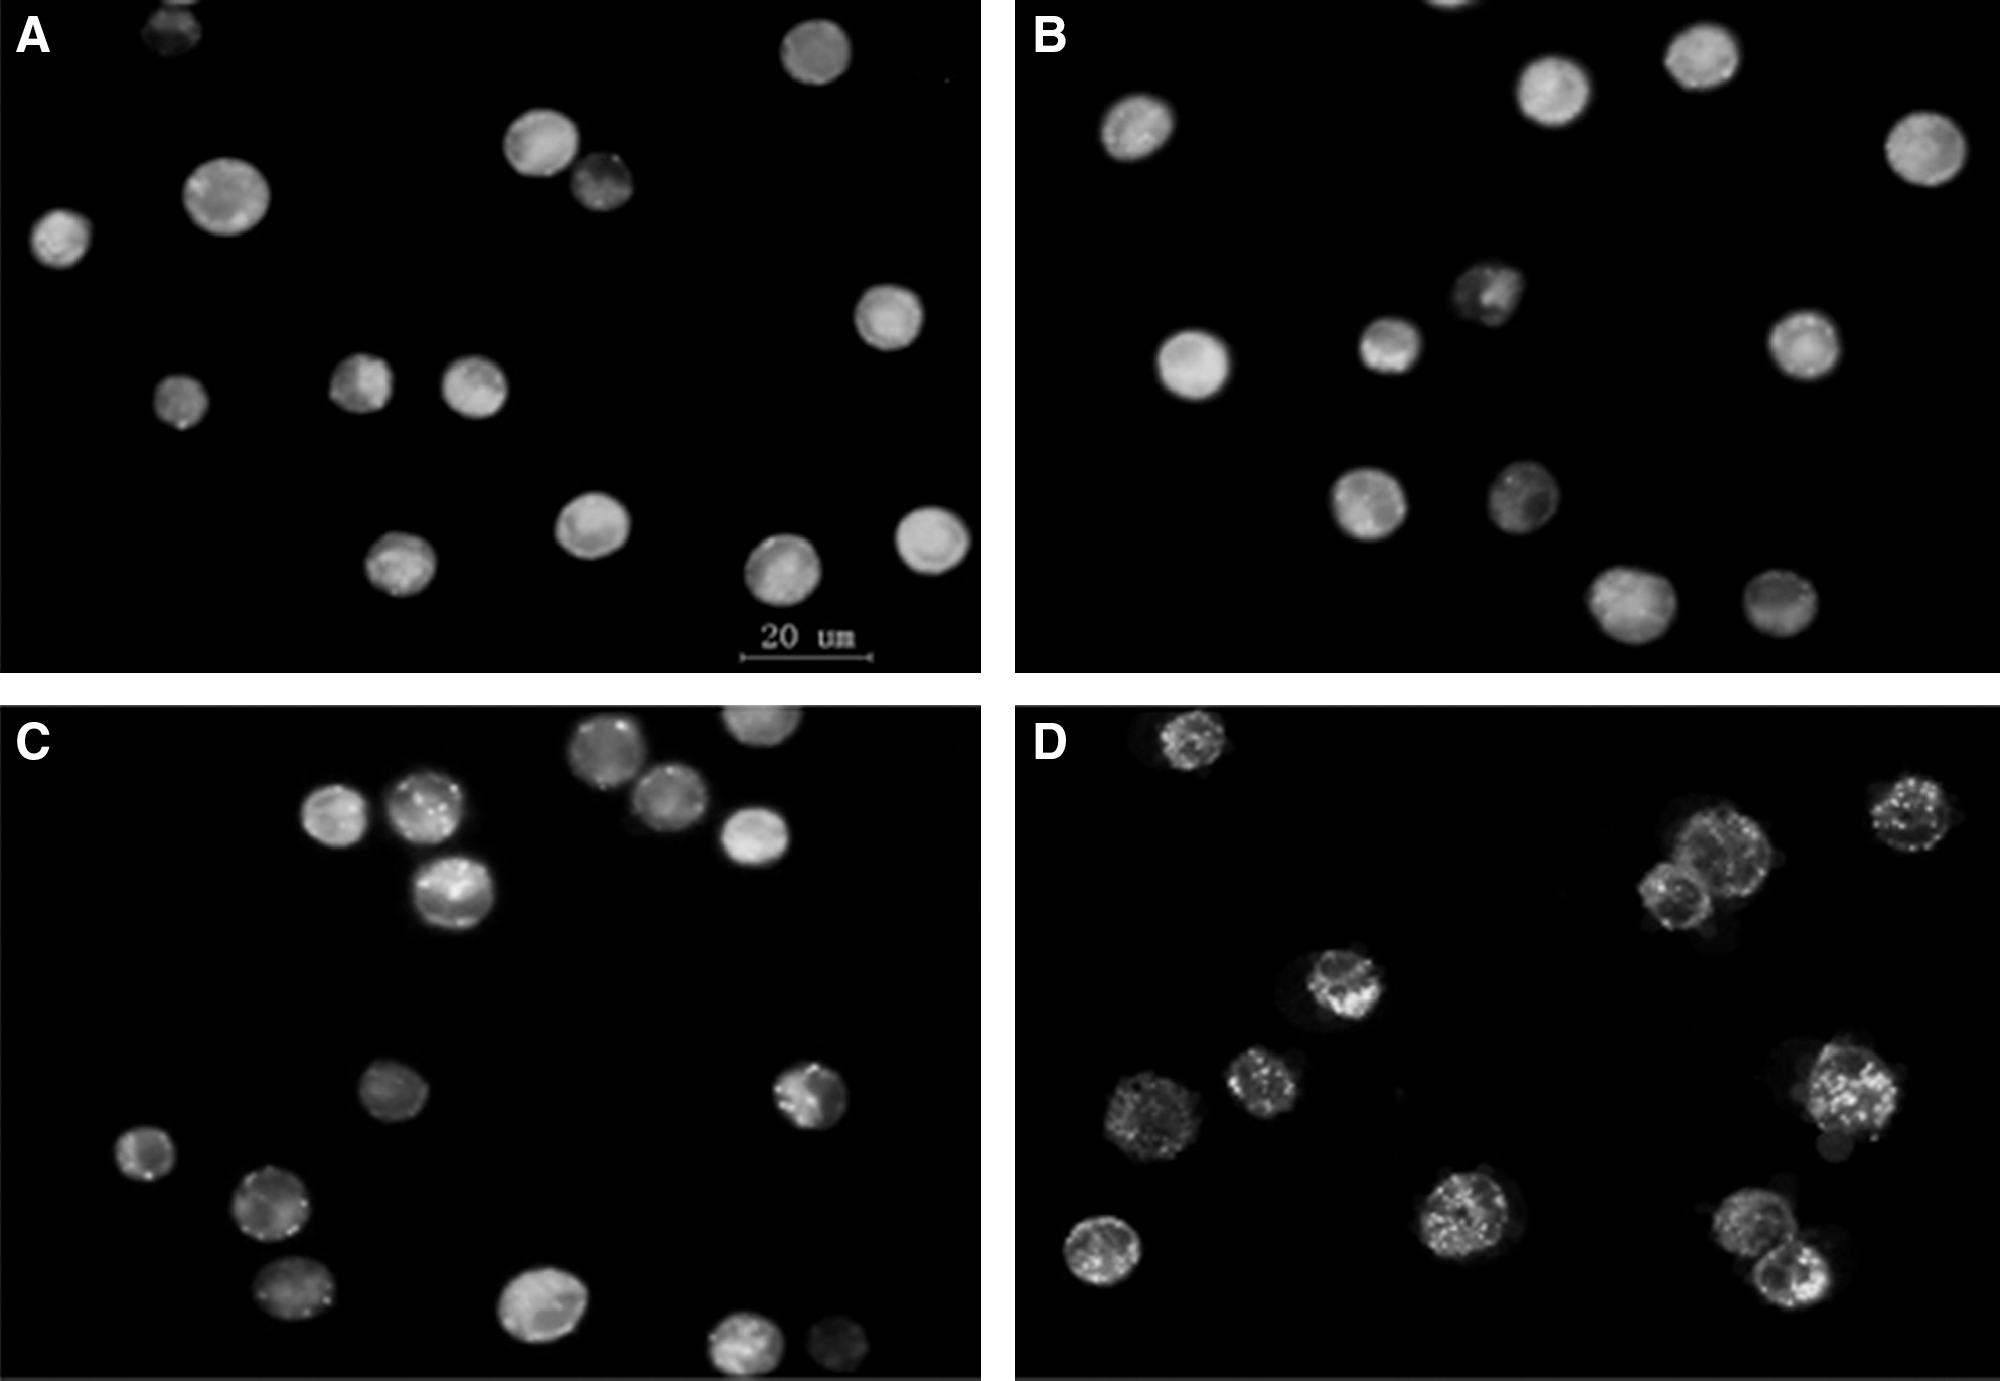
Observation of SDT-induced AVOs by vital staining with Monodansylcadaverine.
Autophagy is characterized by AVOs formation, which is also measured by vital staining of acridine orange. Acridine orange moves freely to cross biological membranes and accumulates in acidic compartments, where it is seen as bright red fluorescence. As shown in Figure 4, many cells in control and PpIX groups mainly exhibited green fluorescence while with little red fluorescence (Fig. 4A, B). Ultrasound alone showed obvious red fluorescence (Fig. 4C); further, in SDT treated cells, concentrated dye in the vesicles fluoresced bright red, whereas the cytoplasm and the nucleus showed dominant green fluorescence (Fig. 4D).
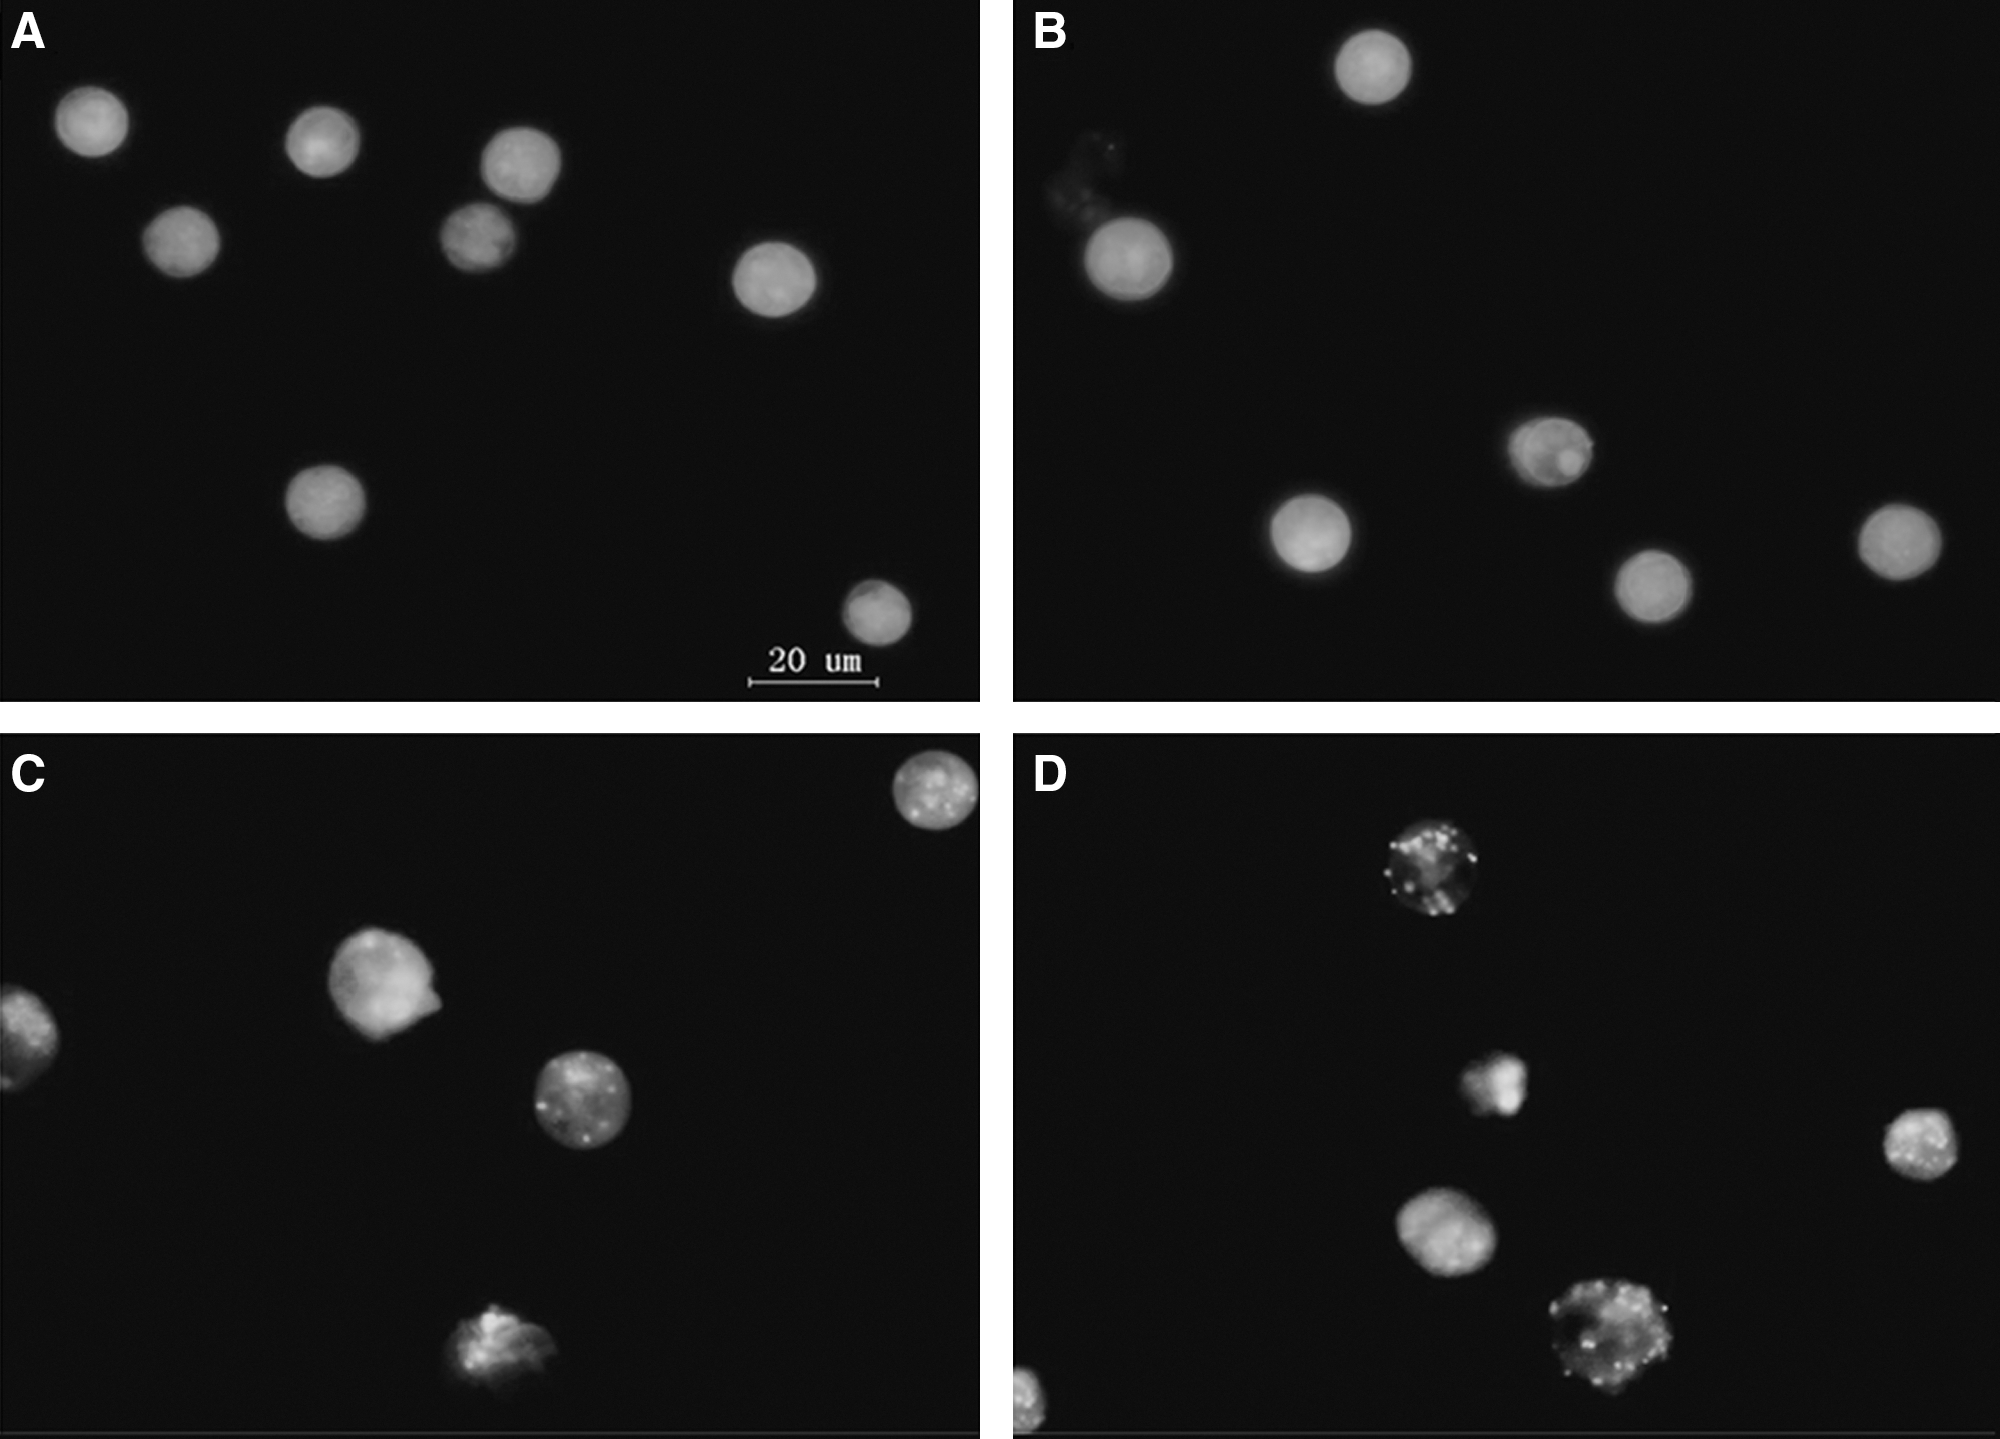
Observation of SDT-induced AVOs by vital staining with acridine orange.
Flow cytometry analysis
To further quantify the SDT-induced red fluorescence increase in fractional volume of AVOs, flow cytometry analysis of red and green fluorescence in acridine orange-stained cells using GRN-Hlog mode (500–550 nm) was performed to value the green fluorescence and RED-Hlog mode (>650 nm) and to value the bright red fluorescence. The dot plots were shown in upper of Figure 5, and the mean red: green fluorescence ratio was also plotted in lower of Figure 5. Results showed that, compared with control, PpIX alone slightly increased the strength of red fluorescence (upper-right quadrant) from 0.7% to 3.44% (p > 0.05); ultrasound alone improved the red fluorescence from 0.7% to 23.02% (p < 0.05); SDT treatment significantly increased the red fluorescence from 0.7% to 34.46% (p < 0.01).

Analysis of red and green fluorescence using flow cytometry (upper) and determination of mean red/green fluorescence intensity ratio (lower) in acridine orange-stained cells. GRN-Hlog means green fluorescence scan and RED-Hlog means red fluorescence scan.
Confocal microscope observation
As shown in Figure 6, in control cells, the Mito Tracker Green (mitochondria special dye) green fluorescence had little overlapping with the Atg5 (AVOs marker) red fluorescence. In contrast, SDT-treated cells exhibited obvious punctate colocalization between mitochondria and AVOs. Additionally, SDT treatment caused much more diffused distribution of mitochondria and enhancement of Atg5 fluorescence intensity compared with control cells. Moreover, compared with control, SDT treatment increased the fluorescence intensity of LC3 (an autophagysome marker) and LAMP2 (a lysosome marker) and obviously enhanced the co-localization between them (Fig. 7), suggesting the increased autolysosome formation.
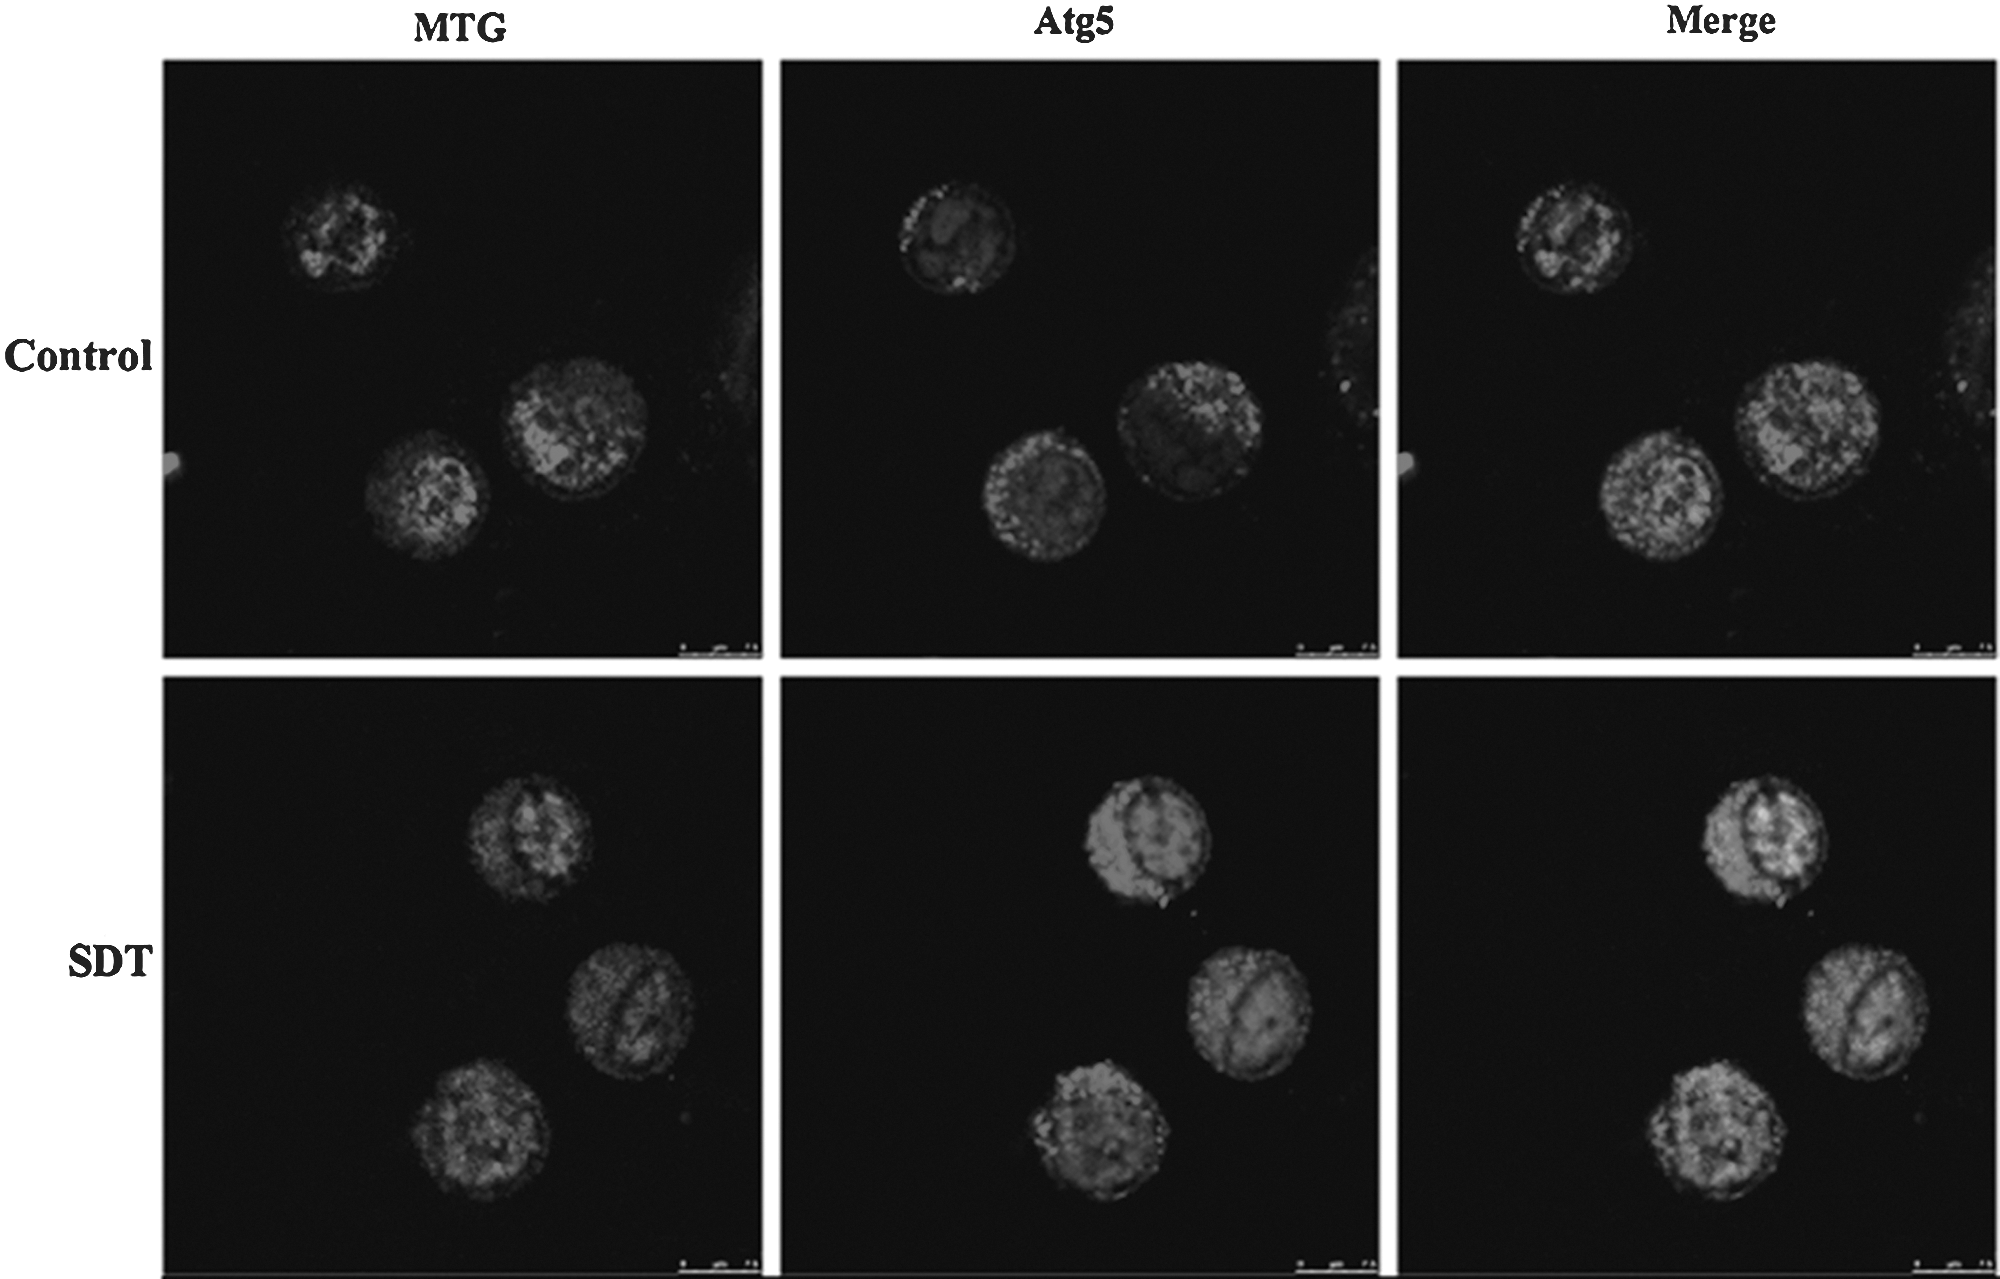
Effect of SDT on the localization of mitochondria and Atg5 protein in L1210 cells.
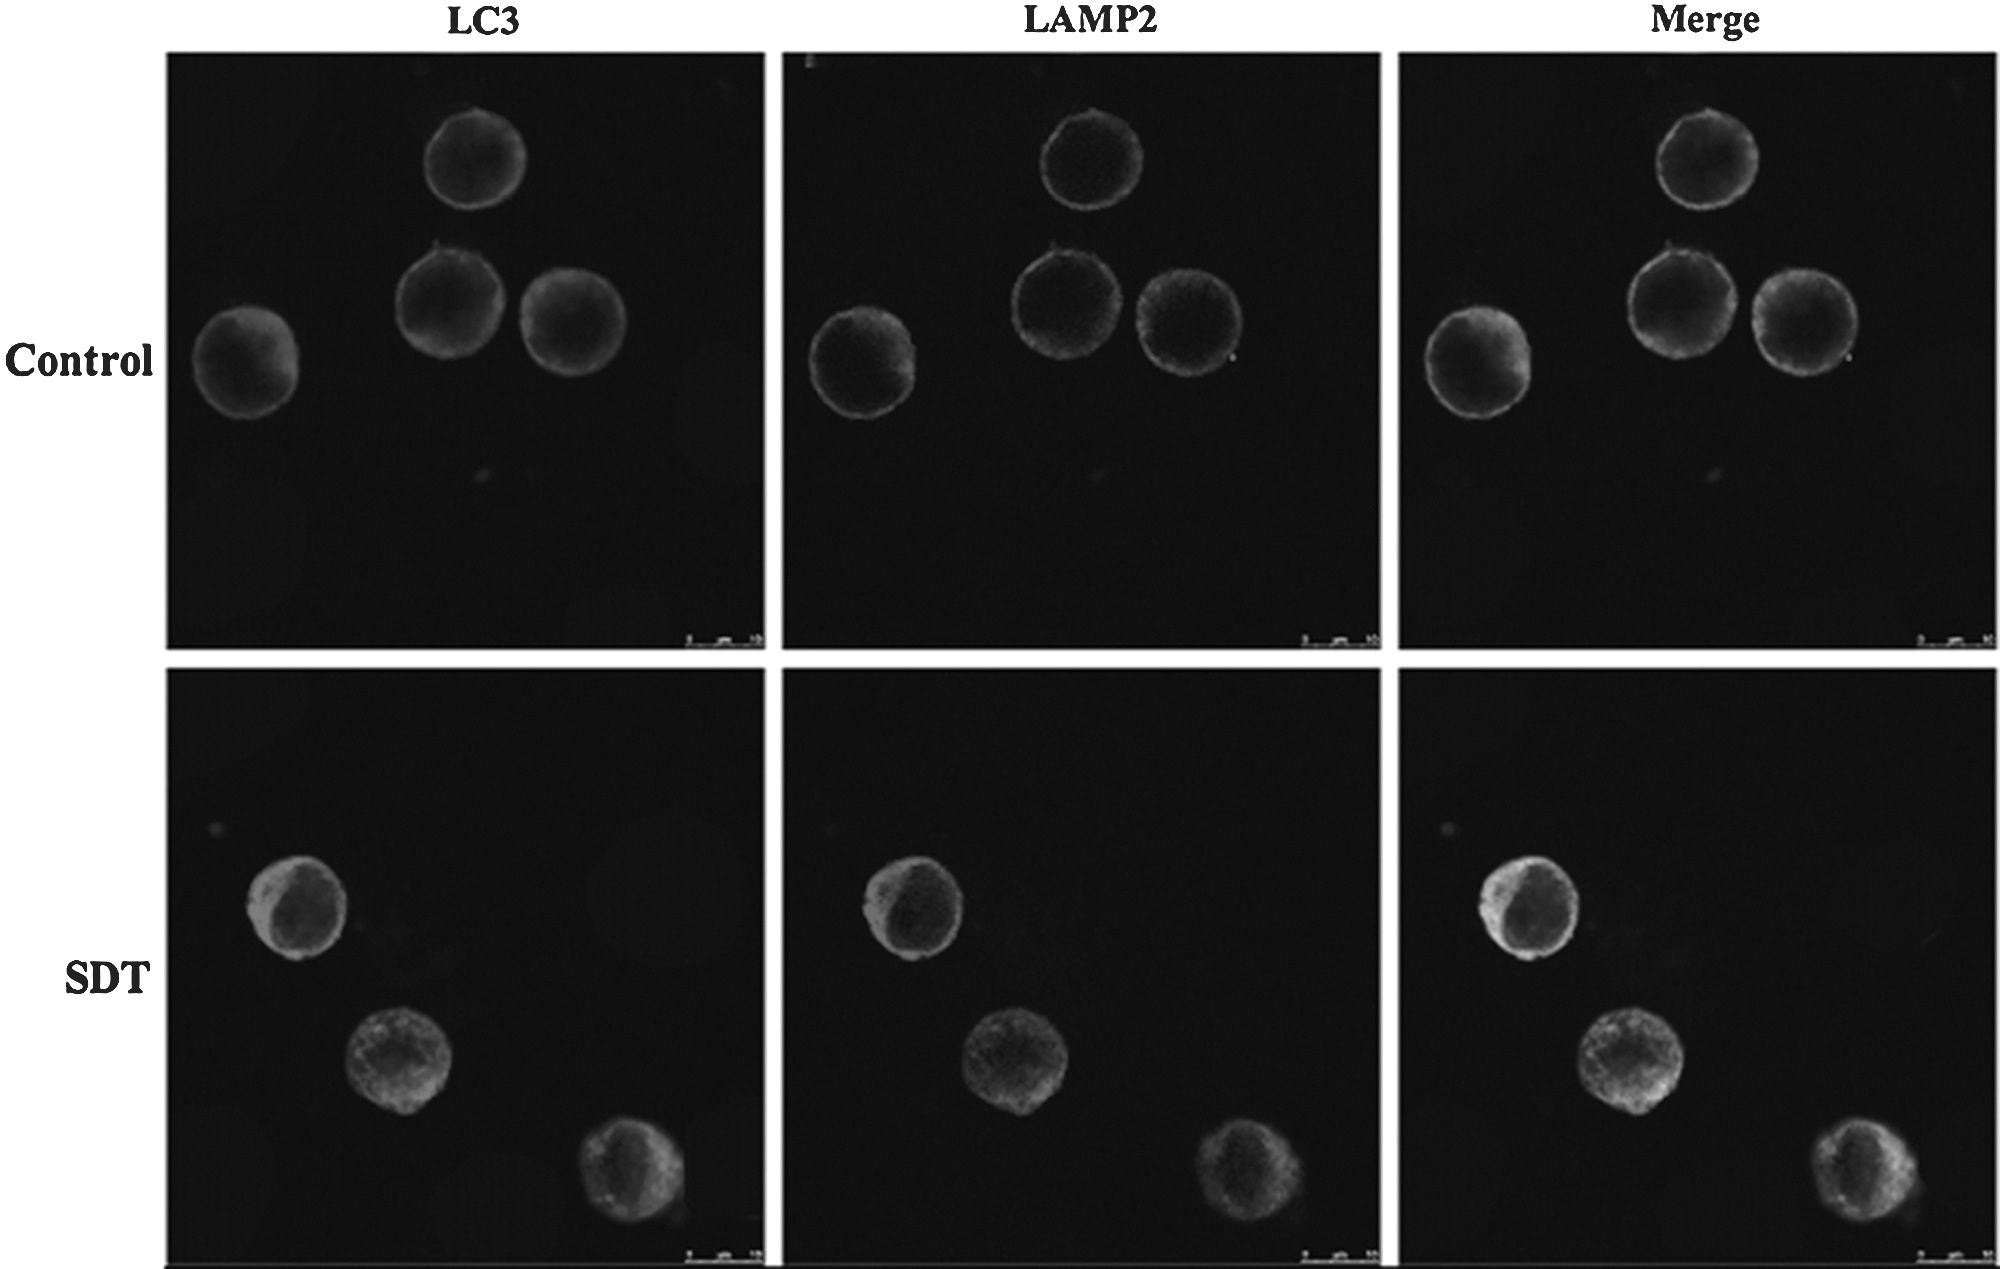
Effect of SDT on the localization of LC3 and LAMP2 in L1210 cells. LC3, light chain 3; LAMP2, lysosomal associated membrane protein 2.
Transmission electron microscope observation
A defining feature of the autophagosome is double-membraned AVOs. The transmission electron microscope observation of L1210 cells is shown in Figure 8. The cells in control group were intact with rich cytoplasm, mitochondria were integrated, and very few vacuoles were observed in the cytoplasm (Fig. 8A). The cell morphology was greatly changed, and many AVOs (magnification, × 10,000) were observed in the cytoplasm of L1210 cells treated with SDT (Fig. 8B) and exhibited typical double-membrane structure associated with autophagy under higher magnifications ( × 30,000) (Fig. 8C).
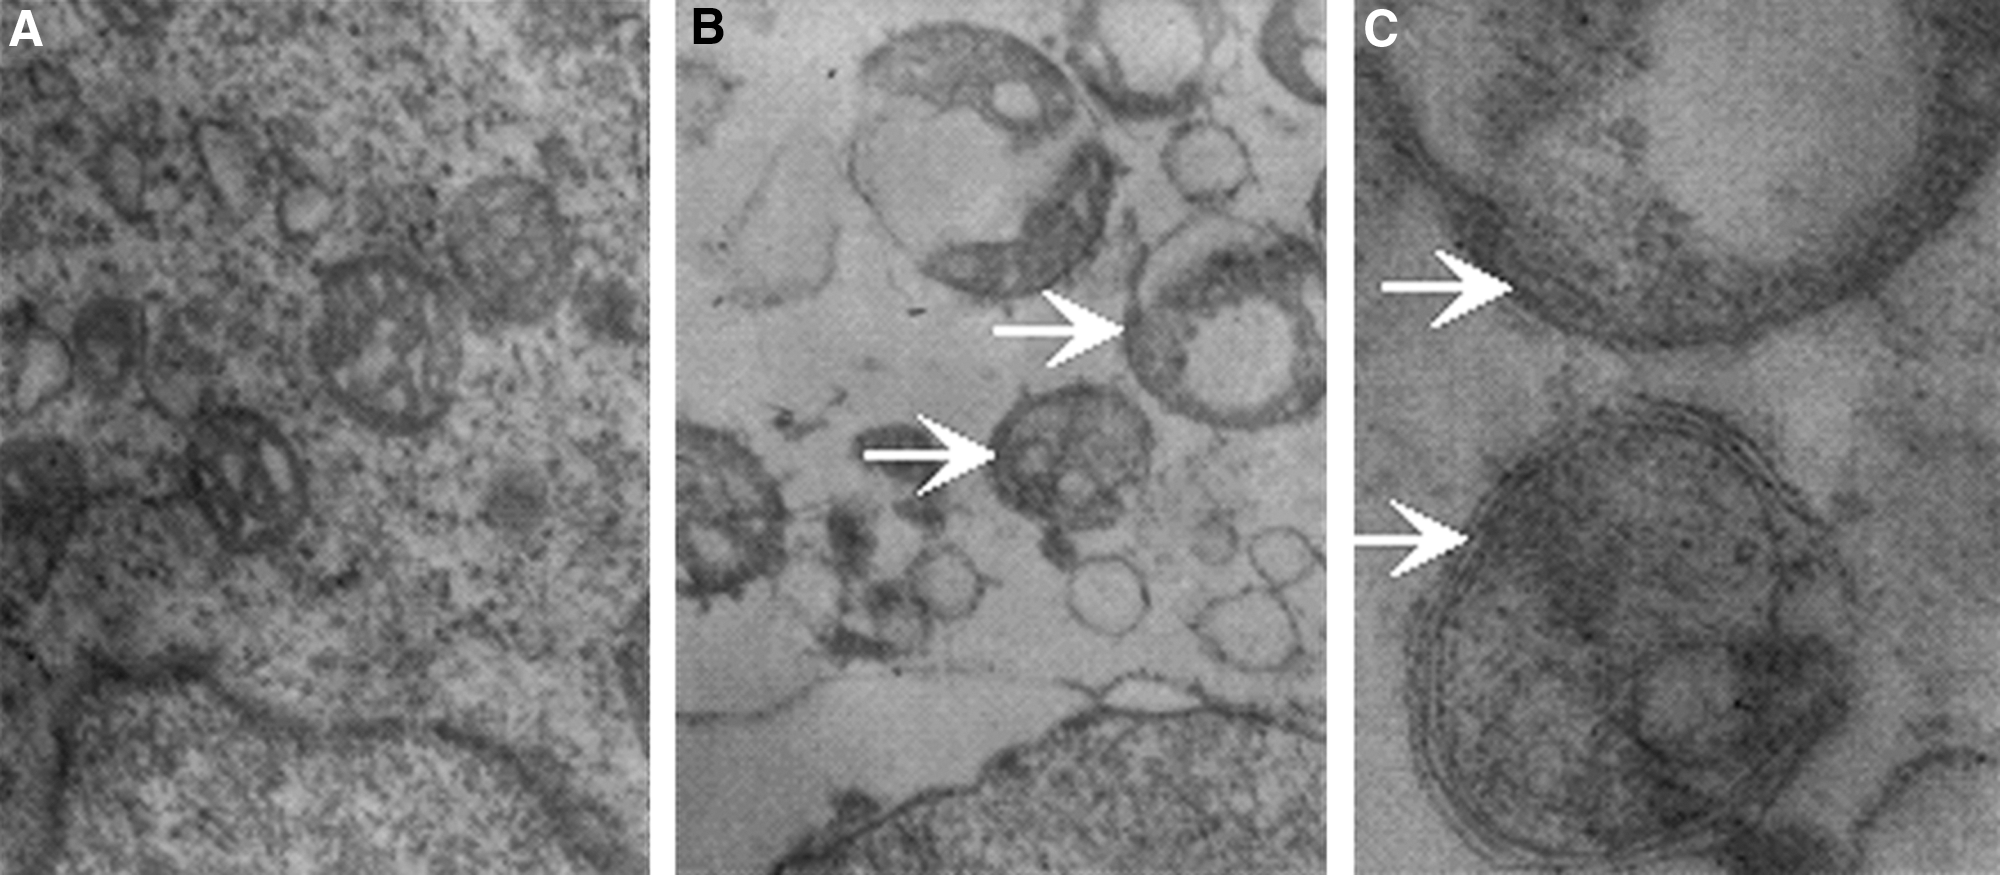
Transmission electron microscope images of L1210 cells.
LC3-II and Atg5 expression
The result of ultrasound irradiation showed slight improvement of LC3-II and Atg5 expression in L1210 cells, whereas ultrasound irradiation with the presence of 1 μg/mL PpIX resulted in more obvious conversion of LC3-I to LC3-II and enhanced Atg5 expression level. PpIX alone had no significant difference from control (Figs. 9 and 10, upper).
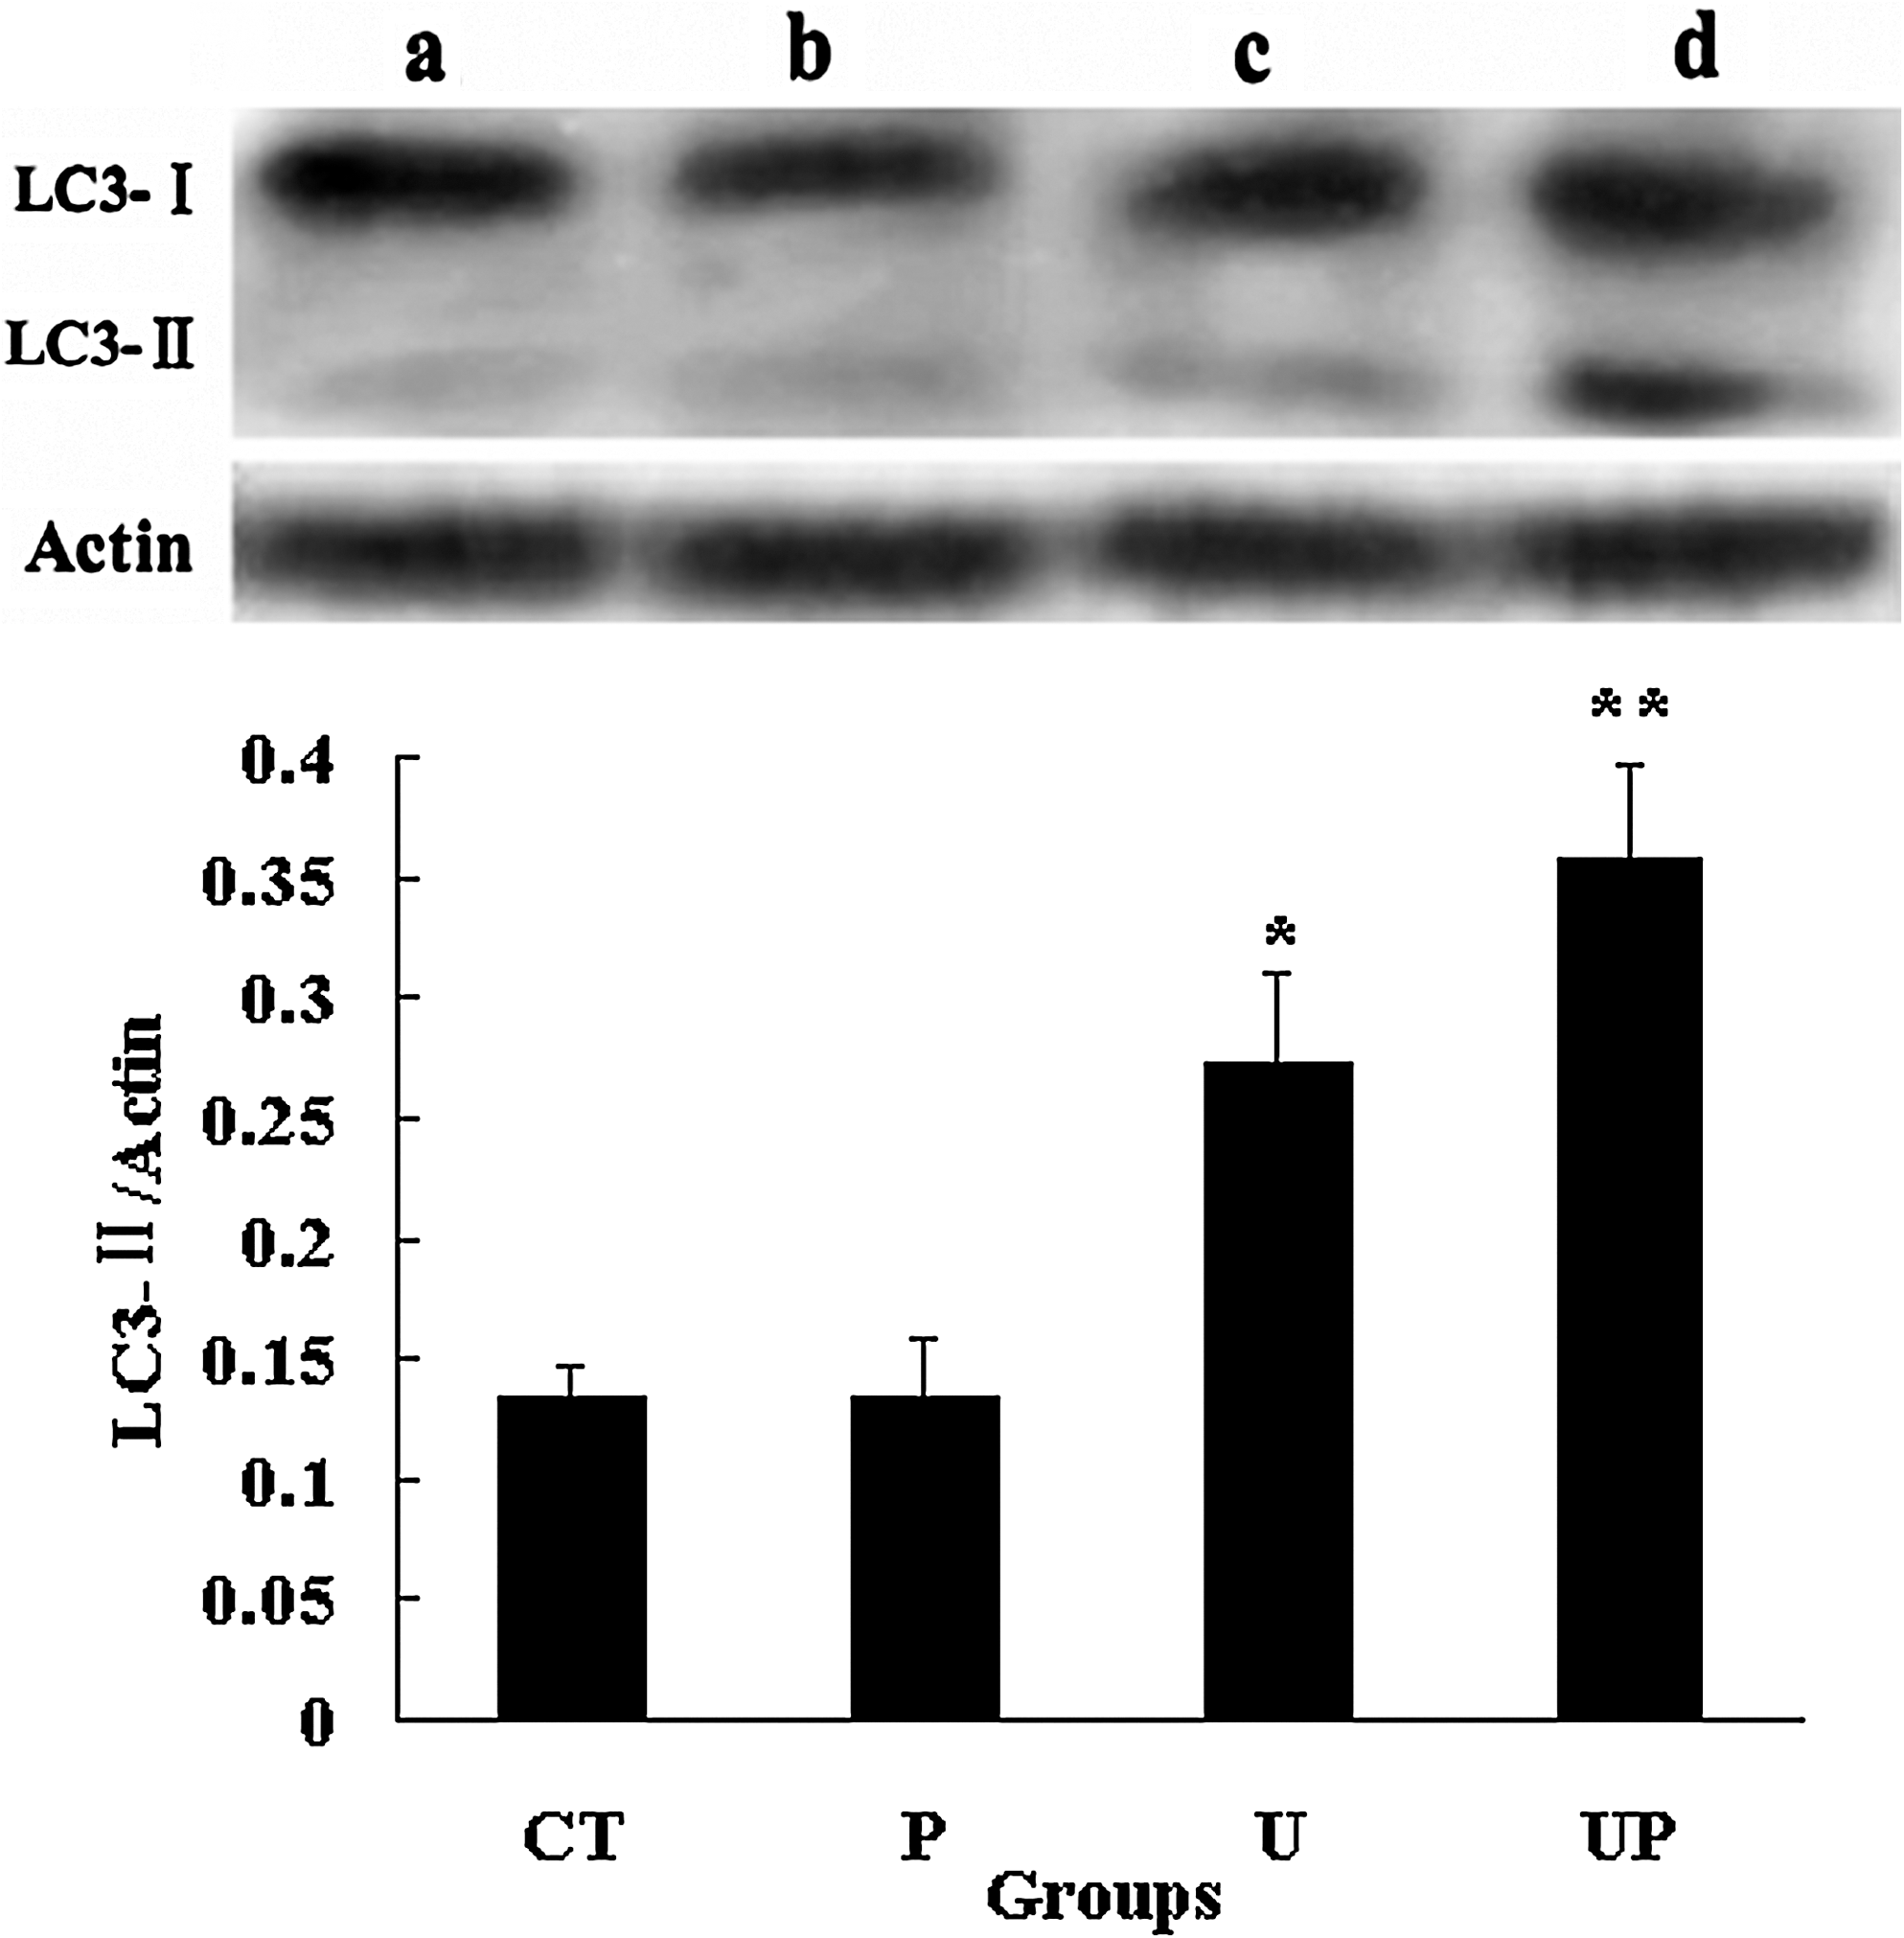
Western blot analysis of LC3 expression in L1210 cells after 6 hours incubation following treatment (upper) and quantification of the ratio of intensities of LC3-II to actin (lower). (a) control group with untreated cell; (b) cells with 1 μg/mL PpIX alone; (c) cells irradiated with 3 W/cm2 ultrasound alone; (d) cells irradiated with 3 W/cm2 ultrasound in the presence of 1 μg/mL PpIX. Actin was used as a loading control. Data are presented as mean ± S.D. of three independent assessments. *p < 0.05 and **p < 0.01 versus untreated controls.
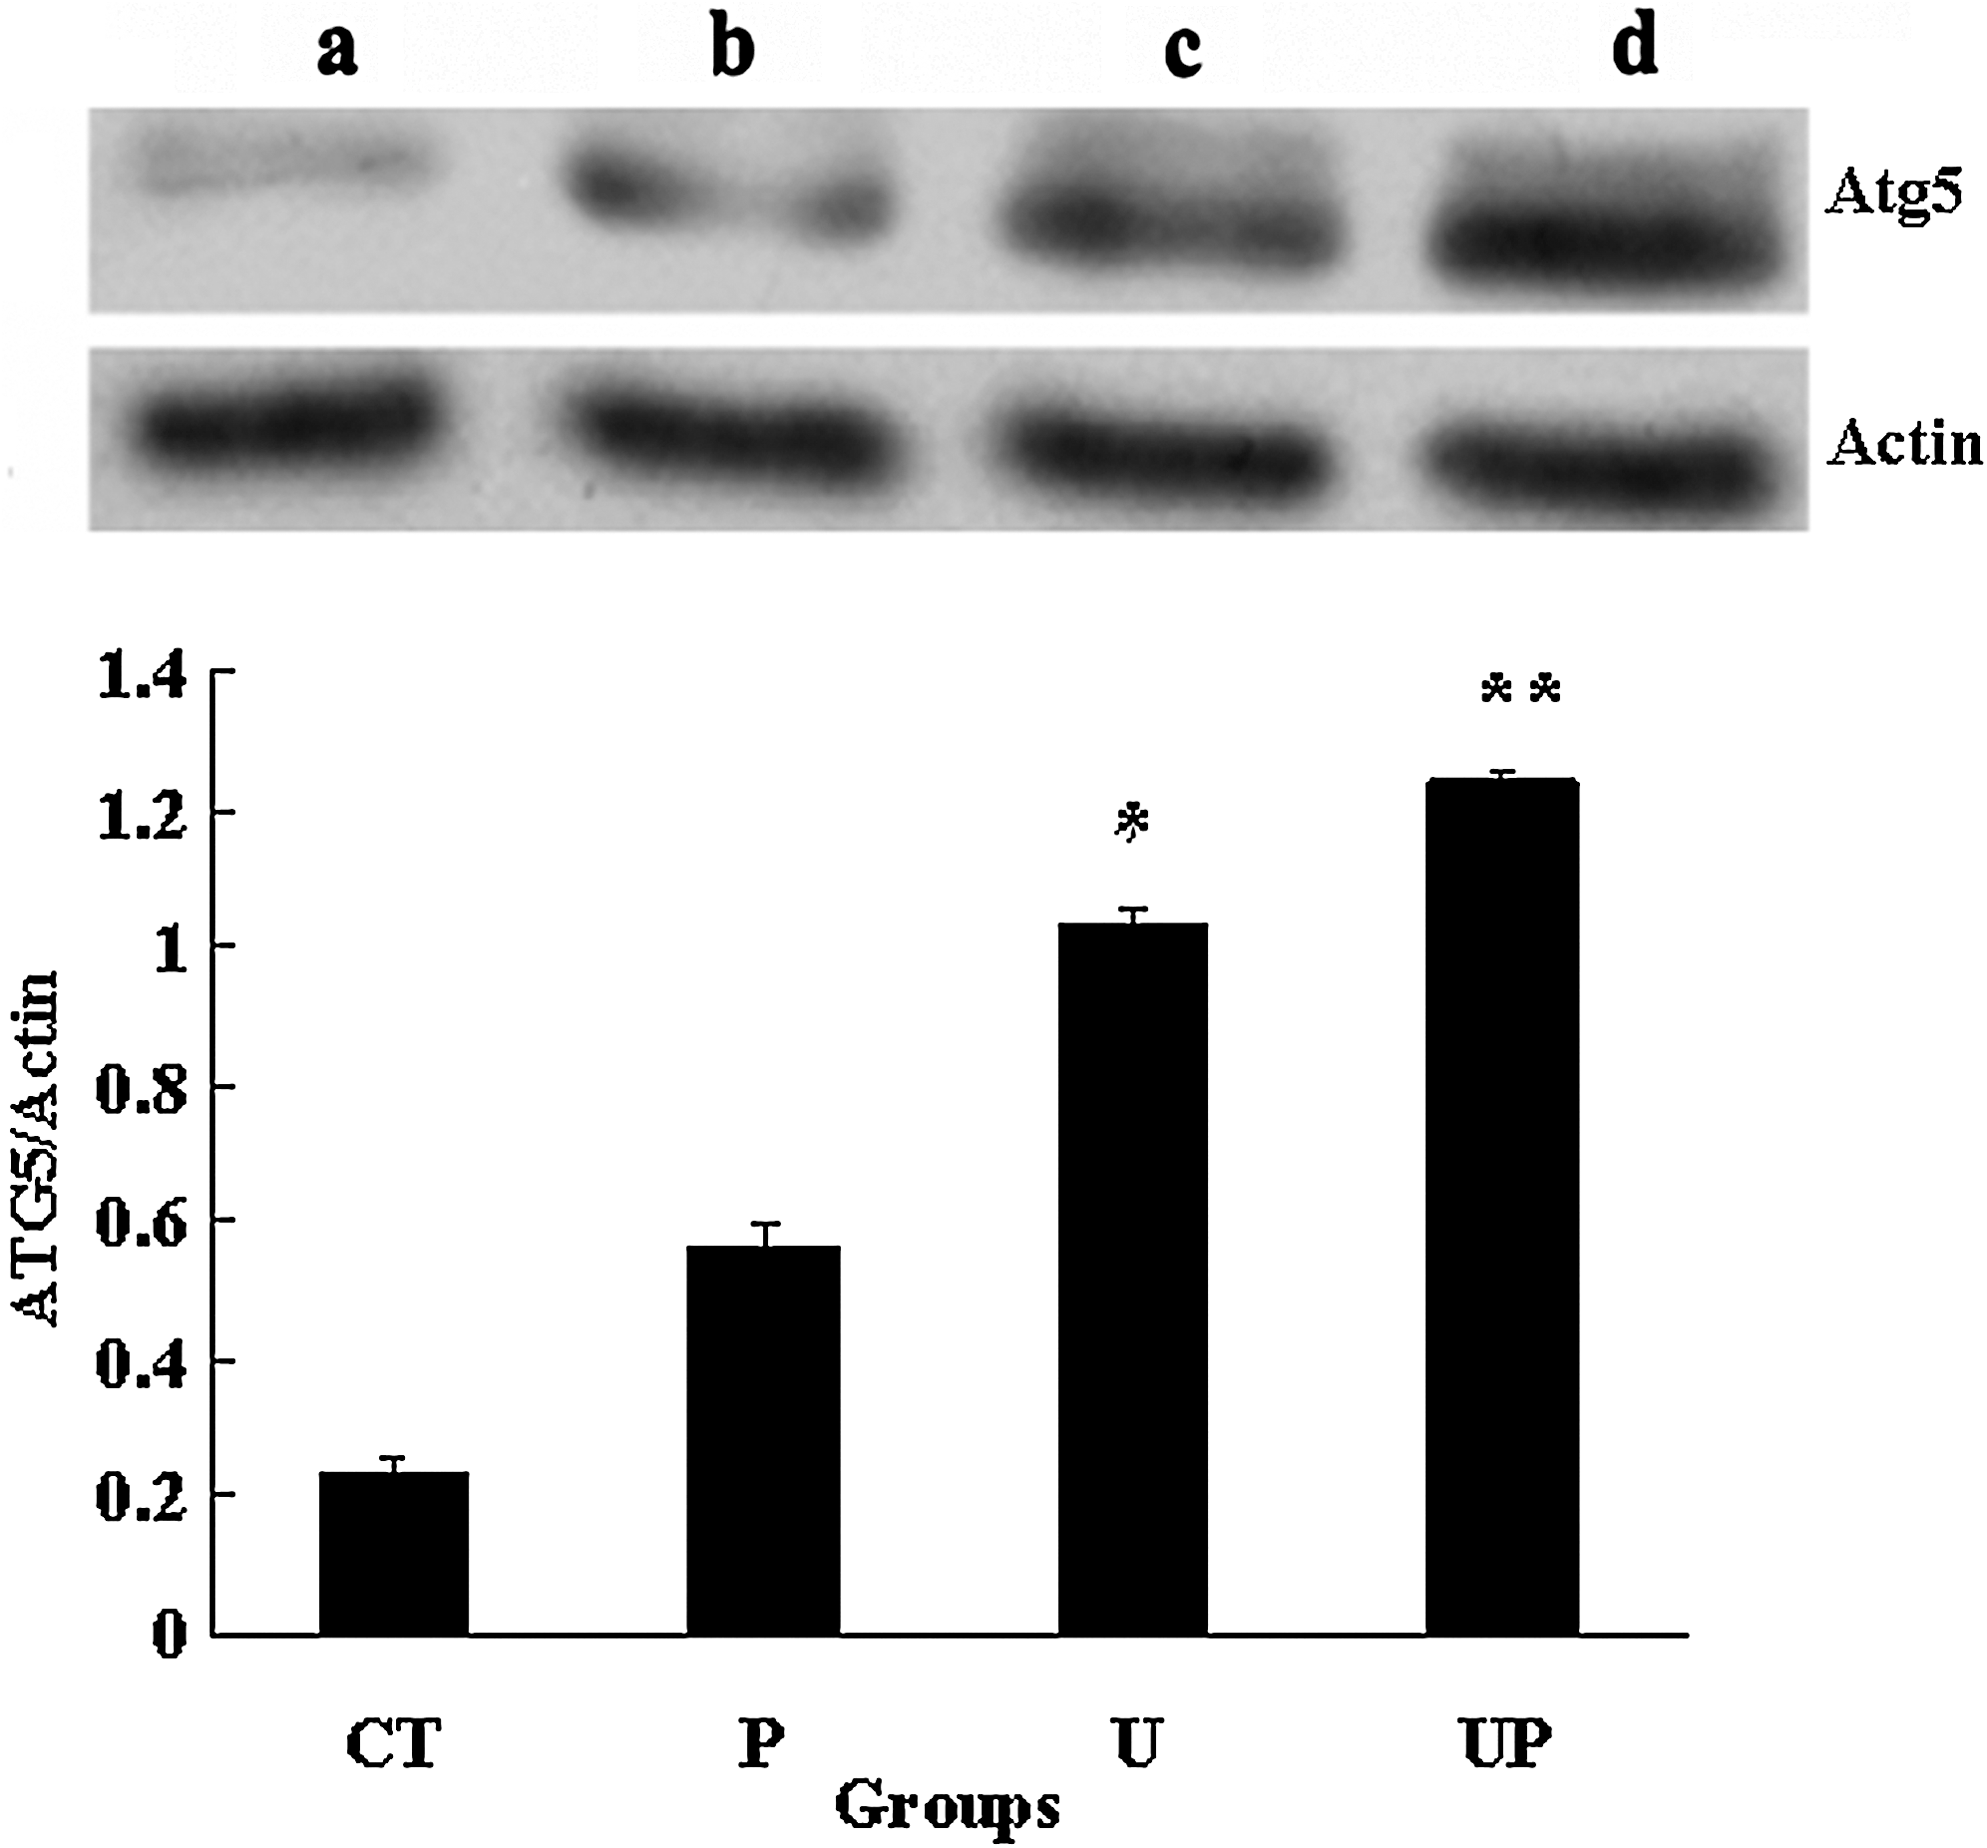
Western blot analysis of Atg5 expression in L1210 cells after 6 hours incubation following treatment (upper) and quantification of the ratio of intensities of Atg5 to actin (lower). (a) control group with untreated cells; (b) cells with 1 μg/mL PpIX alone; (c) cells irradiated with 3 W/cm2 ultrasound alone; (d) cells irradiated with 3 W/cm2 ultrasound in the presence of 1 μg/mL PpIX. Actin was used as a loading control. Data are presented as mean ± S.D. of three independent experiments. *p < 0.05 and **p < 0.01 versus untreated controls.
LC3-II and Atg5 expression were densitometrically quantified and compared with actin. As shown in lower of Figures 9 and 10, compared with control, the ratio of LC3-II to actin in SDT group (the data was 0.37) showed significant conversion of LC3-I to LC3-II (p < 0.05). The ratio of Atg5 to actin in SDT group was 1.24 and in control was 0.13, indicating that SDT treatment increased Atg5 level (p < 0.01).
Discussion
Many recent investigations about SDT mainly focused on the mechanisms of cell-killing effects by using different ultrasound parameters and different sonosensitizers. 11,26 Previously, it was studied that hematoporphyrin and PpIX-mediated SDT could induce significant apoptosis in S180 cells, 27,28 and it was proposed that the apoptotic and necrotic responses simultaneously occurred after SDT treatment. However, as the development of life sciences and the knowledge of cell death modes, the cytotoxicity of SDT protocols could not be totally explained by the induction of apoptosis or necrosis. Autophagy is a relatively newly described cellular response to various cancer therapies. Now, little information about autophagy in SDT has been reported. Therefore, in the current study, it is very important for us to evaluate whether autophagy occurs after SDT at the experimental conditions in murine leukemia L1210 cells.
In this study, SDT-induced cell damage in L1210 cells with ultrasound frequency at 1.1 MHz, ultrasound intensity at 3 W/cm2, and PpIX concentration at 1 μg/mL was investigated. Our results showed that at the given experimental conditions, SDT treatment could significantly increase the apoptotic cells (19.37% in SDT versus 4.94% in control) and decrease the viable cells (30.17% in SDT vs. 94.56% in control) (Fig. 2), suggesting the apoptotic response occurred in L1210 cells after SDT. Further, the autophagic response to SDT was fully investigated by many morphological and biochemical analysis. First, the AVOs formation during autophagy was detected by cell staining assays using MDC and acridine orange, which are not specific for autophagy, but which can be used as methods to monitor the deformation of acidic vesicles, including AVOs and lysosomes. Figure 3 shows that SDT treatment resulted in the appearance of vacuolated cells that labeled strongly with MDC-positive punctuate. Vital staining of L1210 cells with acridine orange displayed the accumulation of AVOs in the cytoplasm, where it was seen as bright red fluorescence, and the corresponding mean red: green fluorescence ratio significantly increased in SDT-treated cells (p < 0.01) (Fig. 5). Second, transmission electron microscope observation confirmed the presence of AVOs. Electron microscopy has been used as the gold standard to demonstrate autophagosomes in cells. 29 Compared with control, the cytoplasm of L1210 cells treated with ultrasound and PpIX exhibited that many vesicles displayed the typical double-membraned structure associated with autophagy (Fig. 8), which provide the best evidence for autophagy occurrence after SDT. Third, to confirm the presence of autophagosomes and autophagolososomes, immunofluorescence studies were performed. Compared with control, in SDT group, the cells showed that a large number of aggregated mitochondria overlapped with Atg5 (a marker for AVOs), thus implying that the mitochondria damage plays a role in induction of autophagy mediated by PpIX-SDT (Fig. 6). Confocal microscopy also showed that LC3, another AVOs marker, displayed increased fluorescence staining and co-localized well with LAMP2, a lysosome membrane marker protein, indicating the fusion of autophagosomes and lysosomes (Fig. 7). Finally, SDT-induced autophagy of L1210 cells was evaluated by measuring the changes of autophagy-associated protein expressions. Western blots proved an indication of LC3-II expression and an improved Atg5 expression level after ultrasound treatment in the presence of PpIX (Figs. 9 and 10). Taken together, the findings suggested that autophagy occurred in L1210 cells after SDT at the experimental conditions.
Autophagy plays different roles in response to different stresses. Autophagy can function as a cell survival mechanism. In the issue, Paglin et al. reported the inducement of autophagy in MCF-7 cells response to ionizing irradiation, 30 which indicated that autophagy can protect MCF-7 cells from apoptotic cell death. Other studies show that autophagy is a negative regulator of cell survival. When cells were treated with PDT, autophagy was observed and shown to be cytotoxic. 14,31 Chiu et al. reported the cells lacking procaspase-3 or Bax died after PDT, but did not display the characteristics of necrotic or apoptotic cell death. 32 Mouse embryonic fibroblasts that lack Bax and Bak are resistant to apoptosis but can die by autophagic cell death. 33
There are few reports about autophagic response to SDT therapy. In our experimental system, our initial results showed that autophagy involved in PpIX-SDT induced cell damage. However, the exact role of autophagy induced by SDT still remains unclear. The strategy aimed at enhancing tumor cell death is the ultimate goal for cancer therapy. The role of autophagy in different therapies is cell line and stimulus dependent. 34 Therefore, the hypothesis is proposed that, if autophagy promotes cell death, an inducer of autophagy may be more efficacious in SDT treatment.
Conclusions
This study investigated the cell-killing effect of murine leukemia L1210 by SDT, which provides new ideas about cellular response to PpIX-SDT, including apoptotic and autophagic responses. However, the role of autophagy in SDT-mediated cancer therapy needs further investigation. To obtain more convincing data, some specific and quantitative methods should be performed to evaluate the role of autophagy in SDT-induced cell damage.
Footnotes
Acknowledgments
This work was supported by the Natural Science Foundation for the Youth (No. 10904087, 81000999), the Fundamental Research Funds for the Central Universities (2010ZYGX016), and the Innovation Funds of Graduate Programs, SNU (2010CXS016).
Disclosure Statement
No conflicting financial interests exist.