A kinetic model analysis has been proposed to assess absorbed dose to an arbitrary tissue in [18F]-fluorodeoxyglucose ([18F]-FDG) positron emission tomography (PET) imaging, whose efficiency is demonstrated in physiological brain, by comparing calculated estimates with human literature data. First, an analytic solution for the tissue [18F]-FDG time–activity curve has been derived from kinetic model analysis, assuming reversible radiotracer trapping. Then, integrating this solution from the time of tracer administration to infinity yielded analytic solutions for cumulated activity (and hence for the ratio of cumulated/injected activity) and the percentage of tracer uptake for an arbitrary tissue. Calculated estimates from these analytic solutions for the whole gray and white matter have been found in very good agreement with human literature data: 7.55 versus 6.57 (±1.51) MBq·hour (per unit of administered activity of 37 MBq), 0.204 versus 0.220 (±0.090) hour, and 6.25% versus 6.90%, respectively. This study concludes that the proposed kinetic model analysis has proven effective in assessing absorbed dose to human brain in [18F]-FDG PET imaging, under physiological conditions. This study suggests that this model could be further developed to assess absorbed dose to other tissues, either healthy or pathological, and also it could be further considered by involving other PET tracer features.
Introduction
According to the MIRD formalism, calculation of absorbed dose from internally distributed radionuclides requires the assessment of cumulated activity in source regions “h,” that is, \documentclass{aastex}\usepackage{amsbsy}\usepackage{amsfonts}\usepackage{amssymb}\usepackage{bm}\usepackage{mathrsfs}\usepackage{pifont}\usepackage{stmaryrd}\usepackage{textcomp}\usepackage{portland,xspace}\usepackage{amsmath,amsxtra}\pagestyle{empty}\DeclareMathSizes{10}{9}{7}{6}\begin{document}$${ \widetilde A}_{ \rm h}$$\end{document} (MBq·hour), which is combined with the mean absorbed dose in region “k” per unit cumulated activity in region “h,” that is, S(rk ← rh) (Gy/MBq·hour), to yield the average dose D(rk) (Gy) in target region “k”1:\documentclass{aastex}\usepackage{amsbsy}\usepackage{amsfonts}\usepackage{amssymb}\usepackage{bm}\usepackage{mathrsfs}\usepackage{pifont}\usepackage{stmaryrd}\usepackage{textcomp}\usepackage{portland,xspace}\usepackage{amsmath,amsxtra}\pagestyle{empty}\DeclareMathSizes{10}{9}{7}{6} \begin{document} \begin{align*}{\overline D} ( r_{ \rm k} ) = \sum_{ \rm h} { \widetilde A}_{ \rm h} \times S ( r_{ \rm k} \leftarrow r_{ \rm h} ) \tag{1} \end{align*} \end{document}
Tables of S values are given in MIRD pamphlets for various radionuclides and organs (or can be calculated using MIRD phantom as well), and Ãh is given by:\documentclass{aastex}\usepackage{amsbsy}\usepackage{amsfonts}\usepackage{amssymb}\usepackage{bm}\usepackage{mathrsfs}\usepackage{pifont}\usepackage{stmaryrd}\usepackage{textcomp}\usepackage{portland,xspace}\usepackage{amsmath,amsxtra}\pagestyle{empty}\DeclareMathSizes{10}{9}{7}{6} \begin{document} \begin{align*}{\widetilde A}_{ \rm h} = \int_0^{ \infty} {A_{ \rm h} ( t ) dt} \tag{2} \end{align*} \end{document}
where Ah(t) (MBq) is the activity in region “h” at time t after tracer injection.
Positron emission tomography (PET) using [18F]-fluorodeoxyglucose ([18F]-FDG) imaging in cancer patients provides images reflecting the increased glycolysis of cancer cells in clinical routine.2 However, some healthy tissues may also exhibit an increased glucose metabolism, such as the brain.3 Therefore, even under physiological conditions, absorbed dose to brain should be considered in current [18F]-FDG PET imaging.
Analytic solution for tissue [18F]-FDG time–activity curve (TAC) has been previously derived from a two-compartment model analysis assuming reversible radiotracer trapping.4 This tissue TAC actually represents Ah(t) in Equation 2, allowing derivation of the number of disintegrations that have occurred from the time of tracer administration (zero) to (theoretically) infinity, that is, cumulated activity \documentclass{aastex}\usepackage{amsbsy}\usepackage{amsfonts}\usepackage{amssymb}\usepackage{bm}\usepackage{mathrsfs}\usepackage{pifont}\usepackage{stmaryrd}\usepackage{textcomp}\usepackage{portland,xspace}\usepackage{amsmath,amsxtra}\pagestyle{empty}\DeclareMathSizes{10}{9}{7}{6}\begin{document}$${ \widetilde A}_{ \rm h}$$\end{document}. The aims of this theoretical work were to propose a kinetic model analysis to assess absorbed dose to an arbitrary tissue in [18F]-FDG PET imaging and to demonstrate the analytic solution efficiency in assessing absorbed dose to human brain, by comparing calculated estimates with literature data.5,6
Materials and Methods
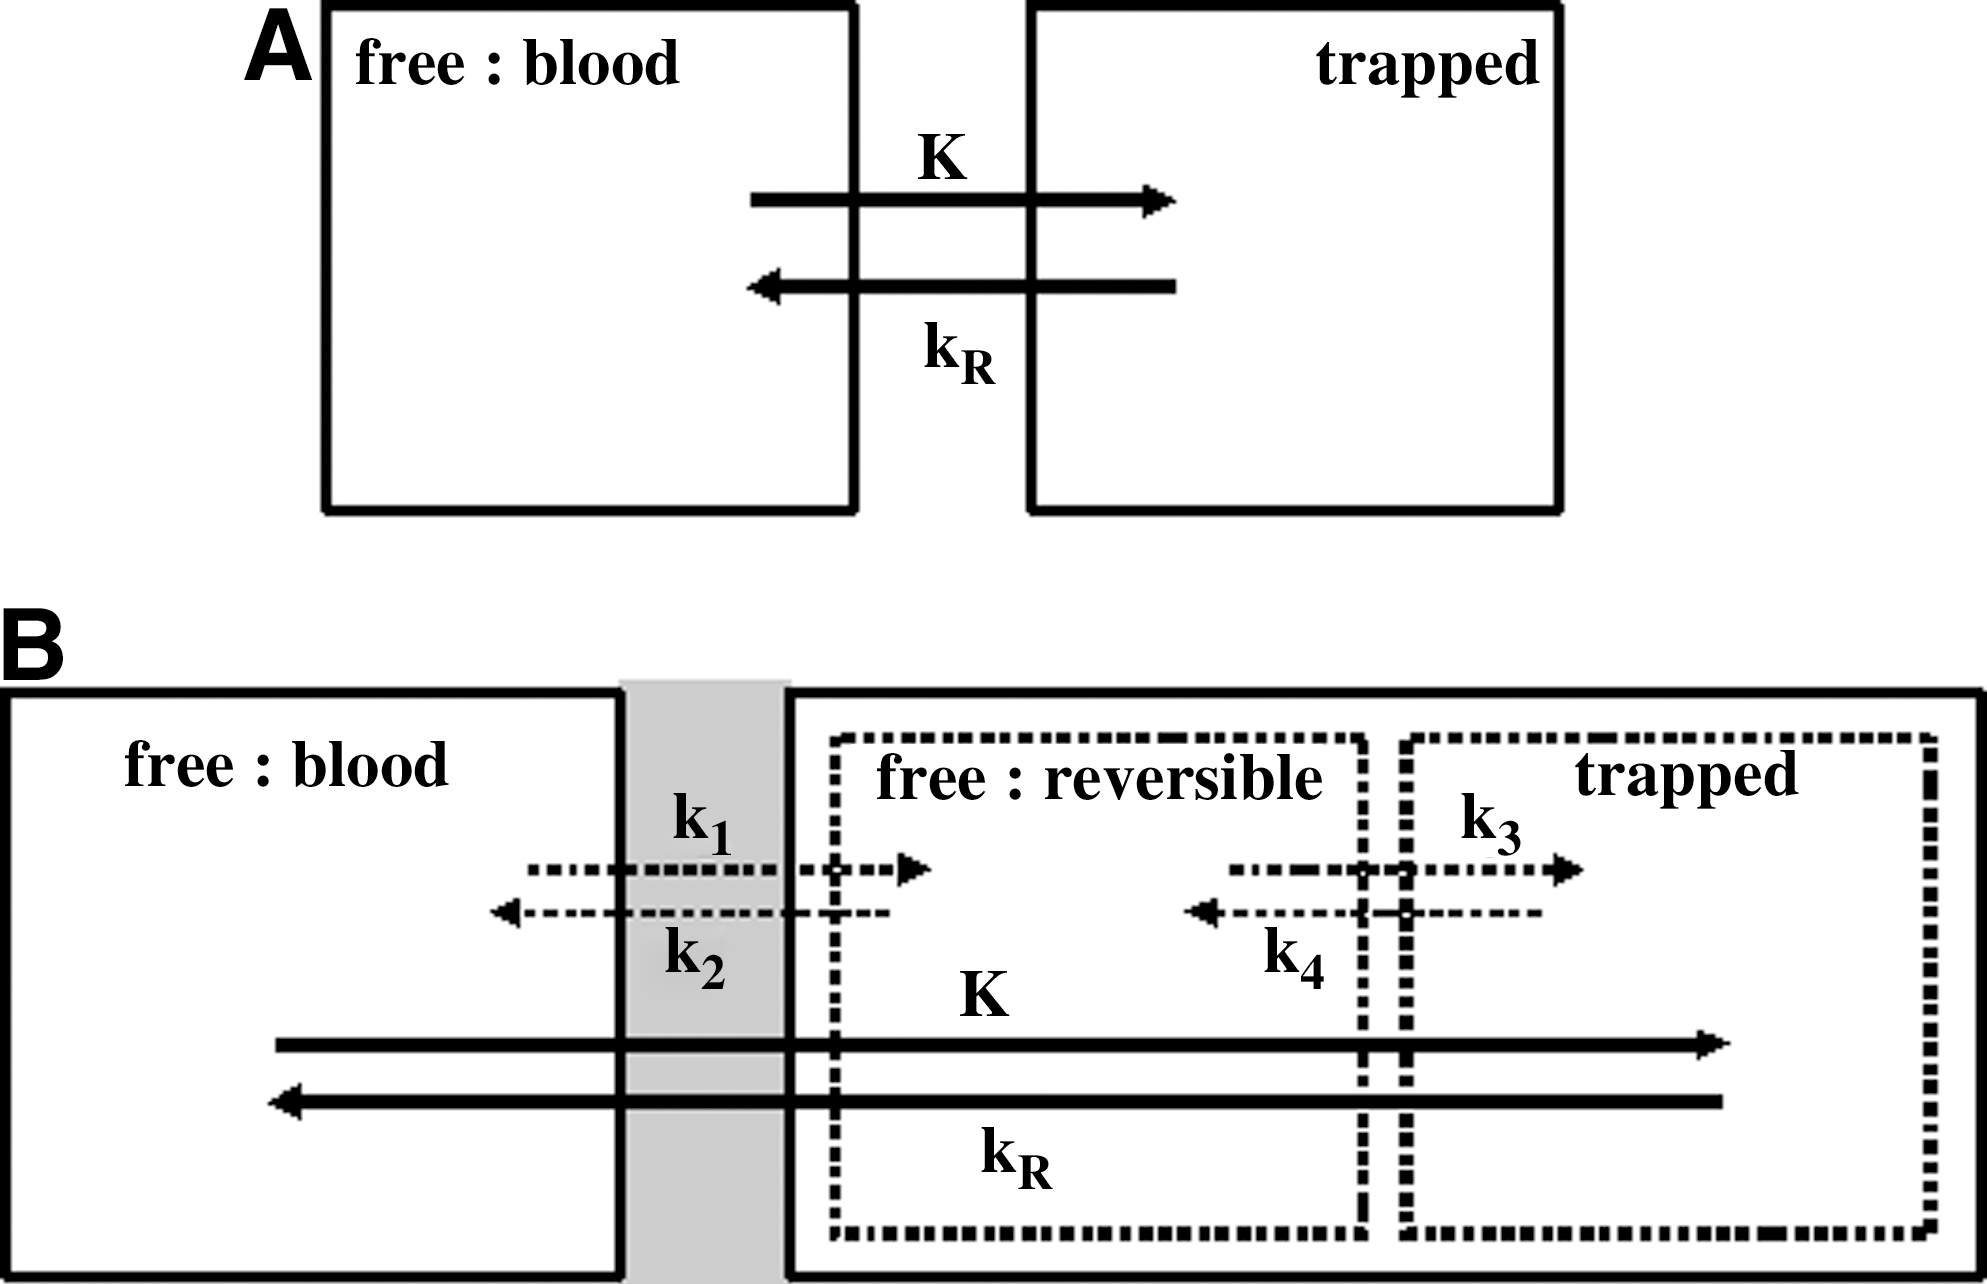
A two-compartment model analysis has been previously developed to assess radiotracer uptake in tissues, assuming constant uptake and constant release rate, K (minute−1) and kR (minute−1), respectively (Fig. 1A).4 The rate of trapped radiotracer change per tissue unit volume at steady state, that is, dCT/dt (mL−1 minute−1), is described by the following differential equation:\documentclass{aastex}\usepackage{amsbsy}\usepackage{amsfonts}\usepackage{amssymb}\usepackage{bm}\usepackage{mathrsfs}\usepackage{pifont}\usepackage{stmaryrd}\usepackage{textcomp}\usepackage{portland,xspace}\usepackage{amsmath,amsxtra}\pagestyle{empty}\DeclareMathSizes{10}{9}{7}{6} \begin{document} \begin{align*} dC_{ \rm } ( t ) / dt = KC_{ \rm p} ( t ) - k_{ \rm R} C_{ \rm T}( t ) - \lambda C_{ \rm T} ( t ) \tag{3} \end{align*} \end{document}
where Cp(t) is the tracer plasma concentration at time t (mL−1), and λ accounts for the physical decay of the trapped radiotracer (λ = 0.693/110 minute−1). Assuming that Cp(t) decays tri-exponentially, the [18F]-FDG plasma TAC, that is, the input function, can be expressed as follows7–10:\documentclass{aastex}\usepackage{amsbsy}\usepackage{amsfonts}\usepackage{amssymb}\usepackage{bm}\usepackage{mathrsfs}\usepackage{pifont}\usepackage{stmaryrd}\usepackage{textcomp}\usepackage{portland,xspace}\usepackage{amsmath,amsxtra}\pagestyle{empty}\DeclareMathSizes{10}{9}{7}{6} \begin{document} \begin{align*} \lambda C_{ \rm p} ( t ) = \sum \limits_{i = 1}^3 { \lambda \ C_{ \rm i} e^{ - \alpha_{ \rm i}t}} \tag{4} \end{align*} \end{document}
where Ci (mL−1) and αi (minute−1) are the coefficients of the tri-exponential input function. Therefore, Equation 3 yields the trapped [18F]-FDG TAC per tissue unit volume:\documentclass{aastex}\usepackage{amsbsy}\usepackage{amsfonts}\usepackage{amssymb}\usepackage{bm}\usepackage{mathrsfs}\usepackage{pifont}\usepackage{stmaryrd}\usepackage{textcomp}\usepackage{portland,xspace}\usepackage{amsmath,amsxtra}\pagestyle{empty}\DeclareMathSizes{10}{9}{7}{6} \begin{document} \begin{align*} \lambda C_{ \rm T} ( t ) = K \sum \limits_{i = 1}^3 \lambda \ C_{ \rm i} \ ( e^{ - ( \lambda + k_{ \rm R} ) t} - e^{ - \alpha _{ \rm i}t} ) / ( \alpha _{ \rm i} - \lambda - k_{ \rm R} ) \tag{5} \end{align*} \end{document}
where λCT(t) is actually Ah(t) per tissue unit volume that is expressed in Equation 2. As a consequence, the cumulated activity of trapped radiotracer per tissue unit volume (Equation 2) is given by analytic integration of λCT(t) from zero to infinity:\documentclass{aastex}\usepackage{amsbsy}\usepackage{amsfonts}\usepackage{amssymb}\usepackage{bm}\usepackage{mathrsfs}\usepackage{pifont}\usepackage{stmaryrd}\usepackage{textcomp}\usepackage{portland,xspace}\usepackage{amsmath,amsxtra}\pagestyle{empty}\DeclareMathSizes{10}{9}{7}{6} \begin{document} \begin{align*}{\widetilde A}_{ \rm trapped} = K \,/ ( \lambda + k_{ \rm R} ) \sum \limits_{i = 1}^3 ( \lambda \ C_{ \rm i} / \alpha_{ \rm i} ) \tag{6} \end{align*} \end{document}
Note that such an equation can be derived from a more general equation, assuming time-decaying uptake and constant release rate, as shown in the Appendix.
The organ-absorbed dose should also take into account the number of disintegrations that have occurred from free tracer in the blood and interstitial fractions, that is, \documentclass{aastex}\usepackage{amsbsy}\usepackage{amsfonts}\usepackage{amssymb}\usepackage{bm}\usepackage{mathrsfs}\usepackage{pifont}\usepackage{stmaryrd}\usepackage{textcomp}\usepackage{portland,xspace}\usepackage{amsmath,amsxtra}\pagestyle{empty}\DeclareMathSizes{10}{9}{7}{6}\begin{document}$${\widetilde A}_{ \rm other}$$\end{document}:\documentclass{aastex}\usepackage{amsbsy}\usepackage{amsfonts}\usepackage{amssymb}\usepackage{bm}\usepackage{mathrsfs}\usepackage{pifont}\usepackage{stmaryrd}\usepackage{textcomp}\usepackage{portland,xspace}\usepackage{amsmath,amsxtra}\pagestyle{empty}\DeclareMathSizes{10}{9}{7}{6} \begin{document} \begin{align*}{ \widetilde A}_{ \rm other} = F \sum \limits_{i = 1}^3 { ( \lambda \ C_{ \rm i} / \alpha_{ \rm i} ) } \tag{7} \end{align*} \end{document}
where F is the sum of the fractions of free [18F]-FDG in blood and reversible compartment: F = fblood + frev, respectively. Fraction of free [18F]-FDG in blood perfusing the region, that is, fblood, has been assessed by authors.11,12 Fraction of free [18F]-FDG in reversible compartment, that is, frev, assumes that tracer concentration in reversible compartment is that of the blood and is assessed as follows:\documentclass{aastex}\usepackage{amsbsy}\usepackage{amsfonts}\usepackage{amssymb}\usepackage{bm}\usepackage{mathrsfs}\usepackage{pifont}\usepackage{stmaryrd}\usepackage{textcomp}\usepackage{portland,xspace}\usepackage{amsmath,amsxtra}\pagestyle{empty}\DeclareMathSizes{10}{9}{7}{6} \begin{document} \begin{align*} f_{ \rm rev} = f^{ \prime}_{ \rm rev} C_{ \rm rev} ( t ) / C_{ \rm p} ( t ) \cong f^{ \prime}_{ \rm rev} k_1 / ( k_2 + k_3 ) \tag{8} \end{align*} \end{document}
where Crev(t) is the actual tracer concentration in the reversible compartment and \documentclass{aastex}\usepackage{amsbsy}\usepackage{amsfonts}\usepackage{amssymb}\usepackage{bm}\usepackage{mathrsfs}\usepackage{pifont}\usepackage{stmaryrd}\usepackage{textcomp}\usepackage{portland,xspace}\usepackage{amsmath,amsxtra}\pagestyle{empty}\DeclareMathSizes{10}{9}{7}{6}\begin{document}$$f^{\prime}_{\rm rev}$$\end{document} (%) is the relative tissue free-[18F]-FDG space.13 In the framework of a three-compartment model analysis (Fig. 1B), the ratio k1/(k2 + k3) is the so-called volume of distribution.11 It involves the rate constants k1 and k2 (minute−1) accounting for forward and reversed transport between blood and reversible compartment, respectively, and the rate constant k3 and k4 (minute−1) accounting for forward and reversed transport between reversible and trapped compartments. In this connection, K is (k1k3)/(k2 + k3) and kR is (k2k4)/(k2 + k3).11,14,15
(A) The kinetic compartment model considers two compartments, which correspond to free blood [18F]-FDG and [18F]-FDG trapped in intracellular cytoplasm, respectively. The [18F]-FDG uptake and release rate constants, K and kR, respectively, are the transport rate constants between the two compartments. (B) In comparison with the two-compartment model, the three-compartment model introduces a reversible intermediate compartment that takes into account free [18F]-FDG in interstitial fluid and intracellular cytoplasm. The rate constants k1 and k2 account for forward and reversed transport between blood and reversible compartments across the blood brain barrier (gray area), respectively. The rate constants k3 and k4 account for forward and reversed transport between the reversible and trapping compartments, that is, for [18F]-FDG phosphorylation by hexokinase and [18F]-FDG-6-PO4 dephosphorylation by G-6-phosphatase, respectively. [18F]-FDG, [18F]-fluorodeoxyglucose.
Finally, assuming that organ uptake is homogeneous, total cumulated activity \documentclass{aastex}\usepackage{amsbsy}\usepackage{amsfonts}\usepackage{amssymb}\usepackage{bm}\usepackage{mathrsfs}\usepackage{pifont}\usepackage{stmaryrd}\usepackage{textcomp}\usepackage{portland,xspace}\usepackage{amsmath,amsxtra}\pagestyle{empty}\DeclareMathSizes{10}{9}{7}{6}\begin{document}$${\widetilde A}_{\rm Tot}$$\end{document} for the whole organ volume Vorg is\documentclass{aastex}\usepackage{amsbsy}\usepackage{amsfonts}\usepackage{amssymb}\usepackage{bm}\usepackage{mathrsfs}\usepackage{pifont}\usepackage{stmaryrd}\usepackage{textcomp}\usepackage{portland,xspace}\usepackage{amsmath,amsxtra}\pagestyle{empty}\DeclareMathSizes{10}{9}{7}{6} \begin{document} \begin{align*}{\widetilde A}_{ \rm Tot} = V_{ \rm org} \left[ F + K / ( \lambda + k_{ \rm R} ) \right] \ \sum \limits_{i = 1}^3 ( \lambda C_{ \rm i} / \alpha_{ \rm i} ) \tag{9} \end{align*} \end{document}
where Σ(λCi/αi) is the area under the curve (AUC) of tracer input function.
Further, total cumulated activity can be alternatively expressed as follows5:\documentclass{aastex}\usepackage{amsbsy}\usepackage{amsfonts}\usepackage{amssymb}\usepackage{bm}\usepackage{mathrsfs}\usepackage{pifont}\usepackage{stmaryrd}\usepackage{textcomp}\usepackage{portland,xspace}\usepackage{amsmath,amsxtra}\pagestyle{empty}\DeclareMathSizes{10}{9}{7}{6} \begin{document} \begin{align*}{\widetilde A}_{ \rm Tot} = p A_{ \rm inj} \ \tau \tag{10} \end{align*} \end{document}
where Ainj is the injected activity, and p is the percentage of organ tracer uptake, which is usually assessed from measured activity in vivo. The residence time τ is given by:\documentclass{aastex}\usepackage{amsbsy}\usepackage{amsfonts}\usepackage{amssymb}\usepackage{bm}\usepackage{mathrsfs}\usepackage{pifont}\usepackage{stmaryrd}\usepackage{textcomp}\usepackage{portland,xspace}\usepackage{amsmath,amsxtra}\pagestyle{empty}\DeclareMathSizes{10}{9}{7}{6} \begin{document} \begin{align*} \tau = 1 / ( \lambda + k_{ \rm R} ) \tag{11} \end{align*} \end{document}
Therefore, combining Equations 9–11, and assuming that the part of free tracer in blood and interstitial volume to organ-absorbed dose is much lower than that of trapped tracer, yields a simple analytic expression for “p”:\documentclass{aastex}\usepackage{amsbsy}\usepackage{amsfonts}\usepackage{amssymb}\usepackage{bm}\usepackage{mathrsfs}\usepackage{pifont}\usepackage{stmaryrd}\usepackage{textcomp}\usepackage{portland,xspace}\usepackage{amsmath,amsxtra}\pagestyle{empty}\DeclareMathSizes{10}{9}{7}{6} \begin{document} \begin{align*} p = K ( V_{ \rm org} / A_{ \rm inj} ) \sum \limits_{i = 1}^3 ( \lambda \ C_{ \rm i} / \alpha_{ \rm i} ) \tag{12} \end{align*} \end{document}
Results
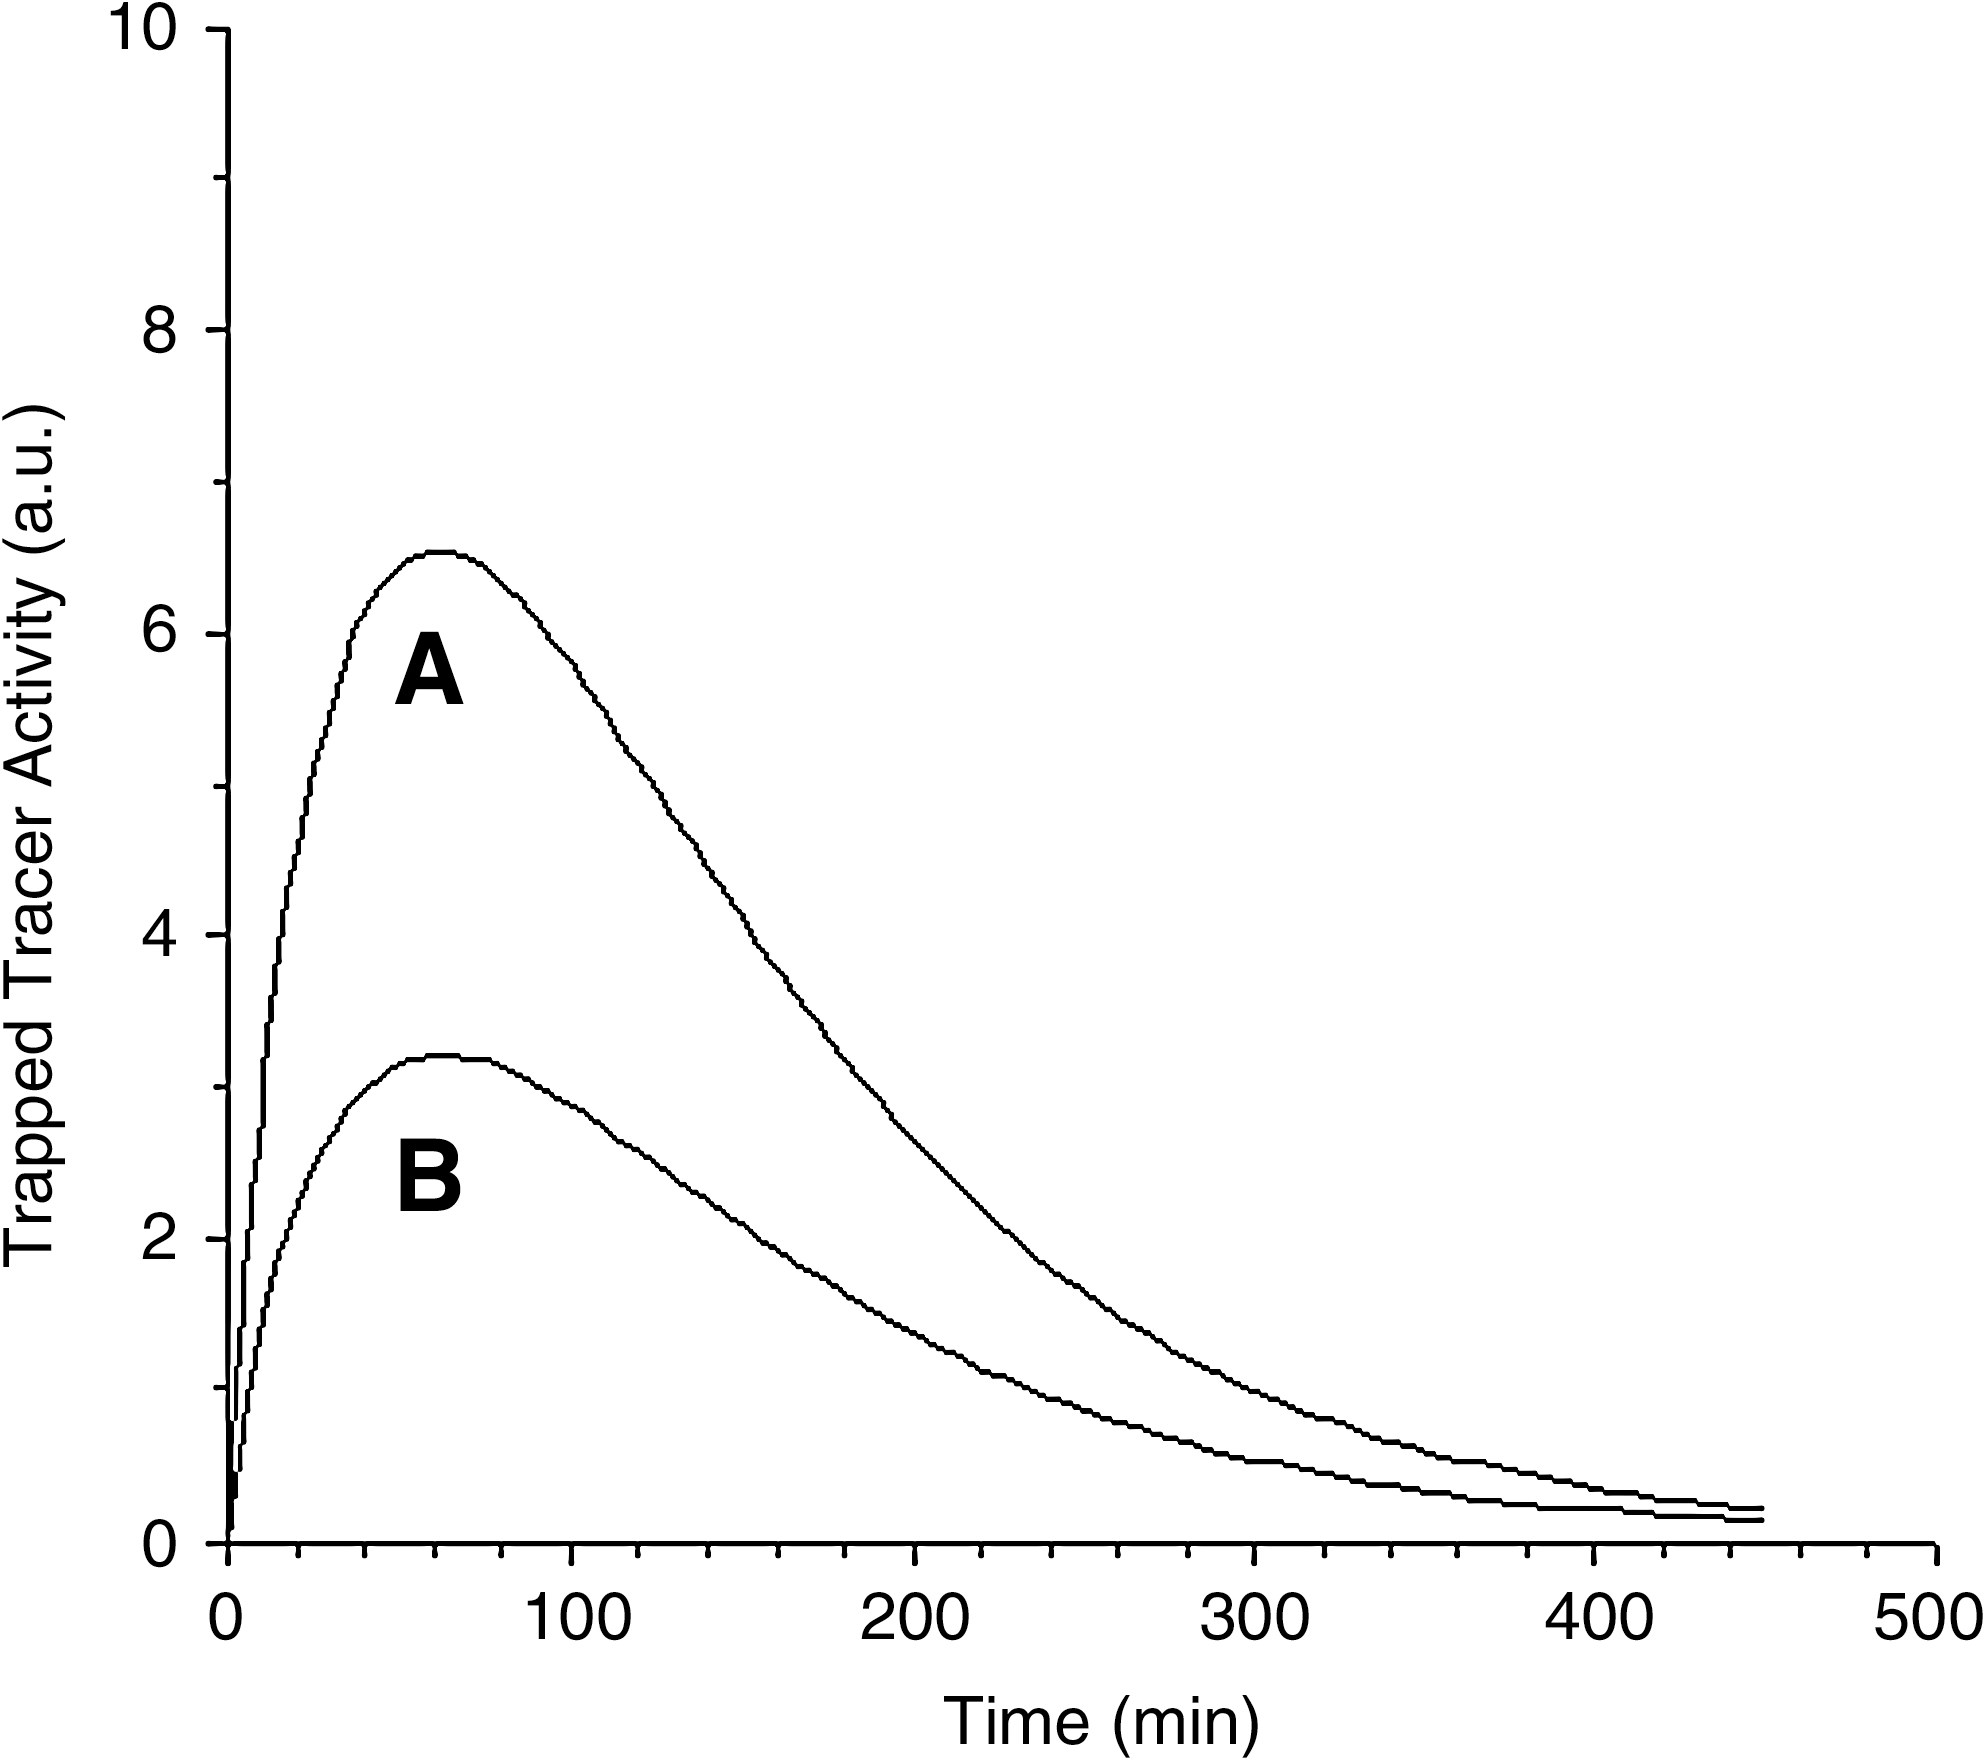
Figure 2A, B shows the trapped [18F]-FDG TAC per unit volume from Equation 5 for gray and white matter, respectively. [18F]-FDG uptake and release rate constants for gray and white matter have been calculated from literature data: K = 0.0329 and 0.0158 minute−1 and kR = 0.0046 and 0.0041 minute−1, respectively.11 The [18F]-FDG blood TAC was assumed to decay tri-exponentially and the constants by Vriens et al. were used without decay correction: λC1 = 2.7850, λC2 = 0.7085, λC3 = 0.7721, α1 = 6.1393 minute−1, α2 = 0.2604 minute−1, α3 = 0.0207 minute−1.10,16 The activity peak is observed 60–65 minutes after injection for both curves. The AUCs in Figure 2A, B represent the cumulated activity of trapped tracer per tissue unit volume, that is, \documentclass{aastex}\usepackage{amsbsy}\usepackage{amsfonts}\usepackage{amssymb}\usepackage{bm}\usepackage{mathrsfs}\usepackage{pifont}\usepackage{stmaryrd}\usepackage{textcomp}\usepackage{portland,xspace}\usepackage{amsmath,amsxtra}\pagestyle{empty}\DeclareMathSizes{10}{9}{7}{6}\begin{document}$${\widetilde A}_{ \rm trapped}$$\end{document} (Equation 6), for gray and white matter, respectively.
Trapped [18F]-FDG activity per tissue unit volume (arbitrary units) versus time (Equation 5): (A) gray matter; (B) white matter. No correction for 18F physical decay was applied to the input function or tissue activity.
Total cumulated activities (involving trapped and free tracer) have been calculated from Equation 9 for both gray and white matter (70-kg-weight patient), per unit of administered activity of 37 MBq: ATot = 5.00 and 2.55 MBq·hour, respectively. These calculations assumed that brain was 50% gray matter and 50% white matter, 805 mL volume each (as 2.3% of the body weight, assuming brain density of 1).11,17 An initial distribution volume of 12.7 L for [18F]-FDG has been used.10 The sum F involved several parameters that were obtained from different literature references, for gray and white matter: fblood = 0.038 and 0.025, \documentclass{aastex}\usepackage{amsbsy}\usepackage{amsfonts}\usepackage{amssymb}\usepackage{bm}\usepackage{mathrsfs}\usepackage{pifont}\usepackage{stmaryrd}\usepackage{textcomp}\usepackage{portland,xspace}\usepackage{amsmath,amsxtra}\pagestyle{empty}\DeclareMathSizes{10}{9}{7}{6}\begin{document}$$f^{ \prime}_{\rm rev} = 0.170$$\end{document} and 0.170, k1/(k2 + k3) = 0.593 and 0.383, respectively.11–13 The ratio of F to K/(λ + kR) (Equation 9) was 4.6% and 5.9% for gray and white matter, respectively. A total cumulated activity for the whole gray and white matter has been compared with that by Mejia et al.: (5.00 + 2.55 = ) 7.55 versus 6.57 (±1.51) MBq·hour, per unit of administered activity of 37 MBq.5 In this connection, the ratio of cumulated/injected activity \documentclass{aastex}\usepackage{amsbsy}\usepackage{amsfonts}\usepackage{amssymb}\usepackage{bm}\usepackage{mathrsfs}\usepackage{pifont}\usepackage{stmaryrd}\usepackage{textcomp}\usepackage{portland,xspace}\usepackage{amsmath,amsxtra}\pagestyle{empty}\DeclareMathSizes{10}{9}{7}{6}\begin{document}$${\widetilde A}_{\rm Tot} / A_{\rm inj}$$\end{document} has been compared with human literature data: 0.204 versus 0.220 (±0.090) and 0.210 hours, respectively.6,18 For a 60-kg-weight patient, a reduced estimate for brain volume (1380 instead of 1610 mL) yields reduced values for \documentclass{aastex}\usepackage{amsbsy}\usepackage{amsfonts}\usepackage{amssymb}\usepackage{bm}\usepackage{mathrsfs}\usepackage{pifont}\usepackage{stmaryrd}\usepackage{textcomp}\usepackage{portland,xspace}\usepackage{amsmath,amsxtra}\pagestyle{empty}\DeclareMathSizes{10}{9}{7}{6}\begin{document}$${\widetilde A}_{\rm Tot} = 6.47$$\end{document} MBq·hour and \documentclass{aastex}\usepackage{amsbsy}\usepackage{amsfonts}\usepackage{amssymb}\usepackage{bm}\usepackage{mathrsfs}\usepackage{pifont}\usepackage{stmaryrd}\usepackage{textcomp}\usepackage{portland,xspace}\usepackage{amsmath,amsxtra}\pagestyle{empty}\DeclareMathSizes{10}{9}{7}{6}\begin{document}$${\widetilde A}_{\rm Tot} / A_{\rm inj} = 0.175$$\end{document} hours.17
Percentages of tracer uptake have been calculated from Equation 11 for both gray and white matter: p = 8.44% and 4.05%, respectively. Their mean value, that is, percentage of whole brain uptake, assuming brain was 50% gray matter and 50% white matter, has been compared with those by Mejia et al. and of ICRP publication: 6.25% versus 6.90% and 8.00%, respectively.5,6 For a 60-kg-weight patient, a reduced estimate for brain volume (1380 instead of 1610 mL) yields a reduced value of p = 5.36%.17
Discussion
A two-compartment model analysis has allowed us to derive analytic solutions for cumulated activity and percentage of tracer uptake for an arbitrary tissue. In [18F]-FDG PET imaging, for the whole gray and white matter, under physiological conditions, results of calculation from these analytic solutions have been found to be in very good agreement with human literature data. In addition, ratio of cumulated/injected activity has also been found to be in very good agreement with human literature data.6,18
Analytic solutions for both cumulated activity and percentage of tracer uptake for an arbitrary tissue emphasize the role of the AUC of the tracer input function, that is, the sum Σ(λCi/αi) (Equations 9 and 12). In particular, this sum involves decay constants αi related to clearance of the tracer from blood, which depends on the patient renal function and also on the injection technique.10 These constants have not been corrected for 18F physical decay, because it has been recently shown that such a correction cannot be conceptually justified.16Equation 9 also weighs uptake versus decay-and-release with the simple ratio K/(λ + kR). Further, Equation 9 shows that the part of the fractions of free [18F]-FDG in blood and reversible compartment, that is, F, is much lower than that of the ratio K/(λ + kR) for assessment of total cumulated activity \documentclass{aastex}\usepackage{amsbsy}\usepackage{amsfonts}\usepackage{amssymb}\usepackage{bm}\usepackage{mathrsfs}\usepackage{pifont}\usepackage{stmaryrd}\usepackage{textcomp}\usepackage{portland,xspace}\usepackage{amsmath,amsxtra}\pagestyle{empty}\DeclareMathSizes{10}{9}{7}{6}\begin{document}$${\widetilde A}_{ \rm Tot}$$\end{document}, representing only 4.6% and 5.9% of this ratio for gray and white matter, respectively. These figures further justify to neglect F in deriving analytic expression for percentage of tracer uptake (Equation 12). (Note also that, by definition, tracer uptake should not take into account free [18F]-FDG in blood and reversible compartment.)
Different contributions to uncertainty of the estimates in the present study can be considered. Mean or median values from literature were used for uptake rate constant K, release rate constant kR, fraction of free [18F]-FDG in blood and reversible compartment F, and the [18F]-FDG input function.10–13 Each of these values involves measurement uncertainty. However, in the present study, it is suggested that the major uncertainty of the estimates is very likely related to estimating the gray and white matter volumes (and hence the whole brain volume), which are both involved in Equations 9 and 12. As an example, for a 60-kg-weight patient instead of a 70-kg-weight patient, a reduced estimate for brain volume (as 2.3% of the body weight) yields a 17% reduced value of ATot, ATot/Ainj, and p.17 Nevertheless, it should be emphasized that these values remain within the uncertainty domain given in literature data for ATot and ATot/Ainj (percentage of tracer uptake was given without uncertainty).
Conclusions
In clinical routine, brain exhibits an increased glucose metabolism, and therefore, absorbed dose should be considered. The proposed kinetic model analysis has proven effective in noninvasively assessing absorbed dose to human brain in current [18F]-FDG PET imaging, under physiological conditions. This study suggests that this model could be further developed to assess absorbed dose to other tissues, either healthy or pathological, and also it could be further considered by involving other PET tracer features.
Footnotes
Disclosure Statement
No competing financial interests exist.
Appendix
References
1.
LoevingerR, BudingerTF, WatsonEE. MIRD Primer for Absorbed Dose Calculations (Revised)New York: The Society of Nuclear Medicine, 1991.
LaffonE, AllardM, MarthanR, DucassouD. A method to quantify at late imaging a release rate of 18F-FDG in tissues. C R Biol, 2005; 328:767.
5.
MejiaA, NakamuraT, MasatoshiIet al. Estimation of absorbed doses in humans due to intravenous administration of fluorine-18-fluorodeoxyglucose in PET studies. J Nucl Med, 1991; 32:699.
6.
ICRP. Annals of the ICRP 106. Radiation dose to patients from radiopharmaceuticals. Ann ICRP, 2008; 38:85.
7.
FengD, HuangSC, WangX. Models for computer simulation studies of input functions for tracer kinetic modeling with positron emission tomography. Int J Biomed Comp, 1993; 32:95.
EberlS, AnayatAR, FultonRRet al. Evaluation of two population-based input functions for quantitative neurological FDG PET studies. Eur J Nucl Med, 1997; 24:299.
10.
VriensD, de Geus-OeiL-F, OyenWJG, VisserEP. A curve fitting approach to estimate the arterial plasma input function for the assessment of glucose metabolic rate and response to treatment. J Nucl Med, 2009; 50:1933.
11.
PhelpsME, HuangSC, HoffmanEJet al. Tomographic measurement of local cerebral glucose metabolic rate in humans with (F-18)2-Fluoro-2-Deoxy-D-Glucose: Validation of method. Ann Neurol, 1979; 6:371.
12.
LeendersKL. PET: Blood flow and oxygen consumption in brain tumors. J Neuro-Oncol, 1994; 22:269.
13.
RaichleME, LarsonKB, PhelpsMEet al. In vivo measurement of brain glucose transport and metabolism employing glucose-11C. Am J Physiol, 1975; 228:1936.
14.
SokoloffL, ReivichM, KennedyCet al. The |14C]deoxyglucose method for the measurement of local cerebral glucose utilization: Theory, procedure, and normal values in the conscious and anesthetized albino rat. J Neurochem, 1977; 28:897.
15.
PatlakCS, BlasbergRG. Graphical evaluation of blood-to-brain transfer constants from multiple-time uptake data: Generalizations. J Cereb Blood Flow Metab, 1985; 5:584.
16.
LaffonE, BarretO, MarthanR, DucassouD. Is the physical decay correction of the 18F-FDG input function in dynamic PET imaging justified?J Nucl Med Technol, 2009; 37:1.