
Abstract
The cell cluster modeling is a widely used method to estimate the small-scale dosimetry and provides the implication for a clinic. This work evaluated the effect of different regular cluster models on the radiobiological outputs for 211At-radioimmunotherapy. The cell activity threshold was estimated using a tumor control probability of 0.90. Basically, regular models show similar features with cluster configuration and cell dimension variation. However, their individual results such as the cumulated activity threshold per cell and the prescription dose per volume should not be substituted reciprocally. The tissue composed of smaller cells or midcell packing will need a little more high prescription dose per volume. The radiation sensitivity parameters in a linear-quadratic model are critical to decide the radiobiological response with dose. The cumulated cell activity threshold increases exponentially with α decreasing, and its influence on the big cell dimension is more than on the small one. The different subsources affect radioresistant organs or tissues more remarkably than radiosensitive ones, especially the cells with large cytoplasm. The heterogeneous activity of Gaussian distribution will decrease the therapeutical effectiveness for the nucleus source, but its influence on the cytoplasm and cell surface sources is a little uncertain, as their real mean value is always higher than its set mean value by assuming the cell activity uptakes from zero. Careful usage of underdose with heterogeneous activity distribution should be practiced in clinics. The deteriorated heterogeneous distribution will salvage the potential subversive and lead to the failure of tumor local control. Some cells with no or little activity that are located on the edge or vertex of cube or corner models will have the ability to survive, as there is a lack of a part of the cross-fire dose effect, and so more attention should be paid in selecting the dosage. Although this work focuses on the clinic implication of 211At in α-radioimmunotherapy, these cell cluster models can be generalized to other radionuclides.
Introduction
The α-radioimmunotherapy (α-RIT) with a short range, high linear energy transfer and the cytotoxicity independent of dose rate and hypoxia appears to be especially suitable for eradicating minimal residual diseases.
1,2211At is promising for targeted α-particle therapy as its physical half-life (7.2 hours) is between those of 213Bi and 223Ra, and its pharmacokinetics is compatible with that of peptides such as octreotide.
3211At has two main channels of disintegration: the 5.867-MeV α-particle (∼42%) released instantaneously upon the decay of 211At, and the 7.450-MeV α-particle (∼58%) from the decay of the daughter 211Po. The alpha branching ratios of 211At and 211Po are 41.8% and 98.89%, respectively (
The cell cluster modeling is a widely used method to estimate the small-scale dosimetry and provide insight for clinics, and thus, it is a very useful tool to research the α-RIT dosimetry for α short range. Usually there are several types of cell cluster models existing in references, such as the spherical shell model, the simple cubic model, the body centered cubic model, and the close-packed cubic model. Uusijärvi et al. studied the influence of the heterogeneous radionuclide distribution on tumor control probability (TCP) for 90Y, 177Lu, 103mRh, and 211At based on the spherical shell model. 4 Malaroda et al. 5,6 and Kalogianni et al. 7 studied multicellular dosimetry and biologically effective dose (BED), equivalent uniform dose (EUD) application in heterogeneous radioactivity distributions based on a lattice cluster model. Goddu et al. used a close-packed cubic geometry to study the dependence of self-dose versus cross-dose on the type and energy of irradiation as well as the subcellular distribution of radionuclides. 8 Recently, Hindié et al. also used a close-packed cubic model composed of follicles to represent the histological structure of the thyroid. 9
The radiobiological modeling, as a valuable complement to the clinical experience, plays an important role in radionuclide evaluation and optimization. Some radiobiological quantities, such as TCP, BED, and cell survival fraction (SF), are often used in the radiobiological modeling. Uusijärvi et al. gave the cumulated cell activity threshold as TCP = 0.99 for activity uptake with log-normal and normal distribution. 4 O'Donoghue built the EUD expression in the radionuclide radiotherapy by using the Laplace transform of BED volume histogram (BVH). 10 Kalogianni et al. investigated the effects of the temporal and spatial behavior of the radioactivity using dose volume histograms (DVH), BED, and EUD concepts in heterogeneous radioactivity distributions. 7 Abou-Jaoudé and Dale evaluated the influence of radionuclide (211At, 90Y, 131I, 86Rb, and 114mIn) half-life on tumor response by maintaining a constant kidney toxicity and changing radiobiological modeling parameters. 11
The present work evaluated the effect of different regular cluster models on the radiobiological output for 211At-RIT. The cumulated cell activity thresholds for different cluster configurations, the cell dimensions, and the radiation sensitivity parameter were estimated with TCP = 0.90. The influences of different cell packing degrees and heterogeneous activity distributions on radiobiological response and prescription dose were analyzed.
Materials and Methods
Cluster models
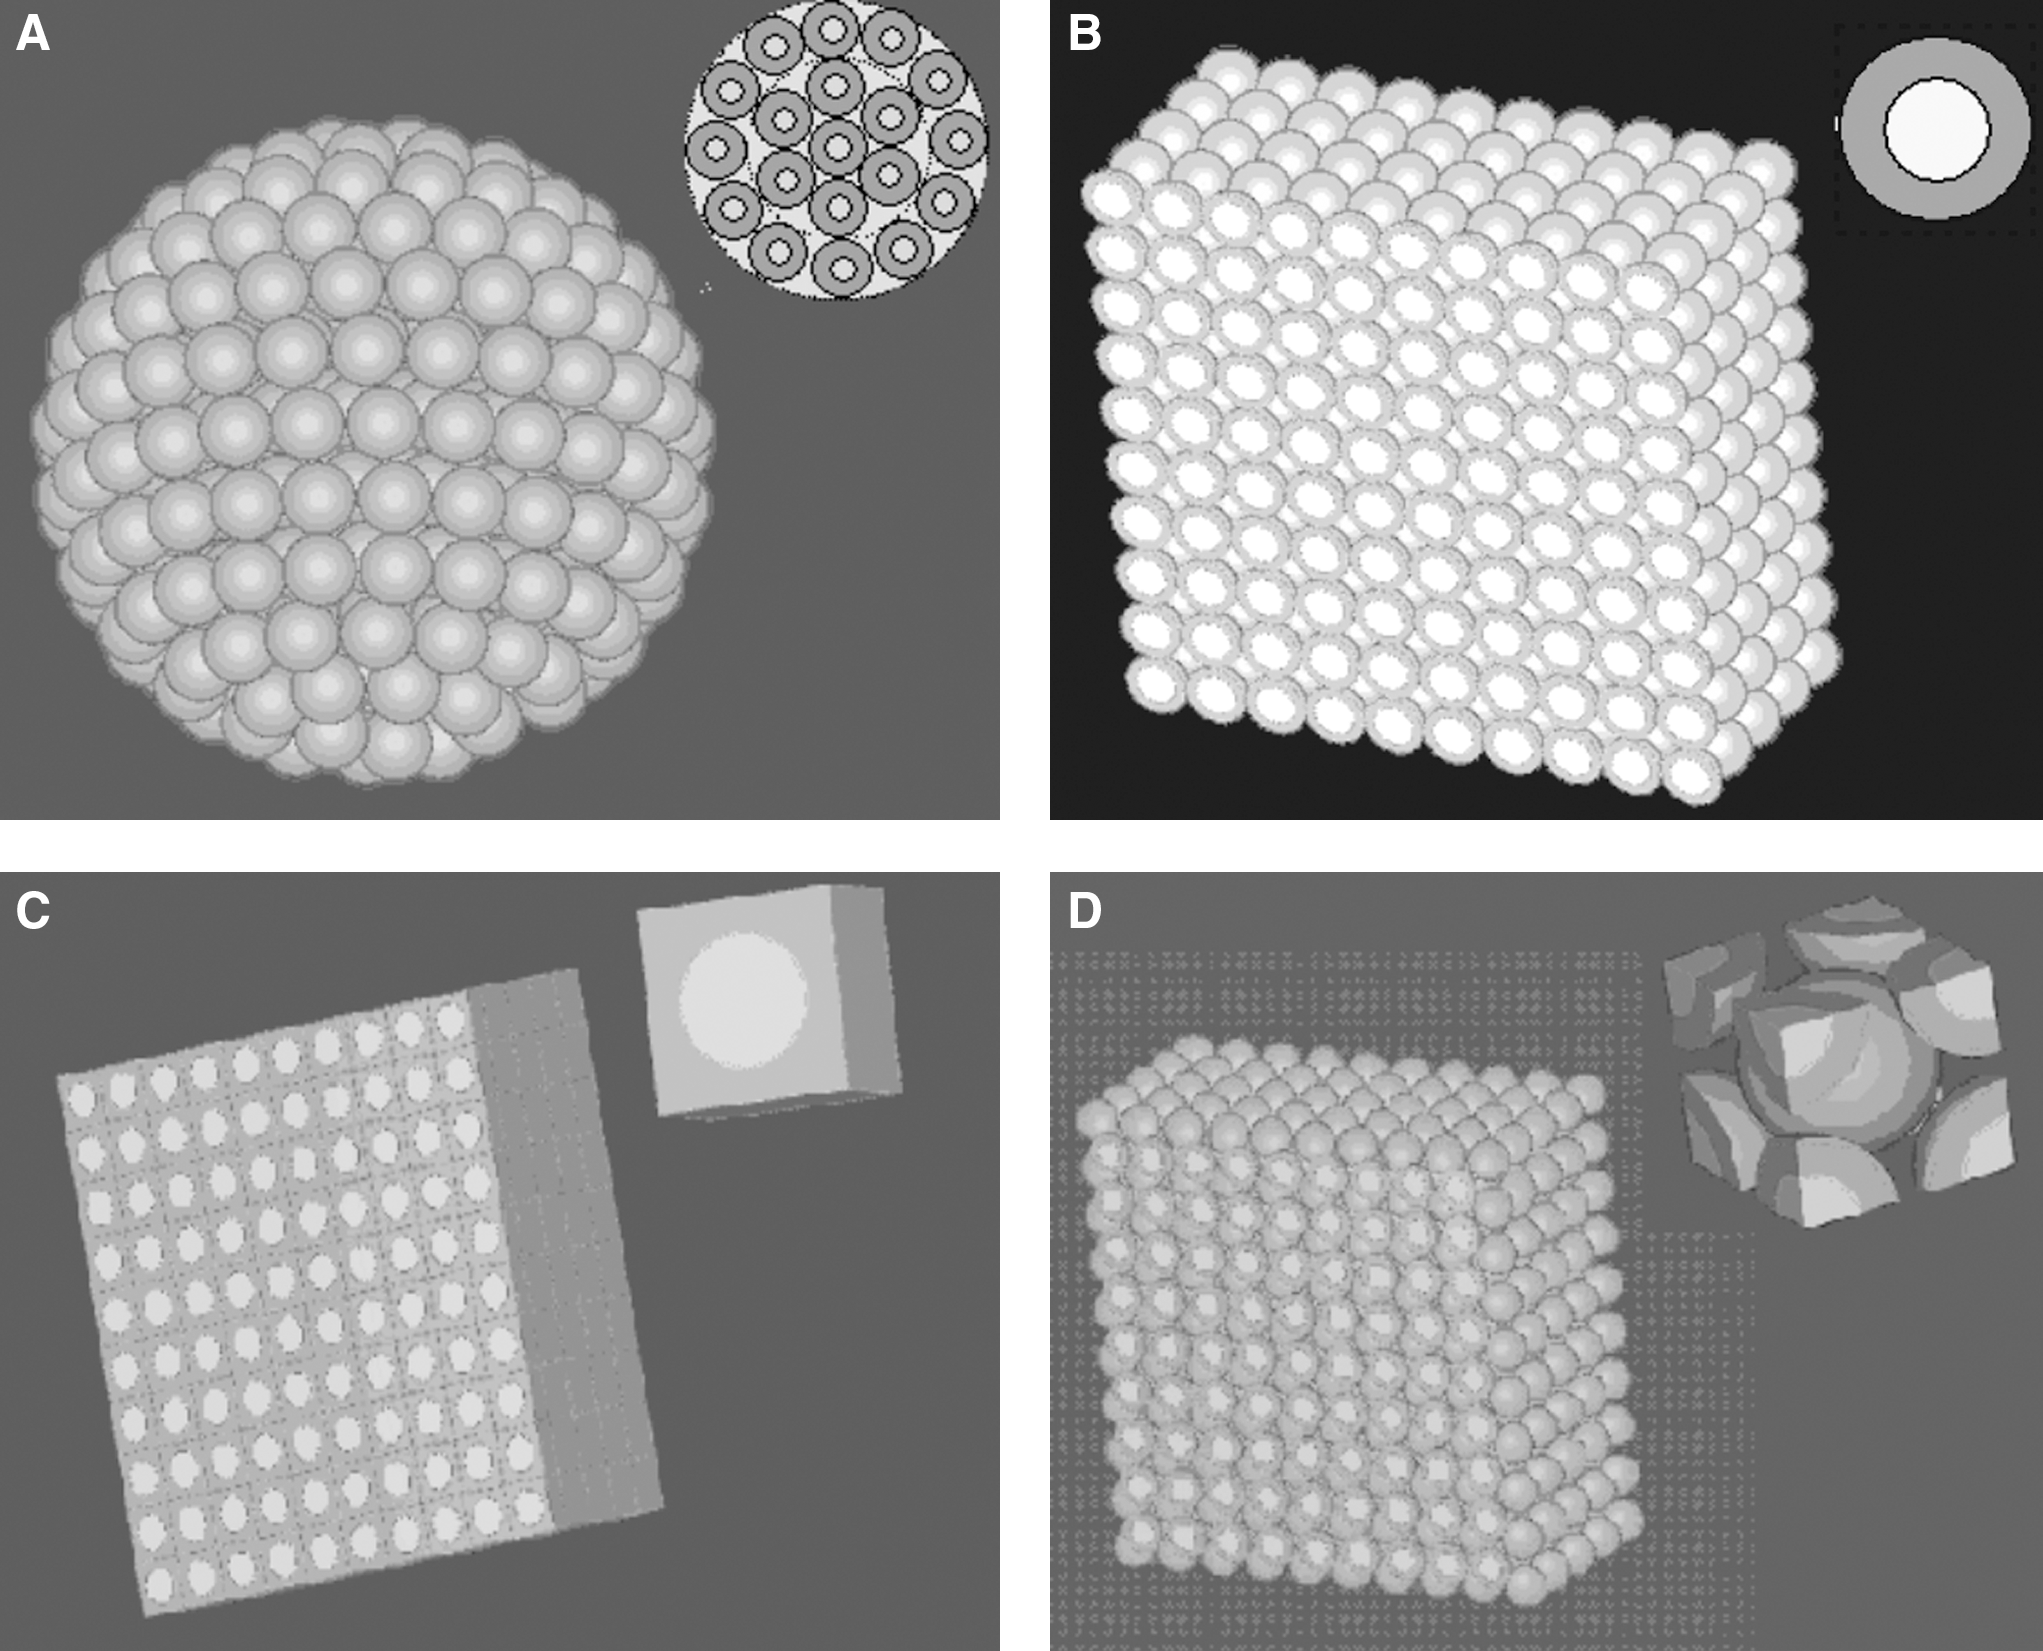
Model 1: Tumor is simulated as consisting of spherical shells containing spherical cells (Fig. 1A), whose cell packing degree is about 52.0%.
Model 2: Tumor is composed of spherical cells with simple cubic arrangement (Fig. 1B), whose cell packing degree is 52.4%.
Model 3: Tumor is simulated as a simple cubic arrangement consisting of lattice cells. The side length of voxels is the diameter of the spherical cell. The spherical nucleus is embedded at the center of the cubic lattice (Fig. 1C). The cell packing degree of this model is 100%.
Model 3 aims to evaluate the influence of extracellular activity by comparing with Model 2 under the same cell activity density. According to the law of conservation of energy, the energy distribution of the voxel source in Model 3 can be regarded as two components: the inscribed sphere source and the extra source outside the inscribed sphere. The former is just like the cell source in Model 2.
Model 4: It has a body-centered cubic arrangement containing spherical cells, in which each cell is in contact with eight other cells (Fig. 1D). Its cell packing degree is 68.0%.
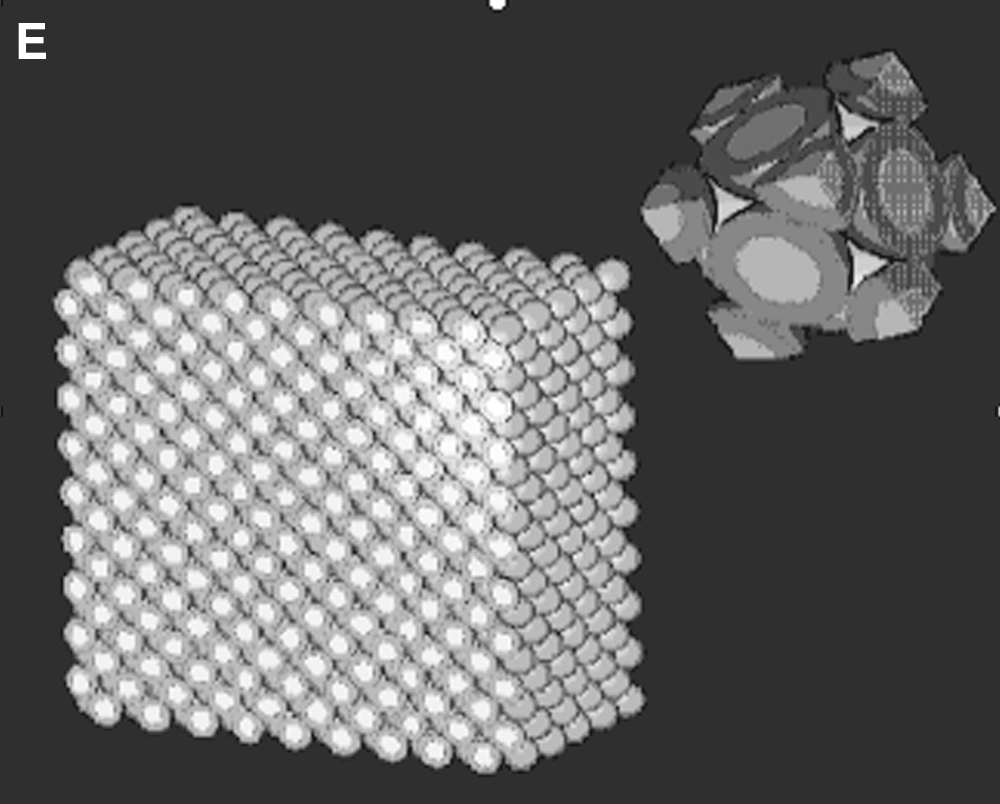
Model 5: It has a close-packed cubic geometry composed of spherical cells, in which each cell is in contact with 12 other cells, thereby forming a face-centered cubic lattice (Fig. 1E) with a cell packing degree of 74.0%.
Cluster models with the unit cell group:
The spherical cell model is made of two concentric spheres, which denote the nucleus and the cytoplasm. The radius of the basic cell is 6 μm and its nucleus radius is 4 μm. To study the influence of cell dimensions, the cell radius can be varied from 5 to 7 μm and the nucleus radius can be varied from 3 to 6 μm. The density of the cell and intracellular space is assumed to be 1 g cm3.
S factor
S factor (in Gy Bq−1 s−1) is the mean absorbed dose in the target. S factor can be classified into self-irradiation S factor and cross-fire S factor. The Geant4.9.2 low energy electromagnetic model coming from the Microbeam example 12 was used to calculate the S factors. Its low energy electron and photon process can be used down to 250 eV. The 211At emitter can locate homogeneously in the nucleus, in the cytoplasm, on the cell surface, or in the whole cell for Models 1, 2, 4, and 5 or in the whole voxel of Model 3.
The S factor of spherical cells was simulated based on a two-layer cell geometry, that is, the source cell located at the center and the target cells were arranged at the same radial distance. The center coordinates of all the cells were input into the Geant4 code by an *.CellCenter text file to construct the geometry model. The whole cell cluster was embedded in an infinite water medium. The distance between the source cell and target cells can be varied by 1 μm step size. As all the second-layer cells own the same dose for the centric symmetry, their averaged dose can be regarded as the cross-fire S factor for the varied source–target geometry.
The S factor of voxel cells was also based on this two-layer cell model. Although there is no centric symmetry for the voxel sources, the influence is in a limited scope only for 211At short range. The front 5 μm was replaced by the averaged value of six face-to-face target voxel cells, that is, the source voxel cell located at the center with six face-to-face target voxel cells. The distance between the source cell and the six target cells could be varied by 1 μm step size. So the cross-fire S factor was the averaged dose of these six target cells. About 2 × 10⁵ primary α particles per distance were simulated to obtain acceptable uncertainties.
Radiobiological quantities
The total absorbed dose to the ith cell nucleus is the sum of the self-absorbed dose (
According to the Medical Internal Radiation Dose methodology, the absorbed dose can be defined as
SF reflects the cell survival probability after irradiation. The linear-quadratic (LQ) model that includes the repair of sublethal damage occurring at a low dose is the common radiobiological model,
where G is the generalized Lea-Catcheside dose-protraction factor; α and β are the radiation sensitivity parameters; βG reflects the repair ability of the cell in response to this ionization radiation. For the densely ionizing radiation of alpha particles, the cell repair ability approximates to zero (i.e., β = 0).
13
The radiation sensitivity parameter α was set at 0.30 Gy−1 as reported by Abou-Jaoudé and Dale.
11
Generally, α is varied between 0.1 Gy−1 for extremely radioresistant tumor cells and 0.5 Gy−1 for extremely radiosensitive tumor cells.
14
TCP was calculated based on the nonnormalized differential DVH as follows
15
:
where Nj is the number of the jth bin with averaged absorbed doseDj , SF j is the SF corresponding toDj , and N is the total bin number of differential DVH.
An acceptable TCP value is difficult to specify, and complete tumor eradication depends on the immune capacity of the patient to eliminate the last few clonogens after the treatment. 11 This work assumed TCP = 0.90 as reported by Abou-Jaoudé and Dale, 11 which also was considered to highlight the effect of different cluster models (see Results section).
BED represents the dose delivered at the mathematical limit of low dose rate that would have the same biologic effect as the dose actually experienced. BED can quantify the biologic effect of different dose deposition patterns.
16
BED was calculated based on cell SF as follows:
Then, the BED i is binned into BVH as described by O'Donoghue. 10
A mathematical quantity that derives from BED definition is EUD, which incorporates the concept that two dose distributions are equivalent if they produce the same biological effect. EUD is a one-number value that allows for the quantification of nonuniform absorbed dose distributions.
17
The overall surviving fraction for the nonuniform distribution S(α) was calculated as follows:
where P(ψ
j
) is the normalized probability distribution of the BVH and M is the total bin number of BVH. Then, the EUD can be calculated as given in Reference 10:
Results
The cell activity threshold
To compare different cluster models, the equivalent dimension method was used, that is, the side length of cubic clusters was equal to the spherical cluster diameter. Considering α short range of 211At (∼70 μm), only small clusters whose side length is less than ∼1200 μm were investigated in the present study. Figure 2 shows the cumulated cell activity threshold (TCP = 0.90) for different models composed of cells with R C = 6 μm and R N = 4 μm. Generally, the activity threshold increases with increasing cluster dimension, which attributes to TCP's Poisson definition. The TCP will decrease to 37% even if one clonogen remains after irradiation. Because the radial distance of the electron disequilibrium region for 211At is fixed, the volume of electron disequilibrium region will increase with the increased cluster size. Thus, more peripheral cells will be inclined to underdose with the increased cluster size. Model 5 shows the least cumulated cell activity threshold. Models 1 and 4 show similar thresholds, although they own different cell packing degrees.

The cumulated cell activity threshold (in Bq.s/cell) with tumor control probability (TCP) = 0.90 for different models composed of cells with R
C = 6 μm and R
N = 4 μm. α = 0.30 Gy−1.
The cumulated cell activity threshold of Model 2 increases about 10% than that of Model 1 with central symmetry. This means that the tumor with spherical symmetry needs relatively less activity concentration than cubic tumors under the same cell packing degree. The activity threshold per cell averagely decreases 11% and 18% from Model 2 to Models 4 and 5, thus reflecting the influence of increased cell packing degree and cross-fire effect. The total activity thresholds of Models 4 and 5 in the whole clusters are about 18% and 17% higher than that of Model 2, as more cells are needed to be killed. This also means that the necessary activity concentration in a tumor does not have the right proportion with its cell packing degree. The tumor with middle cell packing (68%) needs a little more total activity than the tumors with cell packing degrees of 74% and 52.4%.
Comparing with the cell source of Model 2, the activity threshold of Model 3 increases only 7% along with ∼100% increase in cell volume (Fig. 2D), which reflects the influence of the extracellular activity. Generally, the prescription dose in clinics is given following the concentration instruction for the reference organ volume, and the radiopharmaceutical is highly selective to tumor cells. This result maybe means that the activity concentration in virtual tumor cells is almost double of the prescription dose, and thus, sometimes, the dose can be decreased a little by maintaining the same tumor-killing effect.
Figure 3 shows the cumulated cell activity threshold for different cell dimensions of Models 1 and 2. The equivalent dimension of clusters is ∼1212 × 1212 × 1212 μm3. The chosen cell size is R C = 5 μm, R N = 4 μm; R C = 6 μm, R N = 4 μm; R C = 7 μm, R N = 4 μm; R C = 6 μm, R N = 3 μm; and R C = 6 μm, R N = 5 μm. These cell dimensions aim to show the influence of different cytoplasm dimensions with the same nucleus and the influence of different nucleus dimensions with the same cell dimension.

The cumulated cell activity threshold (in Bq.s/cell) with TCP = 0.90 for different cell dimensions of Models 1 and 2. The cluster dimension is ∼1212 × 1212 × 1212 μm3. α = 0.30 Gy−1.
There are similar features between the cubic and spherical clusters. Generally, the smaller the nucleus, the lower will be the activity threshold for the nucleus source, which is consistent with 211At features of self-irradiated S factor. 18 And the self-irradiation is very critical to 211At for α short range. But, for the cytoplasm and cell surface sources, the activity threshold of R C = 6 μm and R N = 4 μm is a little lower than those of the others, which is due to the competitive result of self-irradiated and cross-fire S factors. The cell with R C = 6 μm and R N = 4 μm owns the middle self-irradiated and cross-fire S factors between those of R C = 6 μm and R N = 3 μm and those of R C = 6 μm and R N = 5 μm. As to the same nucleus dimension with different cell dimensions (R N = 4 μm and RC = 5, 6, 7 μm), the activity threshold increases with increasing cell dimension. Although they have similar self-irradiated S factor of the nucleus source, 18 its cross-fire S factor decreases with increasing cell dimension. The self-irradiated and cross-fire S factors of the cytoplasm and cell surface sources also decrease with increasing cell dimension, and the activity needs to be distributed in a large region. All these make their activity threshold to increase. The total activity thresholds in the cluster composed of cells with R C = 5 μm is about 10% for Model 1 and 5% for Model 2 higher than that of cells with R C = 6 μm, and the total activity thresholds for cells with R C = 7 μm is about 5% for Model 1 and 10% for Model 2 lower than that of cells with R C = 6 μm for cell number influence, especially when the nucleus source changes most remarkably. This shows that the organ or tissue composed of smaller cells needs a high prescription dose.
To study the influence of the radiation sensitivity parameter α, the cumulated cell activity thresholds of extremely radioresistant (0.1 Gy−1) and extremely radiosensitive (0.5 Gy−1) tumor cells for different cell dimensions of Model 2 were also calculated (Fig. 4). Generally, the threshold increases exponentially with α decreasing, and its influence on the large cell dimension (R C = 7 μm) is more than that on the small ones (R C = 5 and 6 μm), which means that the correct radiation sensitivity parameter deduced from biological experiment data is more critical for the organ or tissue composed of big cells. The influence of different subsources for radioresistant organ or tissue is also very critical, especially for cells with large cytoplasm. The cytoplasm and cell surface sources need more activities than that of the nucleus source for radioresistant tumors.
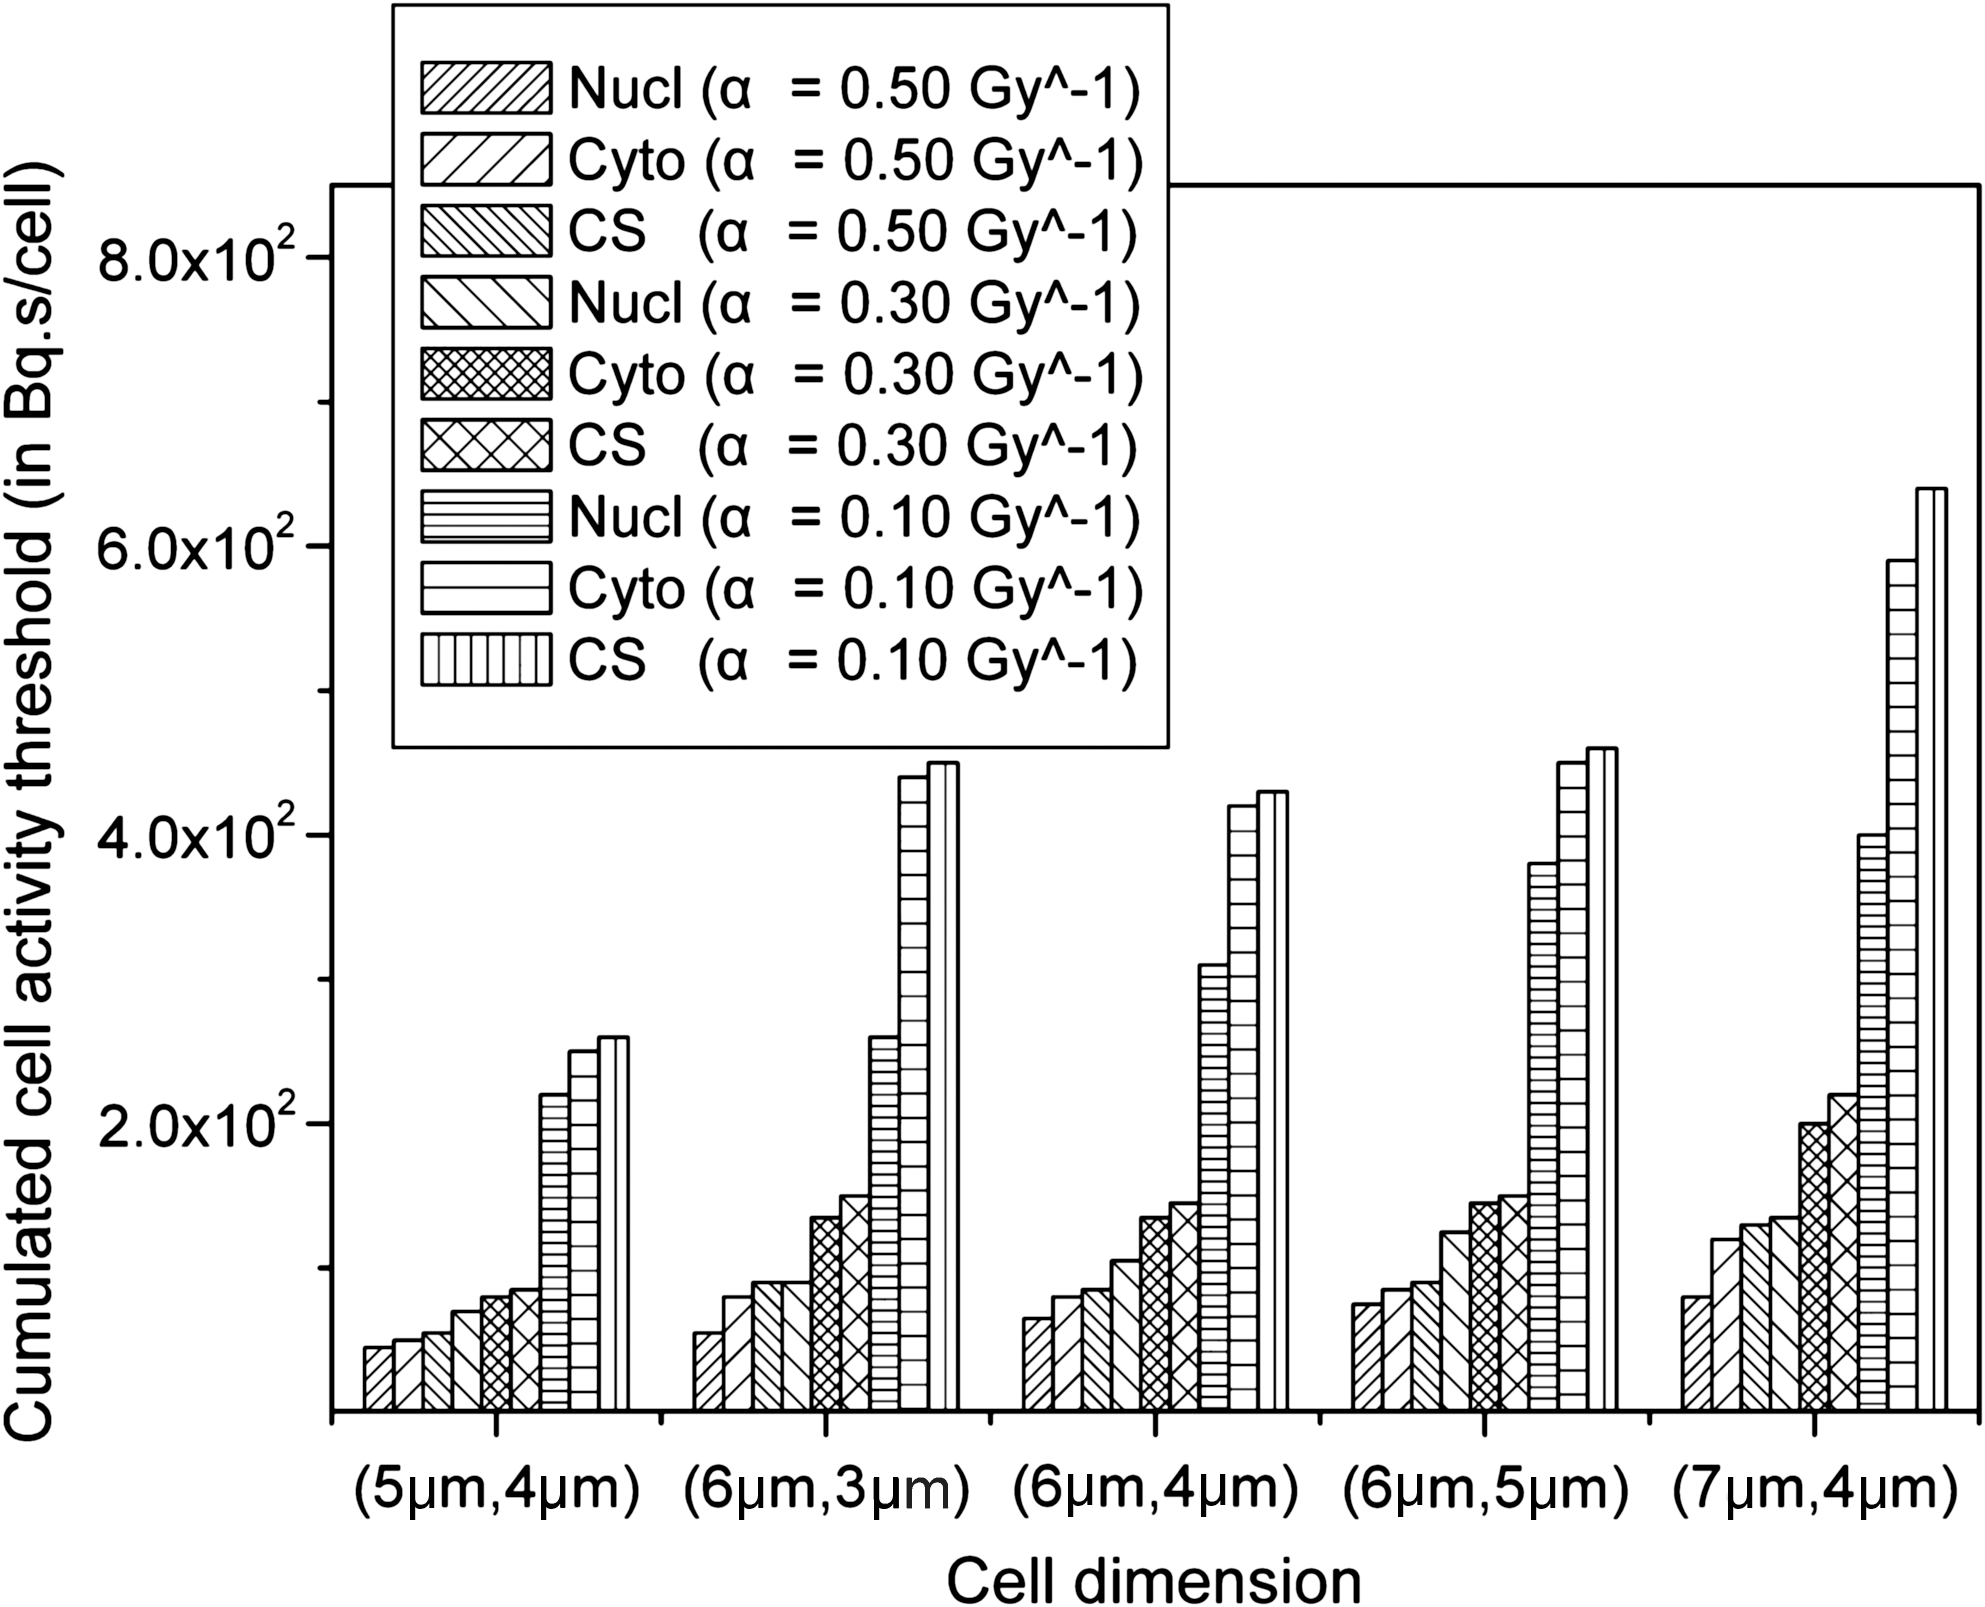
The influence of different α on the cumulated cell activity threshold (in Bq.s/cell) with TCP = 0.90 for different cell dimensions of Model 2. The cluster dimension is ∼1212 × 1212 × 1212 μm3. Nucl, nucleus source; Cyto, cytoplasm source; CS, cell surface source.
The influence of cell packing
The conventional prescription dose in clinics often gives the total activity in tumors considering the reference organ or tissue volume. But the cell packing degrees of these organs or tissues are different. To study the influence of cell packing degrees on the tumor control, the total activities of Models 2–5 are assumed to be a fixed value. First, the cumulated cell activity thresholds of Model 2 for subsources (Fig. 2) were selected, and the equivalent total activities in Models 3–5 were filled in cells with R C = 6 μm and R N = 4 μm (Table 1A). The cluster dimension is ∼1212 × 1212 × 1212 μm3. One can see that 〈D Total〉 and 〈BED〉 of all the models are completely equal for the front three valid figures. The cell repair ability approximates to zero for α particle with high linear energy transfer (i.e., β ≈ 0 in LQ model), and thus, actually, Di Total is equal to BED i by Equations (2) and (4). Compared with Model 2, the mean BED of Model 4 will decrease 1%–3%, but that of Model 5 will increase 5% except for the nucleus source (−3%). For TCP, the influence is very remarkable. The TCP will decrease from ∼90% for Model 2 to ∼70% for Models 4 and 5, in which the nucleus source decreases the most and the cell surface source decreases the least. The overall surviving fraction S(α) and the total cell number in clusters were used to deduce the survival cell number (N) after irradiation. The exponential relation of TCP and N is completely consistent to show the consistency of Equation (3) 15 with TCP's Poisson definition (i.e., TCP = exp(−N)).
The cluster dimension is ∼1212 × 1212 × 1212 μm3. The cell activities referenced the cumulated cell activity thresholds of Model 2. α = 0.30 Gy−1.
Nucl, nucleus; Cyto, cytoplasm; CS, cell surface; CCA, cumulated cell activity; BED, biologically effective dose; EUD, equivalent uniform dose; Wasted dose (%), (〈BED〉 − EUD)/〈BED〉; S(α), the overall surviving fraction for the nonuniform distribution; TCP, tumor control probability.
Table 1B shows the variance of radiological quantities for Models 2–5 with the same cell activity for subsources. The cell activities referenced the cumulated cell activity thresholds of Model 5 (Fig. 2). Compared with Model 5, the TCP of Model 4 will averagely decrease ∼8% and that of Model 2 will decrease ∼40%. However, if this cell activity is distributed in a large region with lattice configuration (Model 3), more than one clonogenic cell will survive to make TCP decrease to 0.215. All these results show that the cumulated cell activity threshold deduced from close-packed clusters will lead to the failure of the therapy of the spare cell clusters for underdose.
The cluster dimension is ∼1212 × 1212 × 1212 μm3. The cell activities referenced the cumulated cell activity thresholds of Model 5. α = 0.30 Gy−1.
Nucl, nucleus; Cyto, cytoplasm; CS, cell surface; CCA, cumulated cell activity; BED, biologically effective dose; EUD, equivalent uniform dose; Wasted dose (%), (〈BED〉 − EUD)/〈BED〉; S(α), the overall surviving fraction for the nonuniform distribution; TCP, tumor control probability.
The influence of heterogeneous activity distribution
Radiopharmaceuticals are generally distributed nonuniformly at organ, suborgan, multicellular, cellular, and subcellular levels. 19 Normal or Gaussian distribution is symmetrical around the mean value, and some cells will not contain any activity if the standard deviation is high. The cell activities were decided by this distribution to show the influence of different clusters and standard deviations (sigma = 0.3 and 0.6) on radiological quantities for Models 2–5 under the same mean cell activity (Table 1B).
Generally, the mean BED increases with increasing heterogeneous degree, which also means the increased mean dose in clusters. The EUD generally decreases from homogeneous distribution (i.e., sigma = 0; Table 1B) to the midheterogeneous distribution (sigma = 0.3; Table 2A) and then increases up to the heterogeneous distribution (sigma = 0.6; Table 2B) except for the nucleus source. TCP also shows the same feature. But EUD and TCP of the nucleus source decrease monotonously with increasing heterogeneous degree. All these are due to the competitive result of self-irradiated and cross-fire S factors, as well as the rigorous relation of survival cell number with TCP's Poisson definition.
The cluster dimension is ∼1212 × 1212 × 1212 μm3. The cell activities referenced the cumulated cell activity thresholds of Model 5. α = 0.30 Gy−1.
Nucl, nucleus; Cyto, cytoplasm; CS, cell surface; CCA, cumulated cell activity; BED, biologically effective dose; EUD, equivalent uniform dose; Wasted dose (%), (〈BED〉 − EUD)/〈BED〉; S(α), the overall surviving fraction for the nonuniform distribution; TCP, tumor control probability.
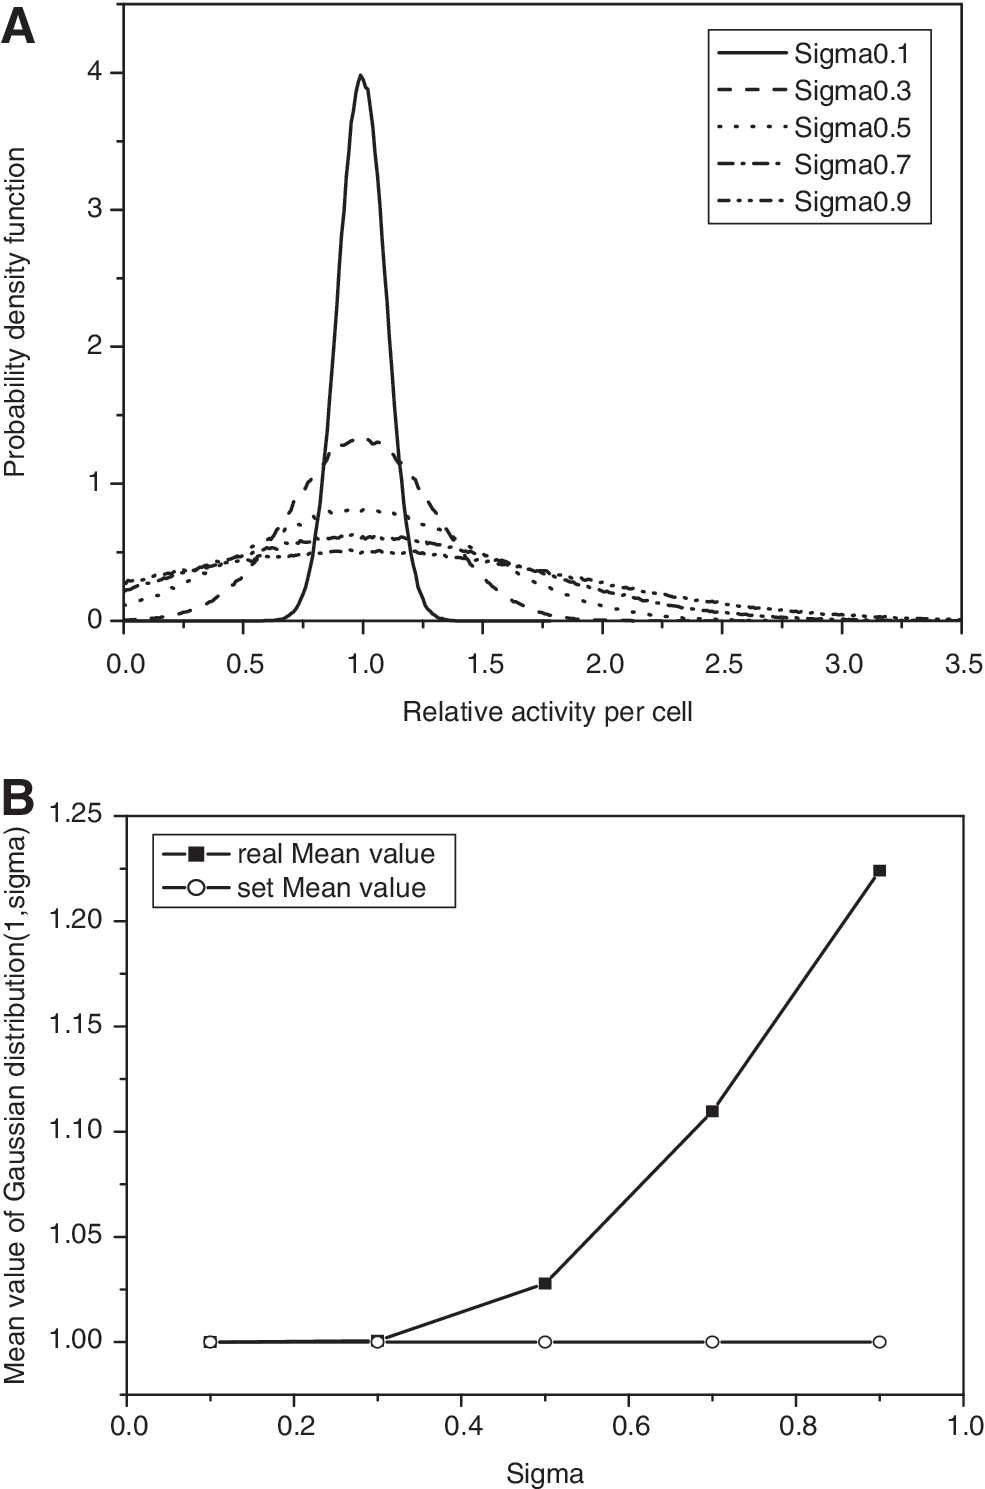
From mathematic viewpoint, the real mean value of Gaussian distribution 20 is always higher than its set mean value under the limitation of random data no less than 0 (i.e., minus activity is meaningless for cells in the cluster), and the deviation will be more serious with increasing standard deviation (Fig. 5). Although the number of cells without activity increases with deteriorating heterogeneous activity grade, the probability of cells with high activity also increases at the same time (Fig. 5A). Thus, the mean dose and the mean BED in the cluster increase with increasing sigma.
The nucleus source owns higher self-irradiated S factor, but its cross-fire S factor is lower than those of the cytoplasm and cell surface sources. Some cells with no or little activity that are located on the edge or vertex of cube or corner models will have the ability to survive, as there is a lack of a part of the cross-fire dose effect. As to the cytoplasm and cell surface sources, it is a little easy for them to remedy the activity-lacking cells by the neighbors' higher cross-fire S factor and the increased mean activity. Thus, their EUD and TCP reversely increase. However, all these also mean that the underdose cells located on the tumor edges or vertexes should be paid more attention in clinics, especially for the nucleus sources.
The influence of heterogeneous grade on the TCP of the nucleus source is also decided by the dose or activity grade. The influence is limited for sufficient or quasisufficient activity, such as Models 4 and 5, but is more remarkable for underdose (e.g., Model 2) with increasing heterogeneous grade. For example, the TCP of Model 2's nucleus source will decrease 31.0% and 41.6% from homogeneous distribution to sigma of 0.3 and 0.6. But those of Model 5's nucleus source are only 4.67% and 5.63%. Thus, careful usage of underdose with heterogeneous activity distribution should be practiced in clinics. The survival cell number of Model 2's nucleus source with 0.6 sigma is more than one shows the failure of tumor local control. The deteriorated heterogeneous distribution will salvage the potential subversive and make TCP lower than 0.37 (Table 2B).
The “wasted dose” percentage calculated by (〈BED〉 − EUD)/〈BED〉 7,10 increases monotonously with increasing heterogeneous degree (Tables 1B, 2A, and 2B). The nucleus source increases the most, and the cell surface and voxel sources increase the least. Even if the voxel source is in homogeneous distribution (Table 1A and B), wasted dose still exists. This wasted dose also increases with increasing cluster dimension. 7 So, as to this wasted dose definition, it seems that the relative increment more reflects the inhomogeneous influence than their absolute value.
Discussion
Cell cluster models are crucial for the radionuclide dosimetry at cellular level, so do the dose-derived radiobiological quantities. Some regular cell cluster models are often used for research work to provide insight for clinics. 4 –7 The present work evaluated the effect of different cluster models on the radiobiological output for 211At-RIT. Basically, regular models show similar features with cluster configuration and cell dimension variation, and their individual relative variation could reflect the influence of different activity situations. However, their individual results such as the cumulated activity threshold per cell and the prescription dose per volume should not be substituted reciprocally. The cumulated activity threshold per cell deduced from spare cell clusters will cause the overdose for the close-packed cluster and increase the risk of the surrounding organs. Conversely, the spare cluster filled with the cumulated cell activity threshold deduced from close-packed clusters would recrudesce for underdose. The prescription dose in clinics should also consider the specific tissue or organ, because tumors composed of smaller cells or midcell packing (68%) will need a little more high prescription dose per volume. The tumor with central symmetry will need a little lower prescription dose than the cornual models with the same cell packing degree.
The radiation sensitivity parameters in LQ model are critical to decide the radiobiological response with dose. Generally, α is varied between 0.1 Gy−1 for extremely radioresistant tumor cells and 0.5 Gy−1 for extremely radiosensitive tumor cells. 14 These radiation sensitivity parameters (α and β) are many for different tissue or organ cells, different cell conditions (in vitro or in vivo, aerobic or anoxic), as well as different irradiation types. The rigorous cluster model should be tissue or cell specific. The cumulated cell activity threshold increases exponentially with decreasing α, and its influence on the large cell dimension is more than on the small one. The different subsources affect radioresistant organs or tissues more remarkably than radiosensitive ones, especially for cells with large cytoplasm. The cytoplasm and cell surface sources also need much more activity than the nucleus source at a subcellular level.
Normal (i.e., Gaussian) or log-normal activity distribution was often used to describe the heterogeneous activity uptake. 4,21,22 The Gaussian distribution was chosen here for symmetry and simplicity. But the result is also similar to that of log-normal activity distribution. Generally, the activity uptake within the cluster is assumed to rise from an initial value of zero to a maximum value, as the radiopharmaceutical is taken up by the tissue, and then decrease exponentially owing to the decay of the radionuclide and the metabolic clearance of the radiopharmaceutical. 23,24 Thus, the least cell activity in clusters should be no less than 0. According to Gaussian or log-normal activity distribution under the limitation of random data no less than 0, their real mean value is always higher than its given mean value, and the deviation will be more serious with increasing standard deviation (Fig. 5B). Although more cells will not contain any activity now, these underactivity cells generally disseminate in the cluster. For the sake of cross-fire S factors of the cytoplasm and cell surface sources, the therapeutical loss could be remedied for the neighbors' higher dose and the therapeutical effectiveness increases reversely.
As to the nucleus source with relatively low cross-fire S factor, some cells with no or little activity that are located on the edge or vertex of cube or corner models will have the ability to survive, as there is a lack of a part of the cross-fire dose effect. According to TCP's Poisson definition, TCP will decrease to 37% even if one clonogen remains after irradiation. Thus, TCP and EUD decrease monotonously with increasing heterogeneous degree. All these also mean that the underdose cells located on tumor edges or vertexes should be paid more attention in clinics, especially for the nucleus sources.
Many works showed that the heterogeneous radionuclide uptake within the tumors can dramatically affect the efficacy of target radionuclide therapy. Malaroda et al. 6 and Kalogianni et al. 7 examined the heterogeneous radioactivity distributions at the multicellular level and suggested that a considerable loss of therapeutical effectiveness might occur as tumor dose homogeneity decreases. Their inhomogeneous activity model is based on the regular distribution of cells with zero activity. Uusijärvi et al. 4 studied the influence of activity normally or log-normally distributed on TCP and the cumulated activity required per cell. They found that the effectiveness of the influence of heterogeneous activity distribution on the 211At nucleus source is significant, but not for the cell membrane source. 4 Neti and Howell 21 used photoemulsion method and found the log-normal distribution of cellular uptake of radioactivity (210Po-citrate) within a cell population. They concluded that the radiopharmaceutical's ability to kill cells is smaller than that with a homogeneous uptake. Kvinnsland et al. 22 estimated the cell survival curves for phycoerythrin-conjugated antibodies labeled with an imaginary isotope emitting α-particles with 7-MeV energy. They found that the surviving fractions of cells were higher than the fractions found with assumptions about uniform uptake. The difference between the present work and the above references for the cytoplasm and cell surface sources is maybe due to the different heterogeneous degrees. Some models are seriously heterogeneous by filling regular activity-zero cells. 6,7 Some results are based on radiobiological experiments, 21,22 in which the multiple subcellular sources (nucleus source, cell source, etc.) are hybrid. However, modeling methods could give more radiobiological implications assuming different sorts of heterogeneity situations.
The sensitivity of TCP to dose heterogeneity also depends on the doses being considered. If the activity (i.e., dose) is sufficiently high, the influence of activity heterogeneity will be limited. However, at the other extreme, the minimum dose in a heterogeneous distribution will be low enough to guarantee local failure for even relatively uniform dose distributions. 25 Thus, careful usage of underdose with heterogeneous activity distribution should be practiced in clinics. The deteriorated heterogeneous distribution will salvage the potential subversive and lead to the failure of tumor local control.
Conclusions
The present work evaluated the influence of different regular cluster models on the radiobiological output for 211At-RIT. Basically, regular models show similar features with cluster configuration and cell dimension variation. However, their individual results such as the cumulated activity threshold per cell and the prescription dose per volume should be tissue or cell specific. The influences of radiation sensitivity parameters and heterogeneous activity distributions on radiobiological response and prescription dose were analyzed. The correct radiation sensitivity parameter deduced from biological experiment data is more critical for the organ or tissue with large dimension and composed of radioresistant cells. Some cells with no or little activity that are located on the edge or vertex of cube or corner models will have the ability to survive, as there is a lack of a part of the cross-fire dose effect, and so more attention should be paid in selecting the dosage.
Footnotes
Acknowledgments
This work was supported by a European Community project called the “Targeting Alpha-Particle Emitting Radionuclide to Cure Cancer,” the Chinese National Natural Science Foundation for Young Scholars (10805012), and Fundamental Research Funds for Chinese Central Universities (2010HGXJ0216). The authors appreciate Drs. Manuel Bardiès, Erin Mckay, Nicolas Chouin, and Jacques Barbet in INSERM 892 for their warm and highly useful discussions.
Disclosure Statement
No competing financial interests exist.