
Abstract
Overexpression of the heme oxygenase-1 (HO-1) gene in many solid tumors was believed to be one reason why cancer patients undergoing radiotherapy or chemotherapy failed to respond. The aim of this study was to evaluate whether Inhibitor of HO-1, zinc protoporphyrin IX (Znpp), enhances the radiosensitivity in human nonsmall cell lung cancer (NSCLC) A549 Cells. A549 cells were induced by Znpp and irradiated by X-rays. Then, expression of HO-1 was measured by real-time polymerase chain reaction. Cell survival was evaluated using the MTS assay and the clonogenic survival assay; apoptosis and cell cycle distribution were monitored by flow cytometry. First, overexpression of the HO-1 mRNA was found in treatment with irradiation alone in A549 cells, and expression of the HO-1 mRNA was reduced after combined treatments with 12 μmol/L of Znpp and irradiation. Second, diminished cell viability percentage, decreased cell clonogenic survival fraction, enhanced cell apoptotic index, and increased percentage of cells in the G1 phase were found after combined treatments with 12 μmol/L of Znpp and irradiation compared to either treatment alone (p<0.05). Inhibitor of HO-1, Znpp, can increase the radiosensitivity of human NSCLC A549 cells.
Introduction
Low radiosensitivity is a leading cause that nonsmall cell lung cancer (NSCLC) resists to X-rays. Anoxic cell in NSCLC plays an important role in radioresistance. Recently, the hotspot in radiation oncology focuses on how to enhance the radiosensitivity in NSCLC.
It is now well known that overexpression of the heme oxygenase-1 (HO-1) gene occurs in many solid tumors, 1 especially when tumor cells are in anaerobic condition or NSCLC patients have received radiotherapy or chemotherapy. Several tumors, including renal cell carcinoma 2 and prostate tumors 3 in humans, express a high level of HO-1. The mRNA and protein level of HO-1 in human pancreatic cancer patients was higher than that in normal pancreas. 4 Overexpression of the HO-1 gene is one reason why cancer patients undergoing radiotherapy or chemotherapy failed to respond and why tumor cells can survive in anaerobic condition. 4,5 Overexpression of HO-1 resulted in a significant reduction in cisplatin-induced cytotoxicity. 6 Expression of HO-1 may be a useful indicator of radiosensitivity for esophageal cancer patients. 7 HO-1 was thus considered to be a key biological molecule for anti-apoptotic and anti-oxidative in various tumors.
HO-1, a ubiquitous inducible stress-response protein, serves a major metabolic function in heme turnover. 8 HO-1 catalyzes the degradation of heme to carbon monoxide, iron, and biliverdin. 9 Induction of HO-1 occurs as a protective response in cells/tissues exposed to a wide variety of oxidant stimuli. 6 The expression of HO-1 occurs at low levels in most tissues under physiologic conditions. Overexpression of HO-1 was observed in human cells in response to a wider range of stimuli, including hemachrome, hyperxia, anoxia, heat shock, endotoxin, hydrogen peroxide (H2O2), ultraviolet (UV) radiation, cytokine, heavy metals, and NO. Function of HO-1 includes anti-apoptotic, anti-inflammatory, anti-oxidative, and anti-proliferative properties. 10 –12 Zinc protoporphyrin IX (Znpp) is an inhibitor of HO-1. 13,14 Znpp can enhance effect of antitumor agents, including cisplatin, camptothecin, doxorubicin, mitomycin C, etoposide, and radiotherapy. 15 Znpp was injected intra-arterially to the solid tumor suppressed the tumor growth to a great extent. 16
Lung is one of organs that are playing an essential role in HO-1 expression. Expression of HO-1 in lung cancer group is higher than that in normal group. 17 Up to now, very little is known concerning the relationship of HO-1 expression and radiotherapy in NSCLC A549 cells. In the study, first, we used Znpp to inhibit HO-1 expression in A549 cells and then exposed A549 cells to different doses of 6 MV X-rays. Second, we examined the tumor inhibitory effect in comparison with treatment with the same doses of irradiation (IR) alone.
Methods and Materials
Drug
Znpp was purchased from Shenzhen Meryer chemical company. Znpp was diluted with 0.1 mol/L NaOH solution. 18 The solution was modulated by phosphate-buffered saline (PBS) to 7.4 PH. 18 Eventually, concentration of this solution was 0.005 mol/L. The solution was stored at 4°C.
Irradiation
A549 cells were exposed to different doses of 6 MV X-rays with a 5×10 cm2 field size at 100 cm SSD at room temperature using a linear accelerator (ELEKTA). The dose rate was 2.0 Gy/minute, which was determined by Fricke's chemical dosimeter. Different doses of IR (2, 4, and 8 Gy) were used for the MTS assay, the colony-formation assay, apoptosis assay, and real-time polymerase chain reaction (PCR), whereas 8 Gy IR was used for Cell cycle analysis.
Treatments
A549 cells were divided into four groups: control (without Znpp or IR treatment); Znpp (treated with 12 μmol/L of Znpp for 24 hours); IR (treated with 2, 4, or 8 Gy of IR); and Znpp+IR (exposed with IR after treated with 12 μmol/L of Znpp for 24 hours). Znpp (12 μmol/L) were added for 24 hours. After drug exposure, A549 cells were exposed to different doses of 6 MV X-rays. The experiment was repeated three times.
Cell culture
NSCLC A549 cells kindly provided by the Shanghai Cancer Institute were cultured in RPMI 1640 medium (Biowest) supplemented with 10% fetal bovine serum and 1% penicillin–streptomycin. Cultures were maintained at 37°C in a humidified atmosphere containing 5% CO2. The pH of the cultures was 7.35 under these conditions.
Reverse transcription and real-time PCR assay
Each well of six-well plates was seeded with 4×10⁵ A549 cells and incubated overnight. Then, A549 cells grown in six-well plates were divided and treated as above. At 24 hours after radiation A549 cells were evaluated for HO-1 mRNA expression by real-time PCR. Total RNA was extracted from A549 cells using the Trizol reagent (Invitrogen). For reverse transcription of mRNAs PrimeScript® RT reagent Kit (TaKaRa) was used. Then, we used SYBR® PrimeScript RT-PCR Kit II (TaKaRa) as real-time PCR to amplify two genes, HO-1 and β-actin. The HO-1 gene was the target gene. The β-actin was internal control gene. The purpose of the internal control gene is to normalize the PCRs for the amount of RNA added to the reverse transcription reactions. 19 The HO-1 primers were used: sense, 5′-AGAGCCTGCAGCTTCTCAGA-3′; antisense, 5′-AGAAAGTCTGGCCATAGGAC-3′, which were designed according to the published sequence. 20 –22 The HO-1 DNA fragment size was 127 bp. The β-actin primers were used: sense; 5′-TCCTCCCTGGAGAAGAGCTA-3′; antisense, 5′-TCAGGAGGAGCAATGATCTTG-3′, which were designed according to the published sequence. 17 The β-actin DNA fragment size was 302 bp. The PCR for the amplification of HO-1 included denaturation at 95°C for 2 minutes, followed by 40 cycles of denaturation at 95°C for 5 seconds, annealing at 60°C for 30 seconds, and a final dissociation at 95°C for 15 seconds, 60°C for 30 seconds, and 95°C for 15 seconds. We could receive the threshold cycle (C T) from each sample and used the 2−ΔΔCT method 19 to analyze.
amount of target=2−ΔΔCT
A portion of the PCR product was viewed using ethidium bromide on an agarose gel and photographed under UV light.
MTS assay of cell viability
Each well of 96-well plates was seeded with 4000 A549 cells. Then, A549 cells grown in 96-well plates were divided and treated as above. At 24 hours after IR exposure MTS was added to each well at the indicated time at 37°C in the dark, and the absorbance of cells in each well was measured at 450 nm. The results were expressed as percentage of the absorbance present in treated cells compared to untreated cells. All experiments were performed in triplicate for each condition. The MTS kits were purchased from Beyotime (Institute of Biotechnology).
Colony formation assay
The colony formation assay was applied for measurement of clonogenic cell survival. Each well of six-well plates was seeded with 4×10⁵ A549 cells and incubated overnight. Then, A549 cells grown in six-well plates were divided and treated as above. After IR, the cells were immediately trypsinized and seeded in triplicate in 60 mm dishes (100 cells per dish) and incubated for 14 days to allow colonies to grow. The cells were fixed with methanol and stained with Giemsa. A colony was defined as a cluster of at least 50 cells that could be determined microscopically, and the number of colonies was counted manually using a microscope. The clonogenic survival fraction was calculated as (mean number of colonies)/(number of inoculated cells×plating efficiency). Plating efficiency was defined as the mean number of colonies divided by the number of inoculated cells for control cells.
Apoptosis assay
Each well of six-well plates was seeded with 4×10⁵ A549 cells and incubated overnight. Then, A549 cells grown in six-well plates were divided and treated as above. Both adherent and nonadherent cells in each group were harvested at 24 hours after IR. The experiments were performed with an Annexin V-FITC/PI Apoptosis Detection Kit (Major Biotech Co. Ltd.). The cell pellets were resuspended in 400 μL of binding buffer and stained with 5 μL Annexin V staining solution in the dark at 4°C for 15 minutes. And the cell pellets were stained with 10 μL propidium iodide (PI) staining solution in the dark at 4°C for 5 minutes. Flow cytometry acquisition was performed on FACScan (Becton Dickinson) using the CELL Quest program.
Cell cycle analysis
Each well of six-well plates was seeded with 4×10⁵ A549 cells and incubated overnight. Then, A549 cells grown in six-well plates were divided and treated as above. The cell-cycle phases were analyzed by measuring the DNA fragment staining with PI (Sigma) used as described by the manufacturer. A549 cells grown in six-well plates were divided and treated as above. The cells were harvested and centrifuged at 24 hours after IR. Cell pellets were washed twice with PBS. The cells were fixed and permeabilized overnight by adding 1 mL of fixative (70% ethanol) to each tube at 4°C. After centrifugation, the fixatives were decanted and the cell pellets suspended in 0.5 mL of staining solution containing 200 mL of DNAse-free RNAse (Sigma) and 200 mL of PI, and incubated for 30 minutes at room temperature in the dark. The cells were analyzed immediately by flow cytometry with FACScan using the CELL Quest program.
Statistical analysis
All data presented are the combined results of at least three independent experiments. Values represent mean±standard deviation of triplicate experiments. Student's t-test was used to test the differences between groups. Statistical significance was considered at p<0.05.
Results
Relative HO-1 mRNA expression in A549 cells
Znpp group showed the lowest HO-1 expression, which was 2.3-fold lower than that of control group. The expression of HO-1 was observed in 2, 4, and 8 Gy, which was 2.9-, 16.2-, 11.1-fold higher than that in Znpp+2 Gy, Znpp+4 Gy, and Znpp+8 Gy, respectively (Table 1, p<0.05). With the increasing doses of IR, the expression of HO-1 in IR group enhanced obviously (Fig. 1).
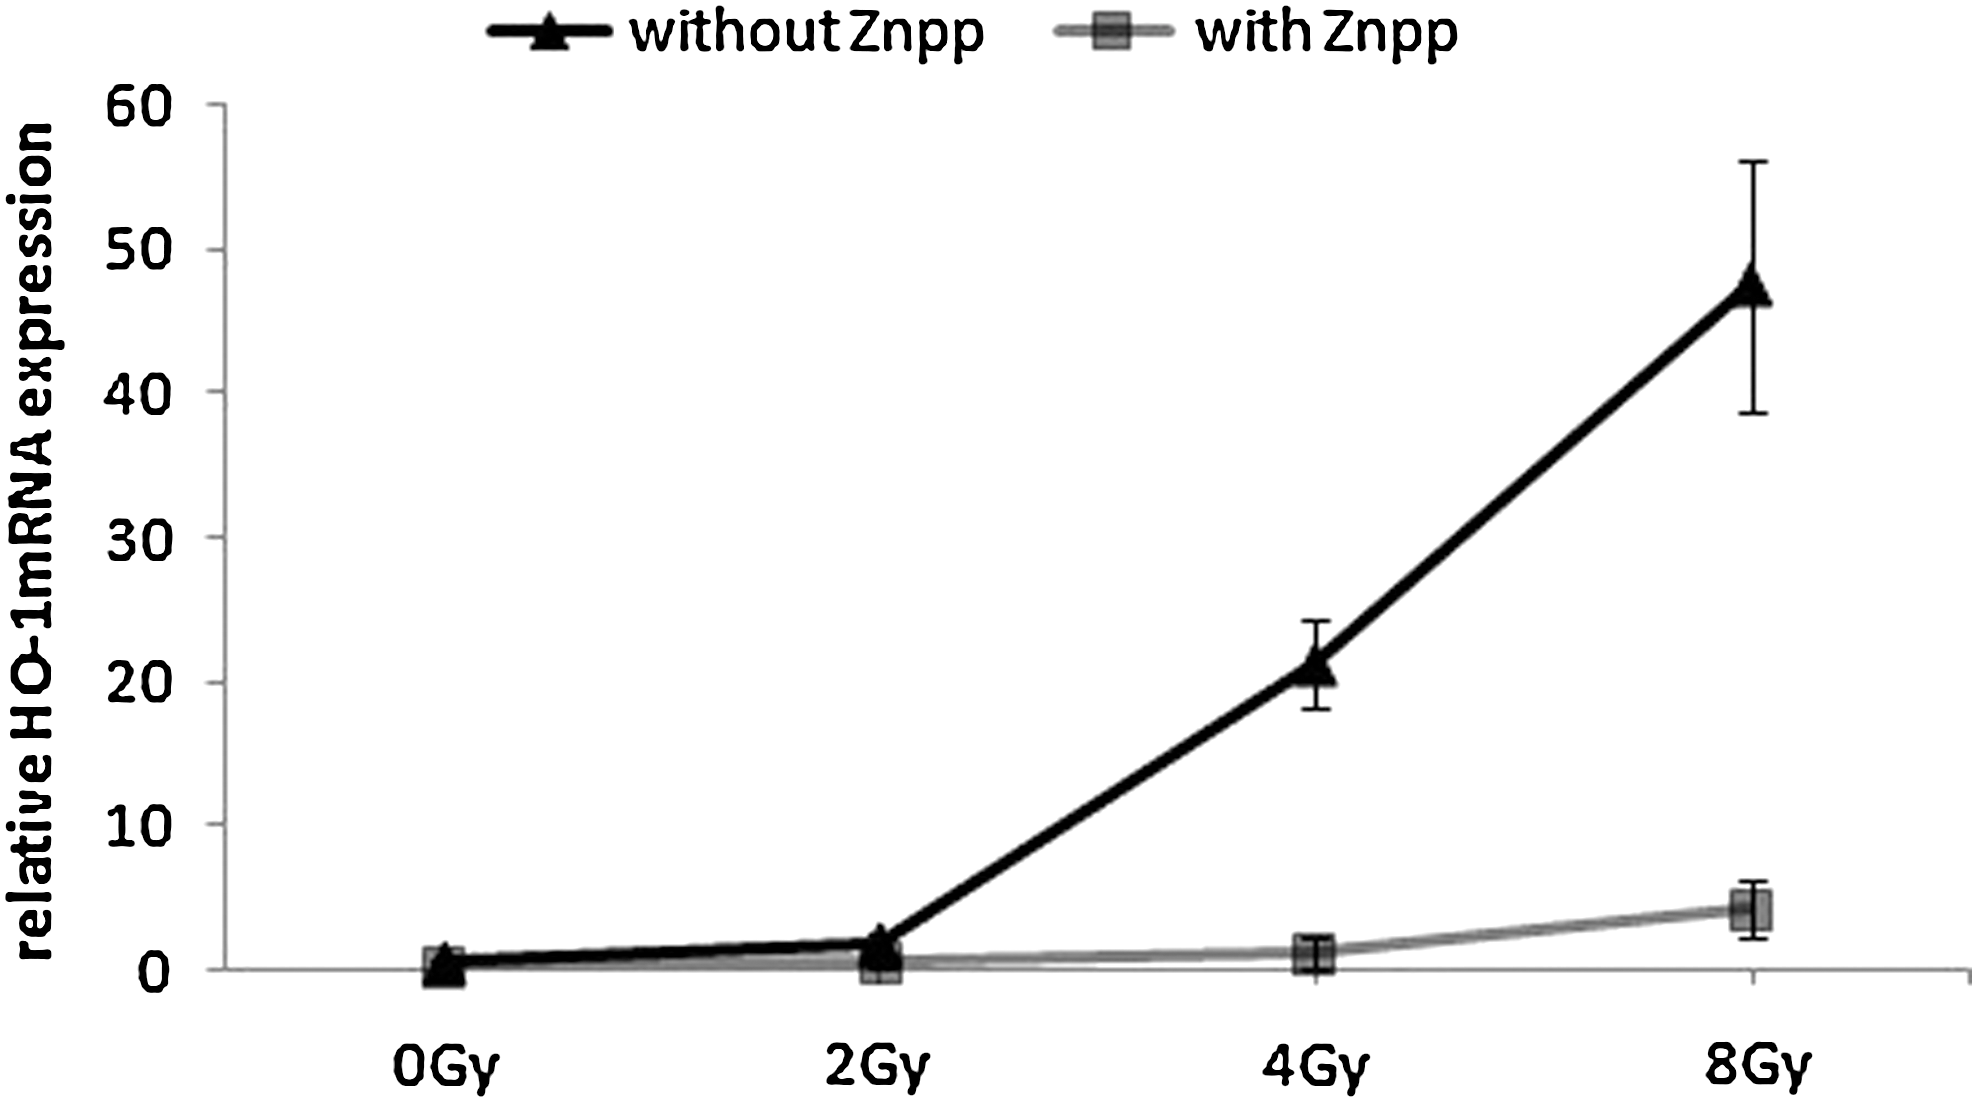
Relative HO-1 mRNA expression by real-time PCR assays. Data values for HO-1 expression were displayed in Table 1. HO-1, heme oxygenase-1; PCR, polymerase chain reaction; Znpp, zinc protoporphyrin IX.
Significantly different from same doses of irradiation at p<0.05.
Znpp, zinc protoporphyrin IX.
The size of the HO-1 fragment was about 127 bp (Fig. 2). The size of the β-actin fragment was about 302 bp (Fig. 3).

A portion of the PCR product of HO-1 was viewed using ethidium bromide on an agarose gel and photographed under UV light. The HO-1 DNA fragment, about 127 bp (considering the marker on the left), was viewed using ethidium bromide on an agarose gel. UV, ultraviolet.
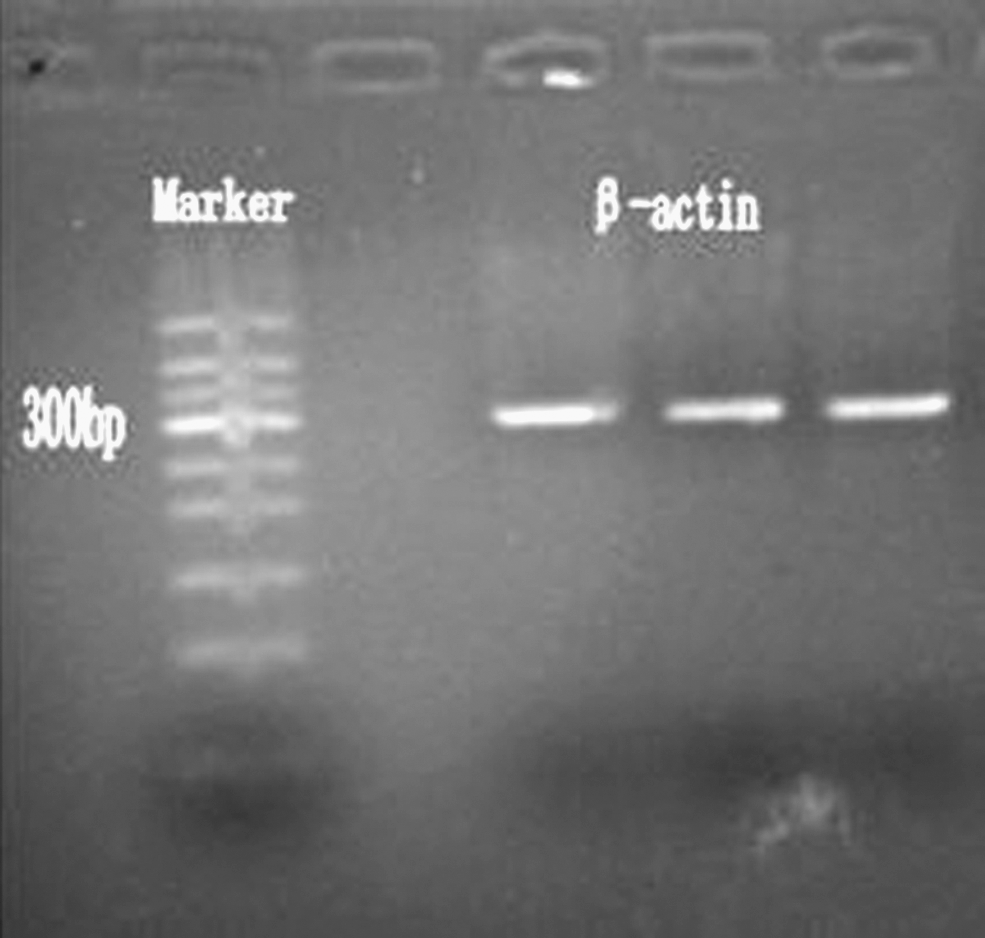
A portion of the PCR product of β-actin was viewed using ethidium bromide on an agarose gel and photographed under UV light. The β-actin DNA fragment, about 302 bp (considering the marker on the left), was viewed using ethidium bromide on an agarose gel. β-actin as the internal control gene.
Cell viability
In Table 2, compared for control group, cell viability percentage in Znpp group had statistical significant. As shown in Figure 4, despite treated or untreated with Znpp, the percentage of cell viability was reduced in both groups (IR group and Znpp+IR group) when A549 cells were treated with increasing doses of IR (2, 4, and 8 Gy). However, the inhibitory effect on cell viability in Znpp+IR group was more obvious compared with same doses of IR in IR group.

Cell viability percentage by MTS assays. Data values for cell viability percentage were displayed in Table 2.
Significantly different from same doses of irradiation at p<0.05.
Clonogenic-cell survival
In Table 3, compared for control group, the survival fraction in Znpp group had statistical significant. Cells treated with Znpp and IR showed a significantly lower cell survival than cells treated with same doses of IR alone (p<0.05, Table 3). Although the survival fraction in both group (IR group and Znpp+IR group) was decreased in Figure 5, the figures for Znpp+IR group indicated an increased radiosensitivity in A549 cells compared to those of IR group.

Cell survival fraction by colnoy formation assays. Data values for the number of colonies were displayed in Table 3.
Significantly different from same doses of irradiation at p<0.05.
Analysis of apoptosis
Cell apoptosis analysis indicated that the apoptosis rate of cells in Znpp+IR group significantly increased compared with the apoptosis rates of cells in same IR doses IR group (p<0.05, respectively;Table 4), whereas there were no differences in apoptosis rates between cells in control group and Znpp group (p>0.05; Table 4), which was 1.37%±0.81% and 1.36%±0.55%, respectively. With increasing doses of IR, the apoptosis rates of cells in Znpp+IR group increased obviously. On the contrary, with increasing doses of IR, the apoptosis rates of cells in IR group no longer enhanced and kept low (Fig. 6).

Apoptosis percentage by flow cytometry with Annexin V-FITC/PI Apoptosis Detection assays. Data values for the number of colonies were displayed in Table 4.
Significantly different from same doses of irradiation at p<0.05.
Cell cycle
There was an decease in cell population in the G2/M phase compared with the control group after treatment with Znpp or 8 Gy IR with Znpp (p<0.05) (Table 5). Meanwhile, from the results of cell cycle percentage, we saw that cells in Znpp group were blocked more conspicuously at the G1 stage of cell cycle.
Significantly different from control at p<0.05.
IR, irradiation.
Discussion
In the present study, we examined the relationship between HO-1 expression and IR and the anticancer effect of HO-1 inhibition by ZnPP in A549 cells. In this experiment, relative quantitative analysis of HO-1 mRNA indicated that HO-1 expression in A549 cells was strongly induced by IR and Znpp can inhibit expression of HO-1.
Targeted knockdown of HO-1 expression led to pronounced growth inhibition of the pancreatic cancer cells and made tumor cells significantly more sensitive to radiotherapy and chemotherapy. 4 Inhibition of HO-1 can be suggested as a potential therapeutic approach sensitizing tumors to radiation, chemotherapy, or photodynamic therapy. 23 Inhibition of HO-1 can rapidly reduce 50%inhibiting concentration of chemistry drug and the mRNA expression of HO-1in drug-resistant hepatic carcinoma Bel/Fu cell line. 24 Inhibition of HO-1 can influence expression of multicellular resistance (MCR-1). 24 Znpp can affect tumor growth of LL/2 mouse lung cancer cells and reduced HO-1 expression and HO activity and increased Apoptotic cell count in LL/2 cells. 25 Our results showed that compared with same doses of IR in IR group, cell viability percentage and clonogenic survival fraction after combined treatments in A549 cells decreased and apoptotic percentage increased. The photomicrographs showed that the shape of cells and nucleuses in Znpp+IR group was different from other three groups and the cells were dying (Fig. 7). We concluded from this study that inhibition of HO-1 could increase effect of radiotherapy in A549 cells.

All of images were obtained and observed under inverted microscope. The photomicrographs show A549 cells maintained under standard cell culture
In this report, we have demonstrated that Znpp could enhance the radiosensitivity in NSCLC A549 cells. HO-1 inhibits the expression of the proapoptotic protein, p53. 9,12 p53 expression is playing a key role in IR-induced apoptosis. 26,27 Cells for the loss of p53, an attenuated p53 response or p53 deletion, are resistant to IR. 28,29 p53 can mediate IR-induced G1 arrest. 30 –32 p53 protein levels in the cytoplasm were increased in ZnPP-treated cells and dose dependent on ZnPP concentration. 33 So, we came to a conclusion that Znpp inhibited HO-1 expression and then inhibition of HO-1 enhanced p53 protein level in A549 cells, which restricted abnormal cell into G2/M-phase and exhibited the G1 arrest. This can explain why Znpp altered the cell cycle with G2/M-phase reduction and G1 phase arrest in this experiment. The present study demonstrated that Znpp altered the cell cycle with G2/M-phase reduction and G1 phase arrest, which was also seen in combination with IR. However, we did not detect expression of p53 in this experiment. So, we need further study to explain this mechanism and discover other mechanisms in which inhibition of HO-1 enhances the radiosensitivity in NSCLC A549 cells.
Conclusions
To sum up, in A549 cells, IR induced overexpression of HO-1 in A549 cells. By using inhibition of HO-1, expression of HO-1 was reduced and the radiosensitivity was enhanced in A549 cells. As a result, inhibition of HO-1 enhances the radiosensitivity in NSCLC A549 cells.
Footnotes
Acknowledgments
We have been able to finalize this work thanks to the technical assistance and equipment supply from Shanghai Public Health Clinical Center. Financial support was received from the Science and Technology Council of the Jinshan District, Shanghai.
Disclosure Statement
None declared.