
Abstract
Vascular endothelial growth factor receptor type 2 (VEGFR2)–targeted tumor treatment is an antiangiogenic therapeutic strategy. The human sodium iodide symporter (hNIS) gene is a useful reporter gene for tumor imaging and radiotherapy. In this study, we investigated the evaluation of therapeutic efficacy in hNIS gene–transfected tumor xenografts using a gamma imaging system after treatment with an anti-VEGFR2 antibody. Human breast cancer MDA-MB-231 cells transfected with the hNIS gene were injected subcutaneously into the right flanks of BALB/c nude mice. Therapy was initiated when the tumor volume reached approximately 130–180 mm3. The animals were intravenously injected with 50, 100, or 150 μg of antibody every 3 days for 16 days. Gamma imaging was performed 1 and 2 weeks after the first injection to monitor the effects of tumor therapy. Mice were sacrificed 2 weeks after the first injection of antibody and the tumors were removed for CD31 staining and reverse transcription–polymerase chain reaction (RT-PCR) assay. All groups of mice that were treated with anti-hVEGFR2 antibody showed markedly reduced tumor growth compared to control mice. In vivo gamma imaging results showed that, at 1 week after the first injection of the anti-hVEGFR2 antibody, 125I uptake of a tumor treated with 150 μg of antibody was 24.5% lower than that in the controls. At 2 weeks, 125I uptake in the tumor treated with 150 μg of antibody was as low as 44.3% of that in the controls. CD31 staining and RT-PCR assays showed that blood vessel formation and expression of the hNIS gene were reduced with increased treatment doses. This study demonstrated the feasibility of molecular imaging and the therapeutic efficacy of developing therapeutic antibody anti-hVEGFR2 using a gamma imaging system in hNIS gene–transfected tumor xenograft mice.
Introduction
Antiangiogenic therapy is designed to reduce the blood supply to a tumor, an effect that can inhibit or even destroy the tumor. One such therapeutic strategy is to suppress activity of the major angiogenic regulator vascular endothelial growth factor and its receptors (VEGF/VEGFR). Inhibition of VEGF and VEGFR stops the formation of new blood vessels in tumors and induces the regression of existing tumor vessels as well, leading to the collapse and necrotic degeneration of tumors. 1 –6
Anti-hVEGFR2 antibody is a fully human IgG1 monoclonal antibody that recognizes VEGFR2. The binding of anti-hVEGFR2 antibody to VEGFR2 inhibits the ligand-induced activation of the receptor. Previous studies have reported the antitumor effects of various anti-VEGFR2 antibodies. 7 –9
Noninvasive monitoring of tumors is an important step after treatment or during treatment for the evaluation of therapeutic efficacy. Molecular imaging is a noninvasive imaging technique that has been used extensively to characterize tumor growth, regression, and metastasis, both clinically and in the laboratory. 10 –12 In particular, molecular imaging based on reporter gene expression appears to be well suited for tumor imaging in living organisms and enables the visualization, characterization, and quantification of biologic processes in animals and humans. 13 –16 It is also valuable for the preclinical tumor research and evaluation of new antitumor drugs. 17,18
The sodium-iodide symporter (hNIS) gene encodes a membrane ion channel, NIS, which actively transports iodide across the cell membrane into thyroid epithelial cells. The ability of the thyroid to accumulate iodide via NIS has provided the basis for diagnostic scintigraphic imaging of the thyroid with radioiodines. 19 Several researchers have investigated the use of hNIS gene transfection in radioiodine imaging of nonthyroidal and thyroid cancers. 20,21
In a previous study of our group, we demonstrated that gamma imaging systems could be used to measure the therapeutic efficacy of an antitumor therapy in hNIS gene expressed tumor-xenografted models. 22 hNIS gene–transfected tumor cell-bearing mice were treated with DC101 antibody, and the therapeutic efficacy of DC101 was quantified according to injected dose. Based on these results, molecular imaging systems can be used as measuring tools when preclinical evaluation of developed antitumor agent was required. Further, screening of appropriate injection dose and route of target agent will be render possible for effective treatment.
In this study, we used a gamma imaging system to evaluate the therapeutic efficacy of a developed anti-hVEGFR2 antibody in a breast cancer xenograft mouse model transfected with the human NIS (hNIS) gene.
Materials and Methods
Materials
The anti-hVEGFR2 antibody was obtained from Korea Research Institute of Bioscience and Biotechnology (Daejeon, Korea). Unless indicated otherwise, all laboratory chemicals were of molecular biology grade and were purchased from Sigma-Aldrich (St. Louis, MO), Gibco (Grand Island, NY), or Invitrogen (Carlsbad, CA). Na125I was obtained from Perkin Elmer Life Sciences, Inc. (Boston).
Construction of human IgG anti-VEGFR2 antibody
The anti-VEGFR2 antibody was generated from an in-house fully human naïve single-chain variable fragments (scFvs) library; it is a fully human IgG1 subtype. The scFvs were cloned into full-length antibody expression vectors, transfected into CHO-DG44 cells, and selected. The anti-VEGFR2 antibody was purified using the sequential application of culture supernatants to rProtein-A affinity (GE Healthcare, Buckinghamshire, England), Capto-S (GE Healthcare), and Capto-Q (GE Healthcare) chromatography.
Tumor cell culture and NIS gene transfection
MDA-MB-231 breast cancer cells were cultured in Dulbecco's modified Eagle's medium (DMEM; Gibco) containing 100 IU/mL penicillin, 100 μg/mL streptomycin, and 10% (v/v) fetal bovine serum. After pcDNA3-hNIS was transfected into MDA-MB-231 cells using the Lipofectamine 2000 (Invitrogen) transfection reagent according to the manufacturer's instructions, MDA-MB-231-hNIS cells were generated as described. 22
Generation of tumor xenograft models
All animal experiments were performed in compliance with the policies and procedures of the Institutional Animal Care and Use Committee. Female BALB/c nude mice (4 weeks old, nu/nu) were obtained from Orient-Bio (Seoul, Korea). MDA-MB-231-hNIS cells were harvested using 1% trypsin-EDTA and washed twice with serum-free DMEM. Mice were anesthetized and 106 cells mixed with 50 μL Matrigel (BD Biosciences, Franklin Lakes, NJ) were injected subcutaneously into the right flank of each mouse.
Anti-hVEGFR2 antibody treatment
Tumor size was measured using Vernier calipers and was calculated using the following formula: width2×length×0.5. When the tumor volume reached approximately 130–180 mm3, therapy was initiated and the mice were divided into four groups, three anti-hVEGFR2 antibody treatment groups at different doses and one control group. To identify the optimum dose for therapy via intravenous administration, anti-hVEGFR2 antibody was administered intravenously through the tail vein at concentrations of 50 μg/dose (n=5), 100 μg/dose (n=5), or 150 μg/dose (n=5) three times a week for 2 weeks. Equal volumes of saline were injected into the control group. During treatment, we measured body weights to examine possible toxicity.
microSPECT/CT imaging and quantitative analysis
The mice were subjected to microSPECT/CT image studies at 1 week and 2 weeks after the first injection of anti-hVEGFR2 antibody or saline. Gamma camera imaging of 125I and image processing were performed using a small-animal imaging system with pinhole collimation (aperture diameter=1 mm, focal length=9 cm) and a 15- to 45-keV photopeak energy window (X-SPECT/CT system; GE Healthcare). Total counts of 0.1 mL Na125I (3.7 MBq) were determined by region-of-interest (ROI) analysis of the reconstructed SPECT images, counting also the radioactivity of the syringe, before and after injection. The mice were anesthetized under isoflurane and Na125I was injected via the tail vein with an insulin syringe. Residue counts were determined by ROI analysis of the reconstructed SPECT images of the syringe postinjection. The percent of the injected Na125I dose (% ID) in each tumor was calculated by ROI counting according to the following equation:
% ID of 125I uptake in tumors=(Counts of tumor)/(Counts in syringe prior to injection)−(Residual counts in syringe postinjection)×100
where the counts in tumor were determined by ROI analysis of the reconstructed SPECT images of the tumor-bearing animal.
One hour postinjection, SPECT imaging of each tumor-bearing animal was performed, acquiring 32 60-second projection images over 360° and using a radius of rotation of 7 cm. Reconstructed data from SPECT and CT were visualized and coregistered using imaging-registration software for micro SPECT/CT (AMIRA 3.1; Visage Imaging, Inc., San Diego, CA).
Reverse transcription–polymerase chain reaction analysis of hNIS expression
Reverse transcription–polymerase chain reaction (RT-PCR) was performed to confirm the expression levels of hNIS for each antibody treated and control group. Tumors were removed from all mice 2 weeks after the first injection of anti-hVEGFR2 antibody. Total RNA was extracted using TRIzol reagent (Invitrogen) according to the manufacturer's instructions and quantified. Complementary DNA (cDNA) was synthesized using 3 μg RNA, 50 U/μL reverse transcriptase (Superscript; Invitrogen), and 0.5 g/L oligodeoxythymidine in a total volume of 20 μL. The reactions were performed at 42°C for 50 minutes and were terminated by heating at 70°C for 20 minutes. The cDNA samples were used as templates for PCR with the following primers:
hNIS-S5′-TCTCTCAGTCAACGCCTCT-3′, hNIS-A5-′ATCCAGGATGGCCACTTCTT-3′,
β-actin-S5′-TGACGGGGTCACCCACACTGTGCCCATCTA-3′,
β-actin-A5′CTAGAAGCATTTGCGGTGGACGATGGAGGG-3′.
PCR was performed in a total volume of 20 μL of PCR buffer containing 2 μL cDNA, 2.5 mM dNTPs, 1 μM of each primer, and 2.5 U Taq DNA polymerase. The conditions used for PCR amplification were as follows: at 94°C for 3 minutes, followed by 35 cycles of 94°C for 30 seconds, 52°C for 30 seconds, and 72°C for 45 seconds, and a final extension step of 72°C for 7 minutes. β-actin was coamplified as an internal control. After 35 cycles of amplification, the PCR products were separated by electrophoresis on a 1% agarose gel and were visualized by staining with ethidium bromide. Band densities were measured using a luminescent image analyzer (LAS-3000; Fujifilm, Tokyo, Japan).
CD31 immunohistochemistry
To confirm the in vivo antitumor effect, we performed immunohistochemistry with an antibody against CD31 to visualize tumor blood vessels. Tumors were removed 2 weeks after the first injection of anti-hVEGFR2 antibody or saline and were immediately fixed in 10% buffered formalin. Samples were embedded in paraffin and sectioned, deparaffinized in xylene, and rehydrated in graded alcohol. Antigen retrieval was performed using citric acid. Sections were incubated with a primary antibody against CD31 at 4°C overnight. The samples were then rinsed twice with phosphate-buffered saline with Tween 20 (PBST) and incubated for 60 minutes at room temperature with the appropriate dilution of the secondary antibody. The slides were rinsed with PBST and incubated for 10 minutes with diaminobenzidine, counterstained with hematoxylin, and mounted. The immunostained tissue was viewed using light microscopy (Zeiss Axiovision Plus, Oberkochen, Germany).
Statistical analysis
Data are expressed as mean±SD. One-way ANOVA (SPSS 12.0; SPSS Inc., Chicago, IL) was used to determine statistical significance at the 95% confidence level, and p-values less than 0.05 were considered statistically significant.
Results
Inhibition of tumor growth by anti-hVEGFR2 antibody treatment
An outline of the study design is shown in Figure 1. We measured tumor volume after implantation to monitor the antitumor effect of anti-hVEGFR2 antibody. Previous studies reported that administration of doses lower than 100 μg showed no therapeutic efficacy for mouse treated with anti-VEGFR2 DC101 antibody. 22 Therefore, we administered anti-hVEGFR2 antibody at doses of 50, 100, or 150 μg and compared the difference of gamma images. Antibody treatment was started on day 17 after tumor implantation and was continued for 2 weeks. As shown in Figure 2A, treatment with anti-hVEGFR2 antibody at doses of 50, 100, and 150 μg showed inhibitory effects on tumor growth compared to control. Figure 2B demonstrates that there were no signs of toxicity, expressed as weight loss in response to anti-hVEGFR2 antibody administration. Therefore, treatment with anti-hVEGFR2 antibody showed antitumor effects and appeared to be nontoxic.

Outline of the study. Mice were randomly assigned to four groups and treated for 2 weeks according to the schedule shown. Gamma camera imaging analyses were performed 1 and 2 weeks after the first injection of anti-hVEGFR2 antibody. RT-PCR, reverse transcription-polymerase chain reaction; VEGFR, vascular endothelial growth factor receptor.

Effects of treatment with anti-hVEGFR2 antibody on tumor growth.
microSPECT/CT fusion imaging of tumor models
microSPECT/CT fusion imaging studies were performed in all groups at 1 and 2 weeks after the first treatment for noninvasive quantitative analysis of viable tumor during anti-hVEGFR2 antibody treatment. A Significant Correlation (r2=0.977) was demonstrated between tumor volumes and counts of ROI. 22 Figure 3A and C show representative mice images of all groups, 1 and 2 weeks after the first treatment. The gamma images show 125I uptake in the thyroid and stomach, both of which express NIS, and in the bladder, where iodide was being cleared in the urine. There was also a clear image of a tumor that had been transfected with the hNIS gene. One week after the first treatment, % ID analysis of 125I uptake in the tumors of all groups was performed based on gamma images (Fig. 3B). One hour after tracer administration, the 125I uptakes in the tumors of mice treated with 50, 100, or 150 μg anti-hVEGFR2 antibody were 19.6%±4.0% ID, 17.5%±2.2% ID, and 16.0%±2.4% ID, respectively. In contrast, 125I uptake in the saline-treated tumor (control group) was 21.2%±4.3% ID. Two weeks after the first treatment, 125I uptakes in the tumors treated with anti-hVEGFR2 antibody at 50, 100, or 150 μg were 27.0%±5.0% ID, 22.0%±3.1% ID, and 19.5%±2.5% ID, respectively, compared with 35.0%±5.0% ID in the saline-treated tumor (Fig. 3D).
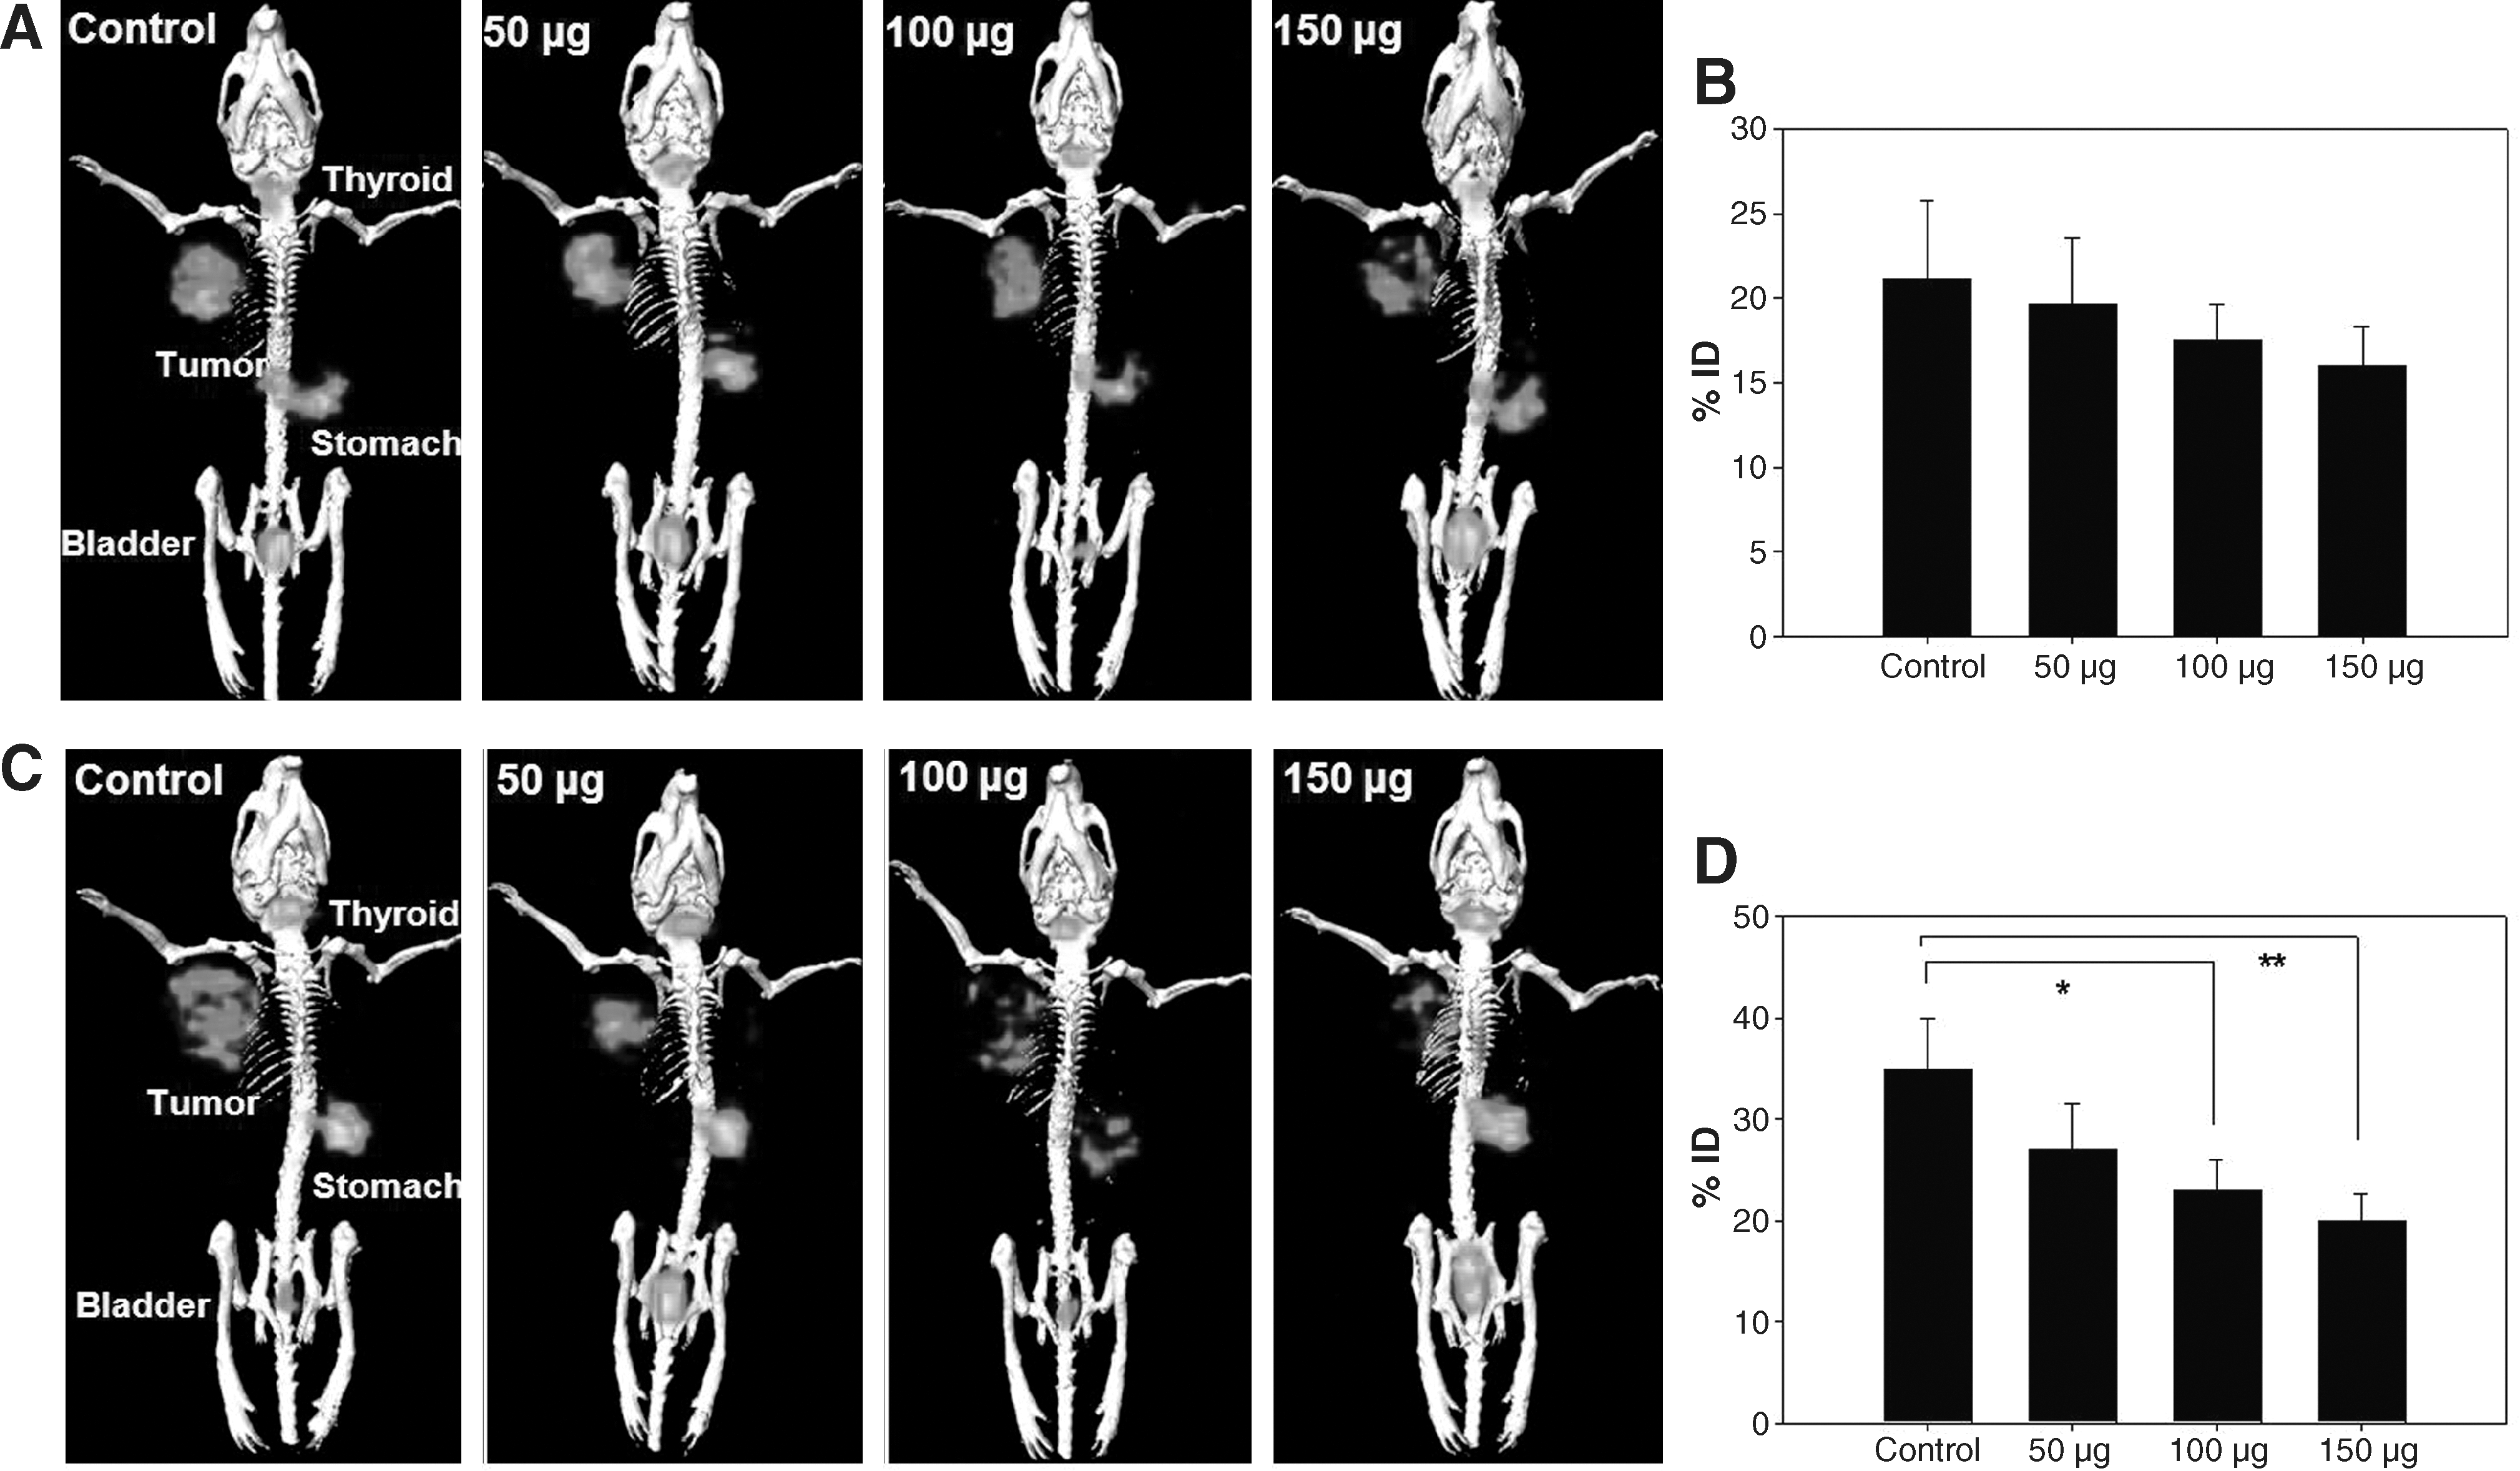
Whole-body microSPECT/CT images.
Expression of hNIS in a tumor model
To confirm the results of the diagnostic images obtained using a gamma imaging systems, RT-PCR of the hNIS gene was performed in tumors of all groups of mice according to the treatment dose of antibody. Relative quantitative analyses of band intensity were performed and compared between groups (Fig. 4). Ratio of hNIS/actin in the tumors treated with antibody at 50, 100, and 150 μg was 0.78, 0.75, and 0.735, respectively, compared with the ratio of 0.88 in the saline-treated tumor. The expression levels of hNIS mRNA in tumors of mice treated with antibody decreased slightly with increased treatment dose.

Quantification of hNIS mRNA expression. Mice were sacrificed 2 weeks after the first injection of anti-hVEGFR2 antibody. Tumors were extracted and the expression levels of the hNIS gene in the tumors of all groups were assessed using reverse transcription–polymerase chain reaction. Each lane represents one mouse. β-actin was used as a control.
Effect of anti-hVEGFR2 antibody on angiogenesis
Representative histological images of tumors from all groups are shown in Figure 5. The staining of blood vessels with anti-CD31 antibody demonstrated that tumor-induced angiogenesis was present in both control and anti-hVEGFR2 antibody–treated groups. However, angiogenesis was inhibited in the tumor tissues of the therapy groups compared to those in the control tumor tissues, as visible by naked eye; the tumor tissues of mice in the control group contained numerous tortuous vessels, whereas the majority of tumor vessels in the anti-hVEGFR2 antibody–treated tumors were less convoluted.
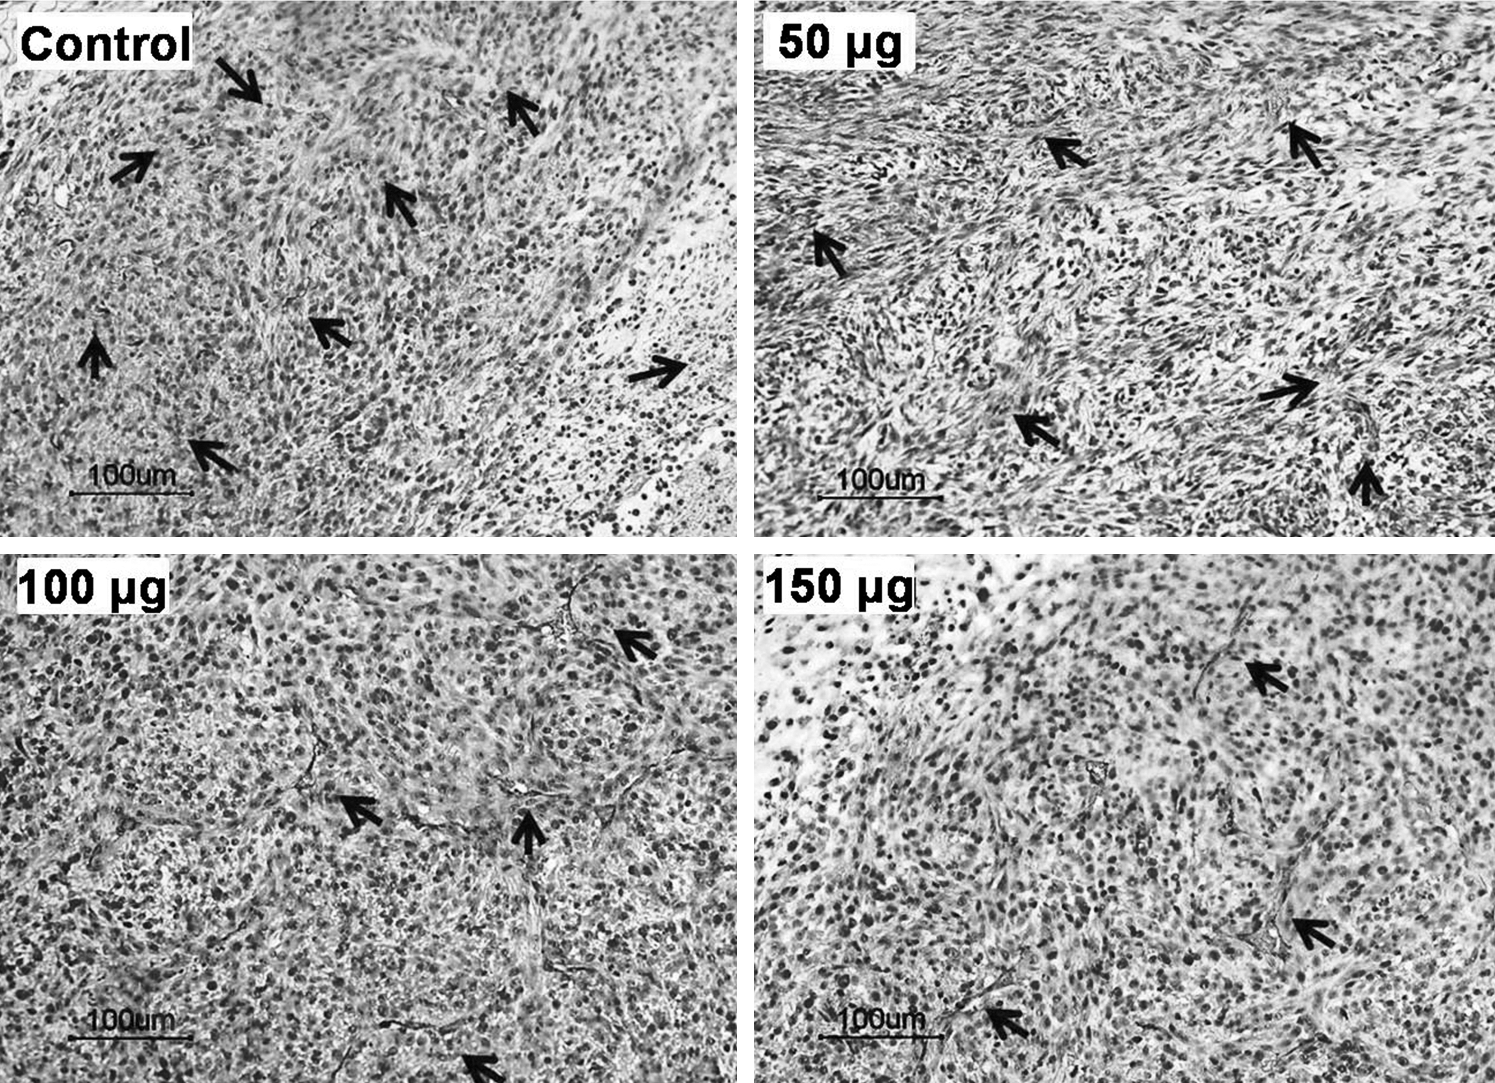
Detection of blood vessels via immunohistochemical staining for CD31. Mice were sacrificed 2 weeks after the first injection of anti-hVEGFR2 antibody. Tumors were extracted, and immunohistochemistry for CD31 was performed in tumor tissues from all groups. Control group; 50 μg anti-hVEGFR2 antibody; 100 μg anti-hVEGFR2 antibody; 150 μg anti-hVEGFR2 antibody. Arrows indicate the blood vessels in the tumor tissues.
Discussion
This study shows that molecular imaging technology based on reporter gene expression allows quantitative evaluation of therapeutic efficacy after applying anti-hVEGFR2 antibody therapy. The anti-hVEGFR2 antibody inhibits hemoglobin accumulation and vessel sprouting induced by VEGF. The anti-hVEGFR2 antibody used in this study was certified to inhibit the hemoglobin accumulation induced by VEGF in a mouse Matrigel plug assay. It also inhibited vessel sprouting induced by VEGF in the ex vivo rat aortic ring vessel sprouting assay. Thus, developing anti-hVEGFR2 antibody used in this study is effectively considered to inhibit VEGF-VEGFR2 (murine VEGFR2) interaction. The epitope of the antibody is mainly located in the domains 2 and 3 of the extracellular region of VEGFR2. The amino acid sequence similarity of the domains between the human and mouse VEGFR2 was 85%, indicating the possibility of cross-species reactivity. On the basis of the above results, we quantitatively evaluated the therapeutic efficacy of hNIS gene–transfected tumor xenografts using gamma imaging after treatment with an anti-VEGFR2 antibody.
First, mice bearing MDA-MB-231 cells that stably express the hNIS gene were generated. 22 Anti-hVEGFR2 antibody was administered through the tail veins of mice with the different doses (50, 100, and 150 μg) for the tumor therapy (Fig. 1). The measurement of tumor volume showed that the tumor growth was delayed in mice treated with anti-hVEGFR2 antibody, and that their body weights did not differ from those of the control mice (Fig. 2).
Next, in vivo gamma imaging study was performed to quantify the therapeutic effect of the anti-hVEGFR2 antibody (Fig. 3). The therapeutic efficacy of different doses of anti-hVEGFR2 antibody was evaluated by quantitative analysis of 125I uptake into the tumors. After 1 week of treatment, the 125I uptake by tumors in mice treated with 50 μg anti-hVEGFR2 antibody was 92.5% compared to the control group, which had 100% uptake. 125I uptakes by tumors treated with 100 and 150 μg anti-hVEGFR2 were 82.5% and 75.5%, respectively. Between 1 and 2 weeks of treatment, 125I uptake in the control group tumors increased by 65.0%. After 2 weeks of treatment, 125I uptakes by tumors in the groups treated with 50, 100, and 150 μg anti-hVEGFR2 antibody were 77.1%, 62.9%, and 55.7%, respectively, in comparison to the control group, which had 100% uptake. The uptake of radioiodide into tumors was probably reduced in the mice treated with the antibody due to necrosis of the tumor tissues and/or decrease in antigen expression in viable cells. Treatment with VEGFR2 blocking antibody is known to inhibit the formation of new blood vessels and to affect small immature vessels inside tumors. Therefore, treatment with VEGFR2 blocking antibody leads to tumor shrinkage and necrosis. 23 –25 Thus, the uptake of 125I may be reduced by the anti-hVEGFR2 antibody treatment of hNIS gene–transfected xenograft tumors.
The RT-PCR results confirmed the results of our evaluation using the gamma imaging system (Fig. 4), showing reduced hNIS gene expression due to the reduction of tumor mass and to the necrosis in the tumor tissue, which is well correlated with the in vivo gamma imaging results.
Finally, histologic analysis revealed a reduction in microvessel number, after the anti-hVEGFR2 antibody therapy. Histologic assessment further confirmed the reliability of a gamma imaging system for the evaluation of therapeutic efficacy (Fig. 5).
A number of strategies have been proposed to evaluate therapeutic efficacy using molecular imaging. 26 –29 Preclinical molecular imaging can provide a valid strategy of developing therapeutic antibody such as effect, decision of therapeutic dose, and pathologic evidence for therapeutic target. The therapeutic efficacy of molecular targeting can be evaluated using a reporter gene based molecular imaging system, and the results of this evaluation may prompt modifications of targeting agents under development through a feedback system.
Conclusions
We demonstrated the antitumor effect of a developed anti-hVEGFR2 antibody by its intravenous injection into in vivo mouse model. The present work has demonstrated that a molecular imaging system could be used for the quantitative evaluation of the therapeutic efficacy according to injected doses. Molecular imaging evaluation systems may be useful tools for the development of effective diagnostic and/or therapeutic antibodies that target specific molecules.
Footnotes
Acknowledgments
This study was supported by the National R&D Program for Cancer Control, Ministry of Health, Welfare and Family Affairs (0620220) and the Korea Research Foundation Grant funded by the Korean Government (MOEHRD) (KRF-2006-331-E00268). This work was also supported by Choubuk National University in 2009.
Disclosure Statement
No competing financial interests exist.