
Abstract
Cyclooxygenase (COX)-2 plays critical roles in tumorigenesis, tumor cell growth, and angiogenesis, and inhibiting the expression of COX-2 by gene therapy has showed promising prospects. Vectors are crucial for gene therapy. Polyamidoamine (PAMAM) dendrimers are one type of nano-vectors. In this study, we synthesized a generation 4 polyamidoamine (G4PAMAM) dendrimer/COX-2 antisense oligodeoxynucleotide complex (G4PAMAM/COX-2ASODN), determined the transfection rate of G4PAMAM/COX-2ASODN on cultured breast cancer cells, assessed the cell viability, cell cycle dynamics, and cell invasiveness after transfection, and investigated the effects of G4PAMAM/COX-2ASODN on the expression of COX-2 mRNA and protein and microvessel density (MVD) levels in the tumor tissues of a breast cancer nude mouse model. The results showed that G4PAMAM/COX-2ASODN had a high transfection rate, decreased the cell viability, induced apoptosis and G0/G1 cell cycle arrest, and suppressed cell invasiveness. After treatment with G4PAMAM/COX-2ASODN, the copy number of COX-2 mRNA and protein expression in the tumor tissue were decreased markedly, MVD in the tumor tissue was also decreased, and tumor growth was restrained (p<0. 05). We conclude that COX-2ASODN can be delivered into the cultured and transplanted breast cancer cells efficiently by G4PAMAM, can reduce the expression of COX-2 mRNA and protein, and can lower the MVD of tumor tissues. The G4PAMAM/COX-2ASODN complex has antitumor properties in vitro and in vivo.
Introduction
Cyclooxygenase (COX), the prostaglandin endoperoxide synthase, is the key enzyme responsible for the conversion of arachidonic acid to prostaglandins. At least two isoforms of COX have been described. COX-1 is constitutively expressed, 1,2 whereas COX-2, not normally present in cells, is rapidly induced by intercellular stimuli, including growth factors, inflammatory mediators, and tumor promoters. 3,4 COX-2 is an enzyme known to be involved in inflammation, but increasing evidence now supports its role in tumorigenesis and tumor development through mechanisms such as stimulating tumor cell growth, angiogenesis, and lymphangiogenesis, 5 –7 inhibiting the apoptosis of tumor cells, promoting tumor invasion and metastasis. 8,9 inactivating P53, 10 activating the epidermal growth factor receptor, 11 and inducing genomic instability. 12,13
More and more researchers have confirmed that the inhibition of COX-2 expression can prevent tumorigenesis and retard tumor growth. 14 –17 COX-2 inhibitors can reduce the expression of COX-2 and have an antitumor effect, but their undesirable side effects restrict their long-term application. 18
Therefore, inhibiting COX-2 expression by gene therapy has become popular. Antisense oligodeoxynucleotides (ASODN) are synthetic oligonucleotides complementary to the sense sequence of mRNA and are theoretically able to inhibit the expression of specific genes by binding to the target mRNA via Watson-Crick base-pairing. 19 How to transport a certain concentration of ASODN into cells and how to prevent it from degradation by the nuclease in the cells, however, have always been the bottlenecks of ASODN technology. 20
Loading capacity and the transfection efficiency of vectors play critical roles in gene therapy. Viral vectors and nonviral vectors are two main categories of gene delivery systems in current use. As a gene transferring vector, although retrovirus possesses the characteristic of high transfection efficiency, it can carry only a limited quantity of genes because of its small size. Liposomes can carry a larger amount of genes, but the liposome gene delivery system is unstable and has poor tissue specificity and relative low transfection efficiency.
Among nonviral vectors, the nanoparticles have developed into the most promising gene delivery system in recent years. Polyamidoamine (PAMAM) dendrimers are one type of nanoparticles. PAMAM is polymerized by ethylenediamine (or ammonia) and methylacrylate and can be divided into G0 (generation 0), G1, G2, until G11 PAMAM according to the number of terminal amino groups. 21 It is a highly branched macromolecule, nonimmunogenic, and can mediate the delivery of single-stranded and double-stranded, natural or synthetic DNA or RNA of any kind and any size. 22,23
The mechanisms by which dendrimers efficiently transfer genes have been extensively explored. 24 –26 PAMAM dendrimer binds to and condenses DNA through electrostatic interactions between negatively charged phosphate groups of the nucleic acid and positively charged amino groups on the dendrimer surface, giving rise to a particle termed dendriplex. Dendriplex protects DNA by sterically blocking the access of nucleolytic enzymes, 27 which prolongs the survival time of DNA in the body. Dendriplex binds to cell surface by electrostatic interaction with heparan sulfate proteoglycans and integrins (αvβ3) at cell surface and is internalized by endocytosis. 28,29
A PAMAM dendrimer has several internal secondary and tertiary amines, which are considered to play a critical role in preventing acidification in endosomes and lysosomes. These tertiary amine groups are known to induce the osmotic swelling of the endosome, because of the endosomal buffering that causes the rupture of endocytic vesicles and the subsequent release of their payload. Its transfection efficiency depends largely on the charge ratios of DNA and PAMAM dendrimer, dendrimer generation, and the size of PAMAM dendrimer. Gene transfer activity of dendrimers with high generations is likely to be superior to that of low generations. 22,26 Unfortunately, PAMAM dendrimers of higher generations are the most cytotoxic. 30,31 Therefore, there has been a growing interest in developing low generation dendrimers (<G4) because of their extremely low cytotoxicity. 32 In contrast to the complexes of the other generations of PAMAM dendrimers and DNA, G4PAMAM dendrimer/DNA complex showed advantages such as small and uniform particle size, high stability, and low toxicity. 26,32 –34 G4 is the unique generation that is able to preserve high binding efficiency at neutral and low pHs. 35
No researcher has reported that G4PAMAM dendrimers were used as COX-2ASODN vectors in therapy to cancer. Therefore, we designed COX-2ASODN and synthesized G4PAMAM/COX-2ASODN complex for the first time and then evaluated its transfection efficacy and antitumor effect in vitro and in vivo.
Materials and Methods
Materials
Human breast cancer cell line MDA-MB-231 was purchased from Shanghai Institute of Chinese Academy of Sciences; fetal bovine serum (FBS) from Shanghai Fumeng Company; liposome from Invitrogen company; (3-(4,5-Dimethylthiazol-2-yl)-2,5-diphenyltetrazolium bromide (MTT), dimethyl sulfoxide (DMSO), propidium iodide, and RNase A from Sigma Company; 16, 16-Dimethyl-prostaglandin E2 (PGE2) from Cayman Chemicals (Ann Arbor, MI); and Fast200 RNA Extraction Kit from Shanghai Feijie Co. Ltd. The reverse transcription kit and polymerase chain reaction (PCR) kit were from Takara Inc; COX-2ASODN (5′-ATTCAGAGAGGTAACCCC-3′), COX-2 primers (sense, 5′-CCCAGCACTTCACCCATCAG-3′; antisense, 5′-ATCAGACCAGGCACCAGACC-3′), β-actin primers (sense, 5′-ACGTCTGCTGGAAGGTGGAC-3′; antisense, 5′-GGTACCACCATGTACCCAGG-3′) were synthesized by Beijing Aoke Inc. The rat antihuman CD34 monoclonal antibody was from Beijing Zhongshan Jinqiao Co. Ltd, the rabbit antihuman COX-2 polyclonal antibody, β-actin antibody, immunohistochemistry (IHC) SP staining kit, and the 3,3' -Diaminobenzidine (DAB) chromogenic kit from Beijing Boaosen Bio-Engineering Co. Ltd, and the Bio-Rad Protein Assay Kit was from BIO-RAD, USA.
Preparation of transfection complex
G4PAMAM colloid was dissolved in sterile triple-distilled water and mixed into working solution at the concentration of 1 mg/mL. Sixty-six μg COX-2ASODN was dissolved in sterile triple-distilled water and mixed into working solution at the concentration of 0.1 μg/μL. The two working solutions were incubated at room temperature for 10 minutes and then mixed at the charge ratios (PAMAM to ASODN) of 10:1, 20:1, 30:1, and 40:1, respectively. The mixture was incubated at room temperature for 20 minutes and stored at 4°C for later usage. One μg DNA contained 1.96×10²¹ bp, and 1 μg G4PAMAM 2.751×10²¹ amino acid residues. Sixty-six μg COX-2ASODN and 1 mL Lipofectin were combined and incubated for 15 minutes at room temperature.
Detection of transfection efficiency in vitro
MDA-MB-231 cells were seeded in a 24-well plate, 1.5×10⁴ cells per well, and then incubated at 37°C overnight until the cells went into the exuberant growth period. Each well was washed with serum-free RPMI 1640 medium. A control group, a liposome/COX-2ASODN group, and groups with different charge ratios of G4PAMAM/COX-2ASODN complex were set up, and five wells were set for duplication validation. The serum-free RPMI 1640 medium was replaced with standard medium 4 hours later, and then the cells were digested with 0.25% trypsin after incubation for 24 hours, 48 hours, and 72 hours, respectively. Quiescent liquid was added and digestion was terminated. Then the cells were blown to fall off the culture plate, the cell suspension was centrifuged, and the supernatant was discarded. One mL phosphate buffered saline (PBS) buffer was added to each tube, and the cells were resuspended. After transfection with 1 μg fluorescein isothiocyanate (FITC)-labeled COX-2ASODN, the cellular uptake of COX-2ASODN was assessed by flow cytometry (FCM). The transfection experiment was carried out three times.
MTT assay
Two hundred μl MDA-MB-231 cell suspension at the concentration of 5×10⁴ cells/mL was added to a 96-well plate and then incubated at 37°C overnight until the cells went into the exuberant growth period. Each well was washed with serum-free RPMI 1640 medium. A control group, a liposome/COX-2ASODN group, and groups with different charge ratios of G4PAMAM/COX-2ASODN complex were set up, and five wells were set for duplication validation. Two hundred μL PBS, liposome/COX-2ASODN and different charge ratios of G4PAMAM/COX-2ASODN complex were added to the wells. The serum-free RPMI 1640 medium was replaced with standard medium 4 hours later, and the cells were collected for MTT assay after incubation for 24 hours, 48 hours, and 72 hours, respectively. Twenty μL MTT at the concentration of 5 g/L was added to each well. The plate was incubated for another 4 hours, and the supernatant was discarded. The cells were washed twice with PBS, each well was added with 150 μL DMSO, and the plate was vibrated horizontally for 10 minutes for the crystal to be dissolved and colored. Finally, the absorbance values were read at 490 nm with the multifunctional microplate test system, and the relative growth rate (RGR) was calculated according to the following equation: RGR (%)=AE/AC×100%, where AE is the absorbance in the experimental group and AC is the absorbance in the blank control group.
Analysis of cell cycle dynamics by flow cytometry
Cell cycle dynamics was assessed by staining DNA content with propidium iodide as follows: MDA-MB-231 cells were plated at a density of 1×10⁶ cells per 100 mm culture dish and incubated for 24 hours. Fresh complete media with no additive, or fresh complete media with G4PAMAM, COX-2ASODN, or G4PAMAM/COX-2ASODN complex were replaced to culture dishes and further incubated for 24 hours. After incubation, both adherent and floating cells were harvested and fixed with 80% ethanol in PBS overnight. Fixed cells were sequentially incubated with RNase A (50 μg/mL) and propidium iodide (50 μg/mL) for 30 minutes, respectively. Cellular DNA content was analyzed by flow cytometer (Becton Dickinson). At least 2×10⁴ cells were used for each analysis, and results were displayed as histograms. The percentages of cells in sub-G1 (apoptosis), G0/G1, S, and G2/M phase were calculated using ModFit 3.0 program (Verity Software, Inc.).
Invasion assay
The invasion assay was performed in Matrigel-coated invasion chambers (Becton Dickinson Labware), as described previously. 36 Briefly, resuspended MDA-MB-231 cells (5×10⁴) were plated in the upper chamber with 0.5 mL of serum-free RPMI-1640 medium and treated with G4PAMAM, COX-2ASODN, or G4PAMAM/COX-2ASODN complex, in the presence or absence of 10 μg/mL of PGE2, while control cells received serum-free medium only. The lower chamber was filled with 0.8 mL of RPMI-1640 medium containing 10% FBS as a source of chemoattractants. After an incubation of 24 hours at 37°C in a humidified 5% CO2 atmosphere, the noninvading cells on the upper surface of the membrane were mechanically removed with a cotton swab. Cells adherent to the lower surface of the membrane were fixed in 25% methanol and stained with crystal violet. The invading cells were counted and photographed under an inverted microscope (Olympus) at 200× magnification. Five fields were counted per filter in each group, and five duplicate assays were conducted in triplicate.
Establishment of mouse tumor xenograft model of human breast cancer
Specific pathogen-free (SPF) grade female BALB/cnu-nu athymic mice of about 18 to 20 g at the age of 4 to 5 weeks were purchased from Shanghai Silaike Laboratory Animal Co. Ltd and raised by the Laboratory Animal Research Center of Xi'an Jiaotong University under SPF conditions. The animal research protocol was approved by Animal Care and Use Committee of Xi'an Jiaotong University. Approximately 0.5×10⁷ MDA-MB-231 cells resuspended in 200 μL of serum-free cell culture medium were subcutaneously injected into the right armpit of female athymic mice. When the subcutaneous tumor had reached a size of 1 cm in the largest diameter, the tumor was harvested under strict aseptic conditions, minced by a scalpel into small (1 mm3) fragments, and inserted into the catheter of a pleural biopsy needle.
The mammary fat pad of the second right pair mammary of preinoculated athymic mice was sterilized, and 25 mice were transplanted with small pieces of tumor tissue through a pleural biopsy needle. When well-established tumors of ∼ 0.2 cm3 were detected, the mice were randomly divided into the control group (physiologic saline), the G4PAMAM group, the COX-2ASODN group, and the G4PAMAM/COX-2ASODN group. Different treatments were given by intraperitoneal injection once every other day for a total of 10 times. The experiments were ended 3 days after all treatments were finished; then the tumor-bearing athymic mice were sacrificed, and the tumor tissues were isolated to perform IHC staining, Western blot analysis, and reverse transcriptase (RT)-PCR analysis.
RT-PCR analysis
The total cellular RNA was extracted using the Fast200 RNA Extraction Kit, and cDNA was subsequently synthesized using a reverse transcription kit as described by the manufacturers. cDNA was amplified with specific primers for COX-2, and β-actin was used as an internal control to confirm the successful cDNA synthesis. PCR was performed under the following conditions: Predenaturized at 94°C for 2 minutes, denaturized at 94°C for 30 seconds, annealed at 55°C for 30 seconds, and extended at 72°C for 45 seconds, with one more extension for 7 minutes after 35 cycles of amplification. Primers for COX-2 were: sense, 5′-CCCAGCACTTCACCCATCAG-3′; antisense, 5′-ATCAGACCAGGCACCAGACC-3′. Primers for β-actin were: sense, 5′-ACGTCTGCTGGAAGGTGGAC-3′; antisense, 5′-GGTACCACCATGTACCCAGG-3′. The PCR products were separated in 2% agarose gel stained with ethidium bromide (0.5 mg/mL), and photographed. The band intensities on gel photographs were quantified by Quantity One Analysis System. The products ratio of COX-2 and β-actin was the relative COX-2 mRNA expression of the transplanted tumor tissue.
Detection of COX-2 protein and microvessel density (MVD) by IHC staining
A portion of the tissues was made into paraffin-embedded sections. Then the antigens were repaired after being conventionally dewaxed. The sections were incubated for 10 minutes in 3% H2O2 deionized water to eliminate the endogenous peroxidase activity, and then washed in PBS 3 times for 5 minutes; 5%∼10% normal goat serum was added at room temperature to block the unspecific antigens, and the sections were finally incubated for 15 minutes. The fluid was discarded and the primary antibody was added (the rat antihuman CD34 monoclonal antibody and the rabbit antihuman COX-2 polyclonal antibody; the best diluted concentrations of antibodies were 1:50 and 1:200, respectively, screened out from different dilution ratios). They were incubated overnight at 4°C and washed in PBS 3 times for 5 minutes. Afterward, the sections were exposed to biotin-labeled goat antirat (rabbit) immunoglobulin and incubated at room temperature for 15 minutes, then washed in PBS 3 times for 5 minutes; horseradish peroxidase-avidin enzyme working solution was added, and the sections were finally incubated at room temperature for 15 minutes and washed in PBS 4 times for 5 minutes. DAB was added to develop color, and the response was observed under a microscope. The sections were washed repeatedly with water, and the nuclei were counterstained mildly with hematoxylin. The sections were dehydrated by ethanol, exposed to xylene, and mounted by neutral resin.
Criteria for COX-2 staining: Ten views of each slice were taken under a high-power microscope, the gray values of each view were calculated with the pathologic image analysis system, and the mean gray value of 10 views was the gray value of an individual slice.
Microvessel counting method 37 : The areas containing the greatest numbers of microvessels, namely “hot spots,” were identified by scanning the stained sections at low magnification (40x) with a light microscope. The microvessels in the hot spots were counted at 100x magnification. A single, countable microvessel was defined as any vessel with lumen and endothelial cells or endothelial cell cluster brown-stained. The MVD of each tissue was determined in three separate fields per hot spot. The MVD was expressed as the mean±standard deviation (SD) for each group, under the observations of two independent readers who selected the hot spots and counted the microvessels.
Western blot analysis
Western blot analysis was performed to determine COX-2 expression using standard procedures. Tumor chunks (100 mg per mouse) from the mice in the control and experimental groups were pulverized and left on ice for 40 minutes in 500 μL of ice-cold cell lysis buffer (10% NP-40, 5 M NaCl, 1 M HEPES, 0.1 M ethylene glycol tetraacetic acid, 0.5 M ethylenediaminetetraacetic acid, 0.1 M phenylmethylsulfonyl fluoride, 0.2 M sodium orthovanadate, 1 M NaF, aprotinin [2 μg/mL] and leupeptin [2 μg/mL]). Pulverized tissue was homogenized using a Dounce homogenizer and centrifuged at 15,000 g for 10 minutes at 4°C. The total protein concentration in tissue homogenates was measured using the BIO-RAD Protein Assay Kit with bovine serum albumin as in the control group. Proteins were then separated by 10% sodium dodecylsulfate-polyacrylamide gel electrophoresis and electrotransferred to polyvinylidene difluoride membranes. The membranes were preincubated with skimmed dry milk to reduce nonspecific protein binding, probed for COX-2 and β-actin, and then visualized by enhanced chemiluminescence. The changes in COX-2 expression were normalized against β-actin expression and detected by densitometry with at least three independent experiments to confirm the results.
Statistical analysis of the data
All of the data were processed with SPSS16.0 statistical analysis software and expressed as mean±SD. Single-factor analysis of variance was used to compare the differences among the groups and p<0.05 was considered a significant difference.
Results
G4PAMAM/COX-2ASODN showed a high transfection rate in vitro
Detected by FCM 24 hours after transfection with 1 μg FITC-labeled COX-2ASODN, the transfection rates of each group were 0.64%, 87.61%, 82.16%, 85.96%, 88.07%. and 96.69%, respectively (Fig. 1). The transfection rate of the 40:1 G4PAMAM/COX-2ASODN complex group was higher than that of the other groups (p<0.05). The transfection rate showed no significant differences among the 10:1, 20:1, 30:1 G4PAMAM/COX-2ASODN complex groups and the liposome/COX-2ASODN group (p>0.05). The trend still existed with the extension of time, although the transfection rates of each group decreased gradually.

Transfection efficiency of each group. The transfection efficacy was assessed by flow cytometric analysis of cells 24 hours after transfection with 1μg fluorescein isothiocyanate-labeled COX-2ASODN. The transfection rate of the 40:1 G4PAMAM/COX-2ASODN complex group was higher than that of the other groups (p<0.05). The transfection rate showed no significant differences among the 10:1, 20:1, 30:1 G4PAMAM/COX-2ASODN complex groups and the liposome/COX-2ASODN group (p>0.05). *p<0.05 vs control, **p<0.05 vs G4PAMAM/COX-2ASODN. a, control group; b, liposome/COX-2ASODN group; c, 10:1 G4PAMAM/COX-2ASODN group; d, 20:1 G4PAMAM/COX-2ASODN group; e, 30:1 G4PAMAM/COX-2ASODN group; f, 40:1 G4PAMAM/COX-2ASODN group.
RGR of cells decreased by G4PAMAM/COX-2ASODN
The cell viability in the control group was significantly higher than that in the transfection groups (p<0.05). The cell viability of the 40:1 G4PAMAM/COX-2ASODN complex group was lower than that of the other charge ratios complex groups and the liposome/COX-2ASODN group (p<0.05). The growth of cells decreased as the charge ratio of G4PAMAM/COX-2ASODN complex increased and was restored gradually with time, but there were no significant differences among the 10:1, 20:1, 30:1 G4PAMAM/COX-2ASODN complex groups and the liposome/COX-2ASODN group (p>0.05). It indicated that the cell viability was associated with charge ratios of G4PAMAM/COX-2ASODN complex (Fig. 2).
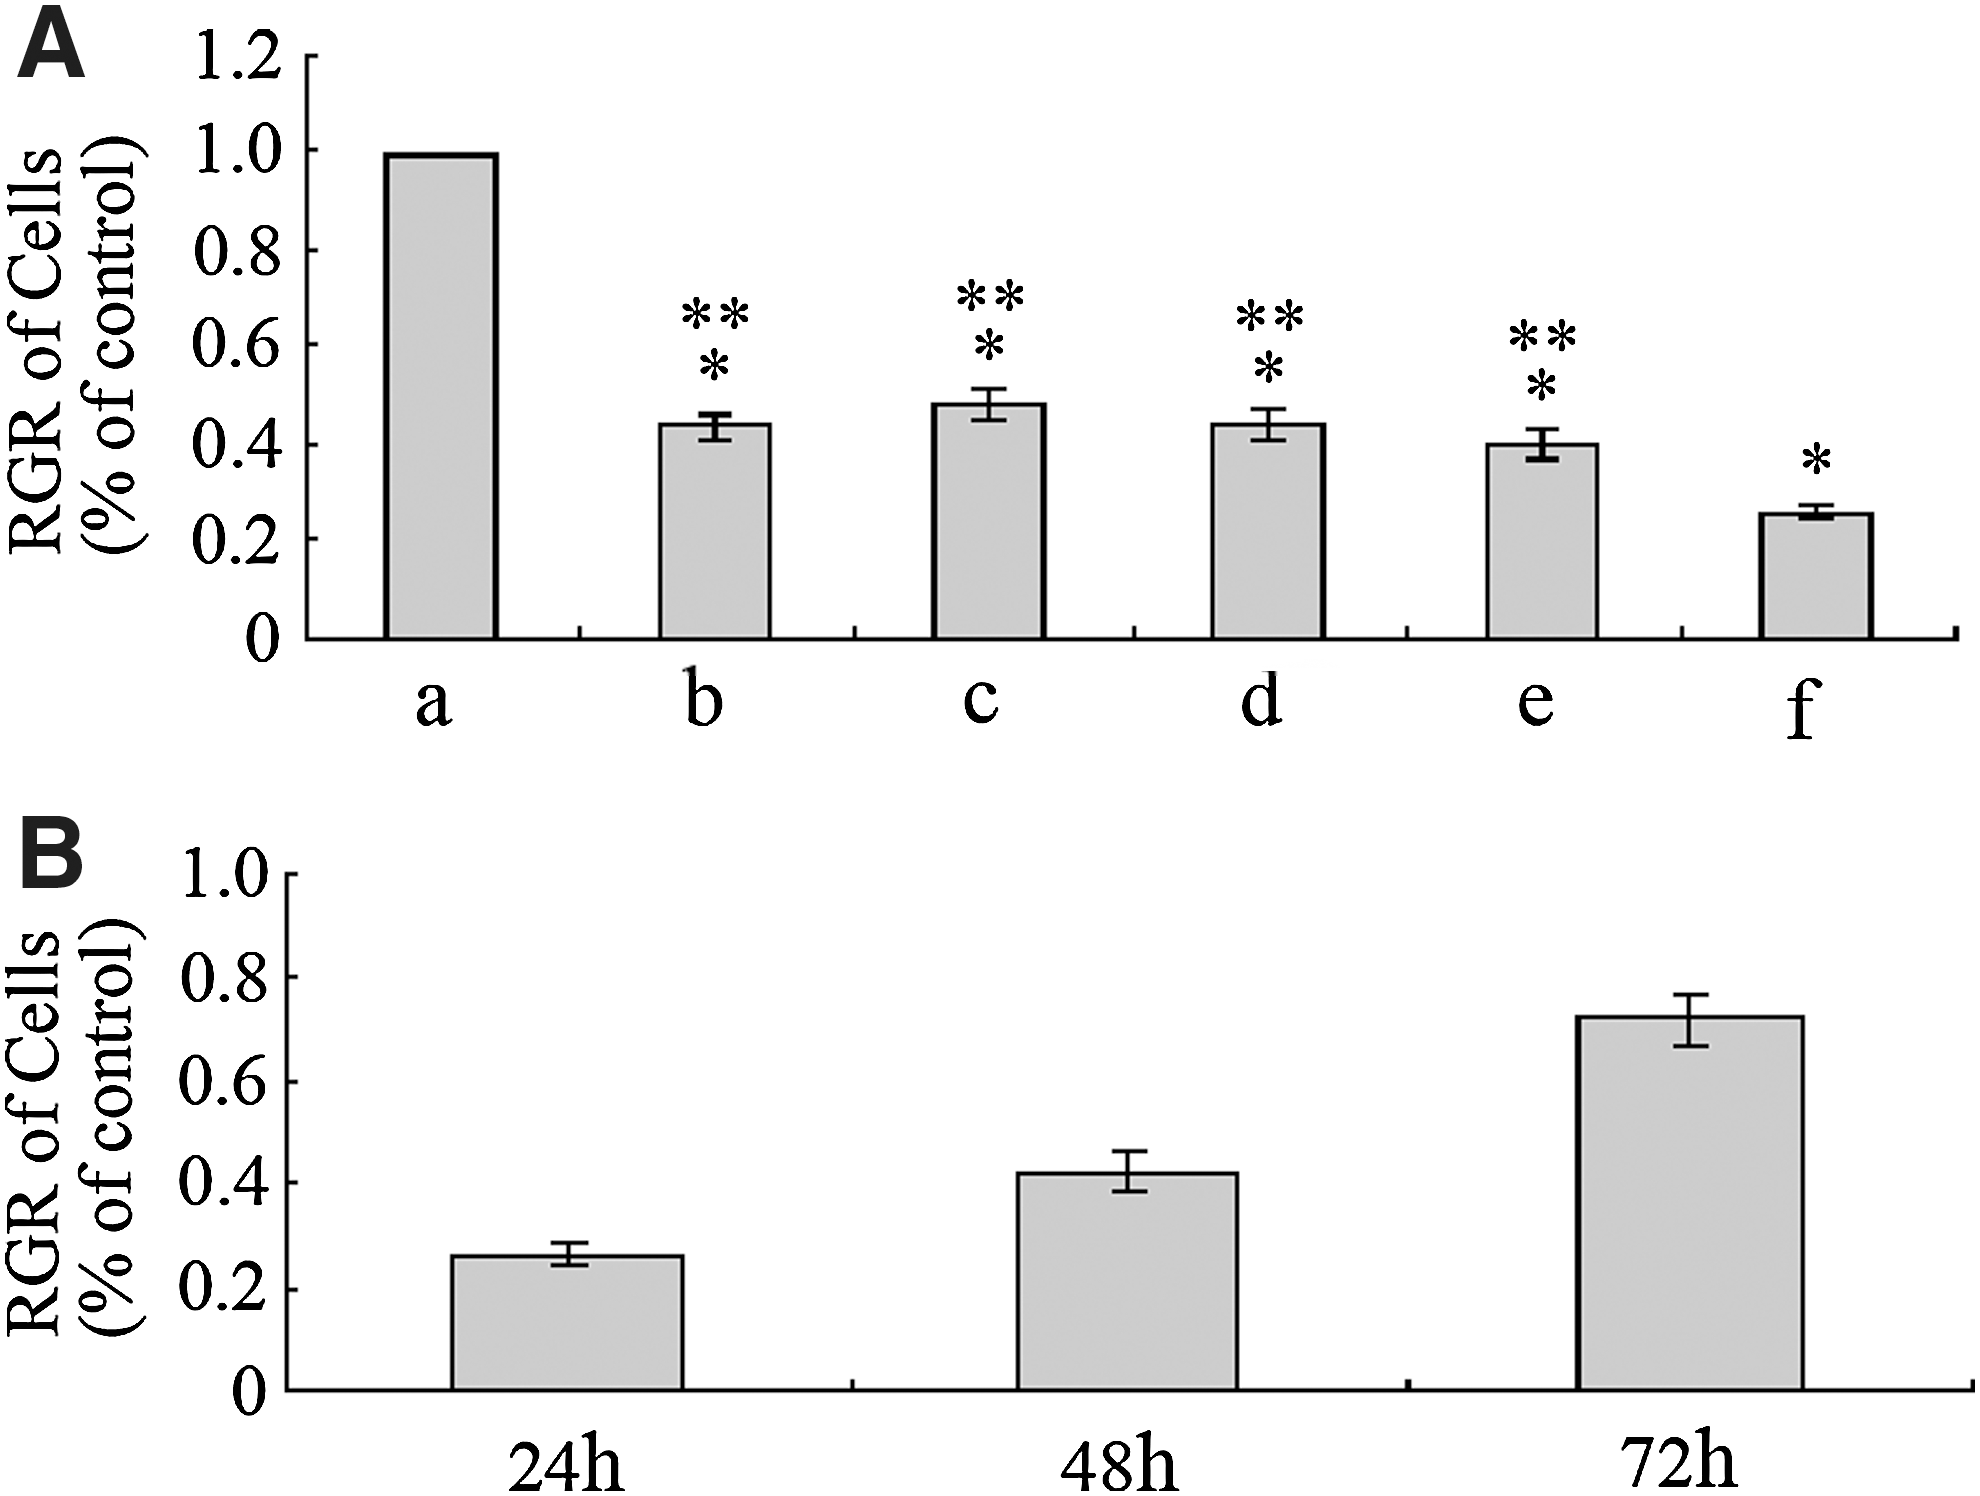
Relative growth rate (RGR) of cells. The cell viability of the 40:1 G4PAMAM/COX-2ASODN complex group was lower than that of the other charge ratios complex groups and the liposome/COX-2ASODN group (p<0.05). The growth of cells decreased as the charge ratio of G4PAMAM/COX-2ASODN complex increased and was restored gradually with time, but there were no significant differences among the 10:1, 20:1, 30:1 G4PAMAM/COX-2ASODN complex groups and the liposome/COX-2ASODN group (p>0.05). *p<0.05 vs control, **p<0.05 vs G4PAMAM/COX-2ASODN. a, control group; b, liposome/COX-2ASODN group; c, 10:1 G4PAMAM/COX-2ASODN group; d, 20:1 G4PAMAM/COX-2ASODN group; e, 30:1 G4PAMAM/COX-2ASODN group; f, 40:1 G4PAMAM/COX-2ASODN group.
Induction of apoptosis and G0/G1 cell cycle arrest by G4PAMAM/COX-2ASODN
To elucidate the mechanism by which G4PAMAM/COX-2ASODN complex inhibits MDA-MB-231 cell proliferation, FCM analysis was performed to determine the effects on cell cycle progression in cells treated with G4PAMAM, COX-2ASODN or G4PAMAM/COX-2ASODN complex. The results showed that the percentages of cells in apoptosis and G0/G1 phase in the G4PAMAM/COX-2ASODN group and the COX-2ASODN group were significantly greater than those in G4PAMAM group and blank control group (p<0.05), and G4PAMAM/COX-2ASODN had enhanced effects than COX-2ASODN (p<0.05) (Fig. 3). These results suggest that the antiproliferative effect of G4PAMAM/COX-2ASODN is related to the induction of apoptosis and cell cycle arrest in the G0/G1 phase.
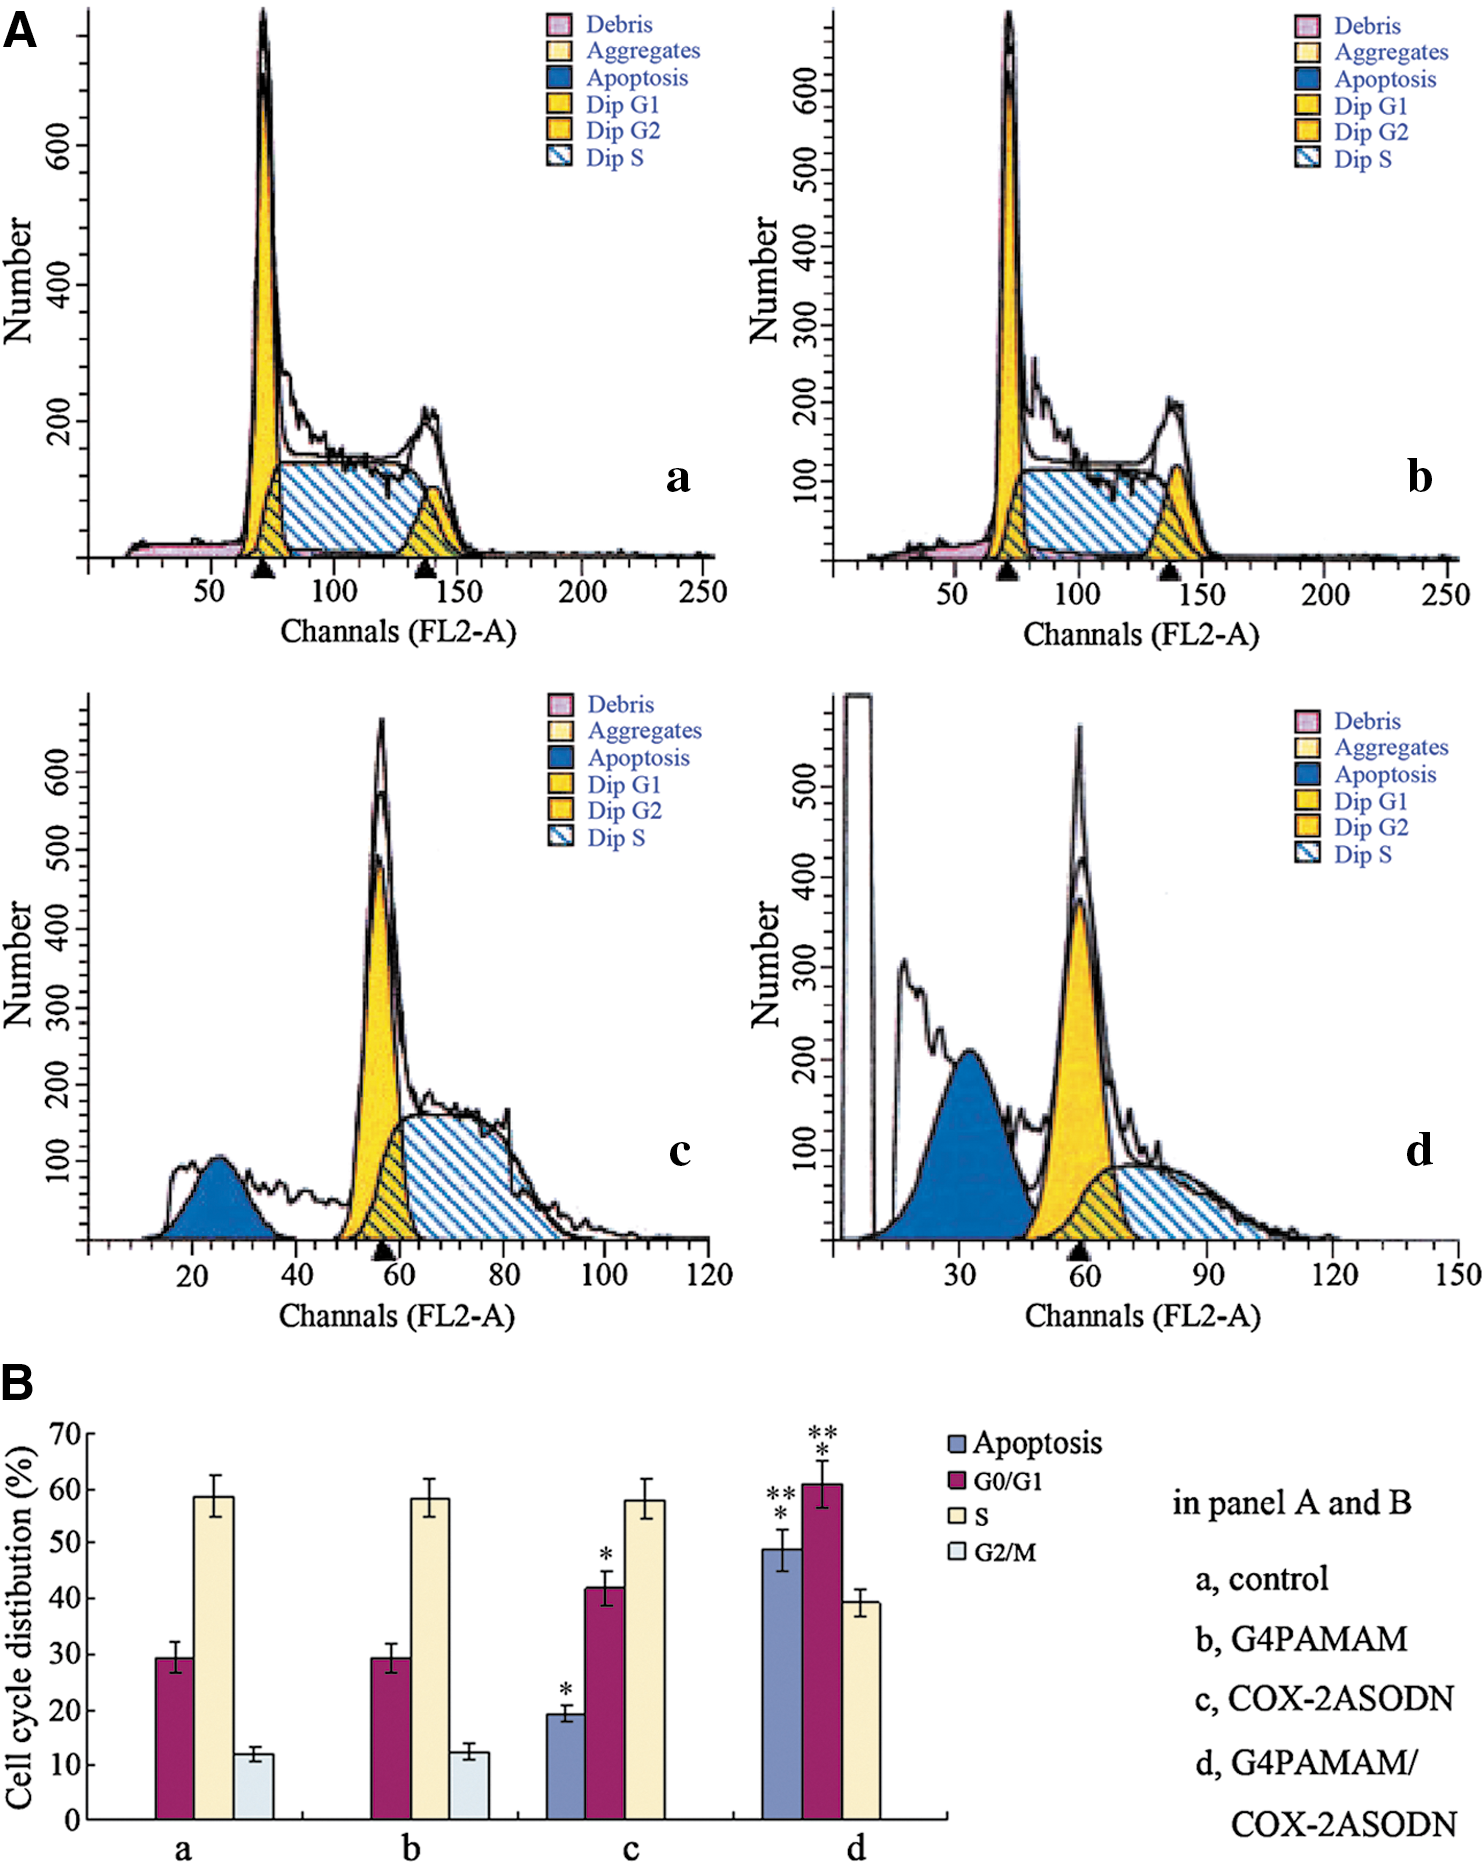
Cell cycle blockage and apoptosis induction by G4PAMAM/COX-2ASODN. The percentages of cells in apoptosis and G0/G1 phase were significantly greater in the G4PAMAM/COX-2ASODN group and the COX-2ASODN group than in the G4PAMAM group and blank control group (p<0.05), and G4PAMAM/COX-2ASODN had enhanced effects than COX-2ASODN (p<0.05). NB: According to ModFit 3.0, cell cycle calculation does not include apoptosis population. Apoptosis percentage is calculated against total cell population including apoptotic cells and live cells in cell cycle phases. *p<0.05 vs control, **p<0.05 vs COX-2ASODN.
Cell invasiveness suppressed by G4PAMAM/COX-2ASODN
To examine the effects of G4PAMAM/COX-2ASODN complex on the invasiveness of MDA-MB-231 cells, the Matrigel invasion assays were performed. The results showed that the invasiveness of cells in the G4PAMAM/COX-2ASODN group and the COX-2ASODN group was significantly lower than that in the G4PAMAM group and untreated control group (p<0.05), and G4PAMAM/COX-2ASODN had stronger effects than COX-2ASODN (p<0.05). In the presence of 10 μg/mL of PGE2, this suppressed invasiveness was partially recovered. The presence of exogenous PGE2 alone slightly but significantly increased the invasiveness (p<0.05) (Fig. 4).

Invasiveness of MDA-MB-231 cells assessed by Matrigel invasion assays. G4PAMAM/COX-2ASODN and COX-2ASODN suppressed the invasiveness of MDA-MB-231 cells more significantly than G4PAMAM and control (p<0.05), and G4PAMAM/COX-2ASODN had stronger effects than COX-2ASODN (p<0.05). In the presence of 10 μg/mL of prostaglandin E2 (PGE2), this suppressed invasiveness was partially recovered. Values represent the mean cell counts±standard deviation; n=15. *p<0.05 vs control, **p<0.05 vs COX-2ASODN, ***p<0.05 vs corresponding counterpart without PGE2. a, serum-free medium group; b, G4PAMAM group; c, COX-2ASODN group; d, G4PAMAM/COX-2ASODN group.
Growth of tumor retarded by G4PAMAM/COX-2ASODN
The mice were monitored daily after inoculation, and various sizes of subcutaneous nodules could be seen at the inoculating point 1 week later. The tumor formation rate was 88% (22 of 25) in athymic mice 2 weeks after inoculation. Then the corresponding intraperitoneal injections were given randomly, and long diameter and short diameter of tumors were measured every other day. The tumor volume was calculated according to the following equation 16 : volume=(length of short axis) 2 ×(length of long axis)×0.5, then the mean volume of each group was calculated. The standard tumor growth curve of each group was drawn (Fig. 5). It showed that the tumor growth of tumor-bearing athymic mice was significantly inhibited in the G4PAMAM/COX-2ASODN complex group (p<0.05), and G4PAMAM/COX-2ASODN exhibited a stronger inhibitory effect than COX-2ASODN (p<0.05).

Growth curves of each group. The tumor growth of tumor-bearing athymic mice was significantly inhibited in the G4PAMAM/COX-2ASODN complex group (p<0.05), and G4PAMAM/COX-2ASODN exhibited a stronger inhibitory effect than COX-2ASODN (p<0.05). a, control group; b, G4PAMAM group; c, COX-2ASODN group; d, G4PAMAM/COX-2ASODN group.
COX-2 mRNA expression reduced by G4PAMAM/COX-2ASODN
The OD values of the total extracted RNA were from 1.8 to 2.0. The RNA samples were taken for 1% agarose gel electrophoresis, and 28 S and 18 S bands could be seen clearly. It proved that the integrity of RNA and the RNA could be used for subsequent RT-PCR. The results showed that the β-actin bands of the internal control were located at 163 bp site and the specific COX-2 bands were located at 292 bp site (Fig. 6). The COX-2 mRNA of the COX-2ASODN group and the G4PAMAM/COX-2ASODN group were lower than that of the control group and the G4PAMAM group (p<0.05). The COX-2 mRNA of the G4PAMAM/COX-2ASODN group was lower than that of the COX-2ASODN group (p=0.016).
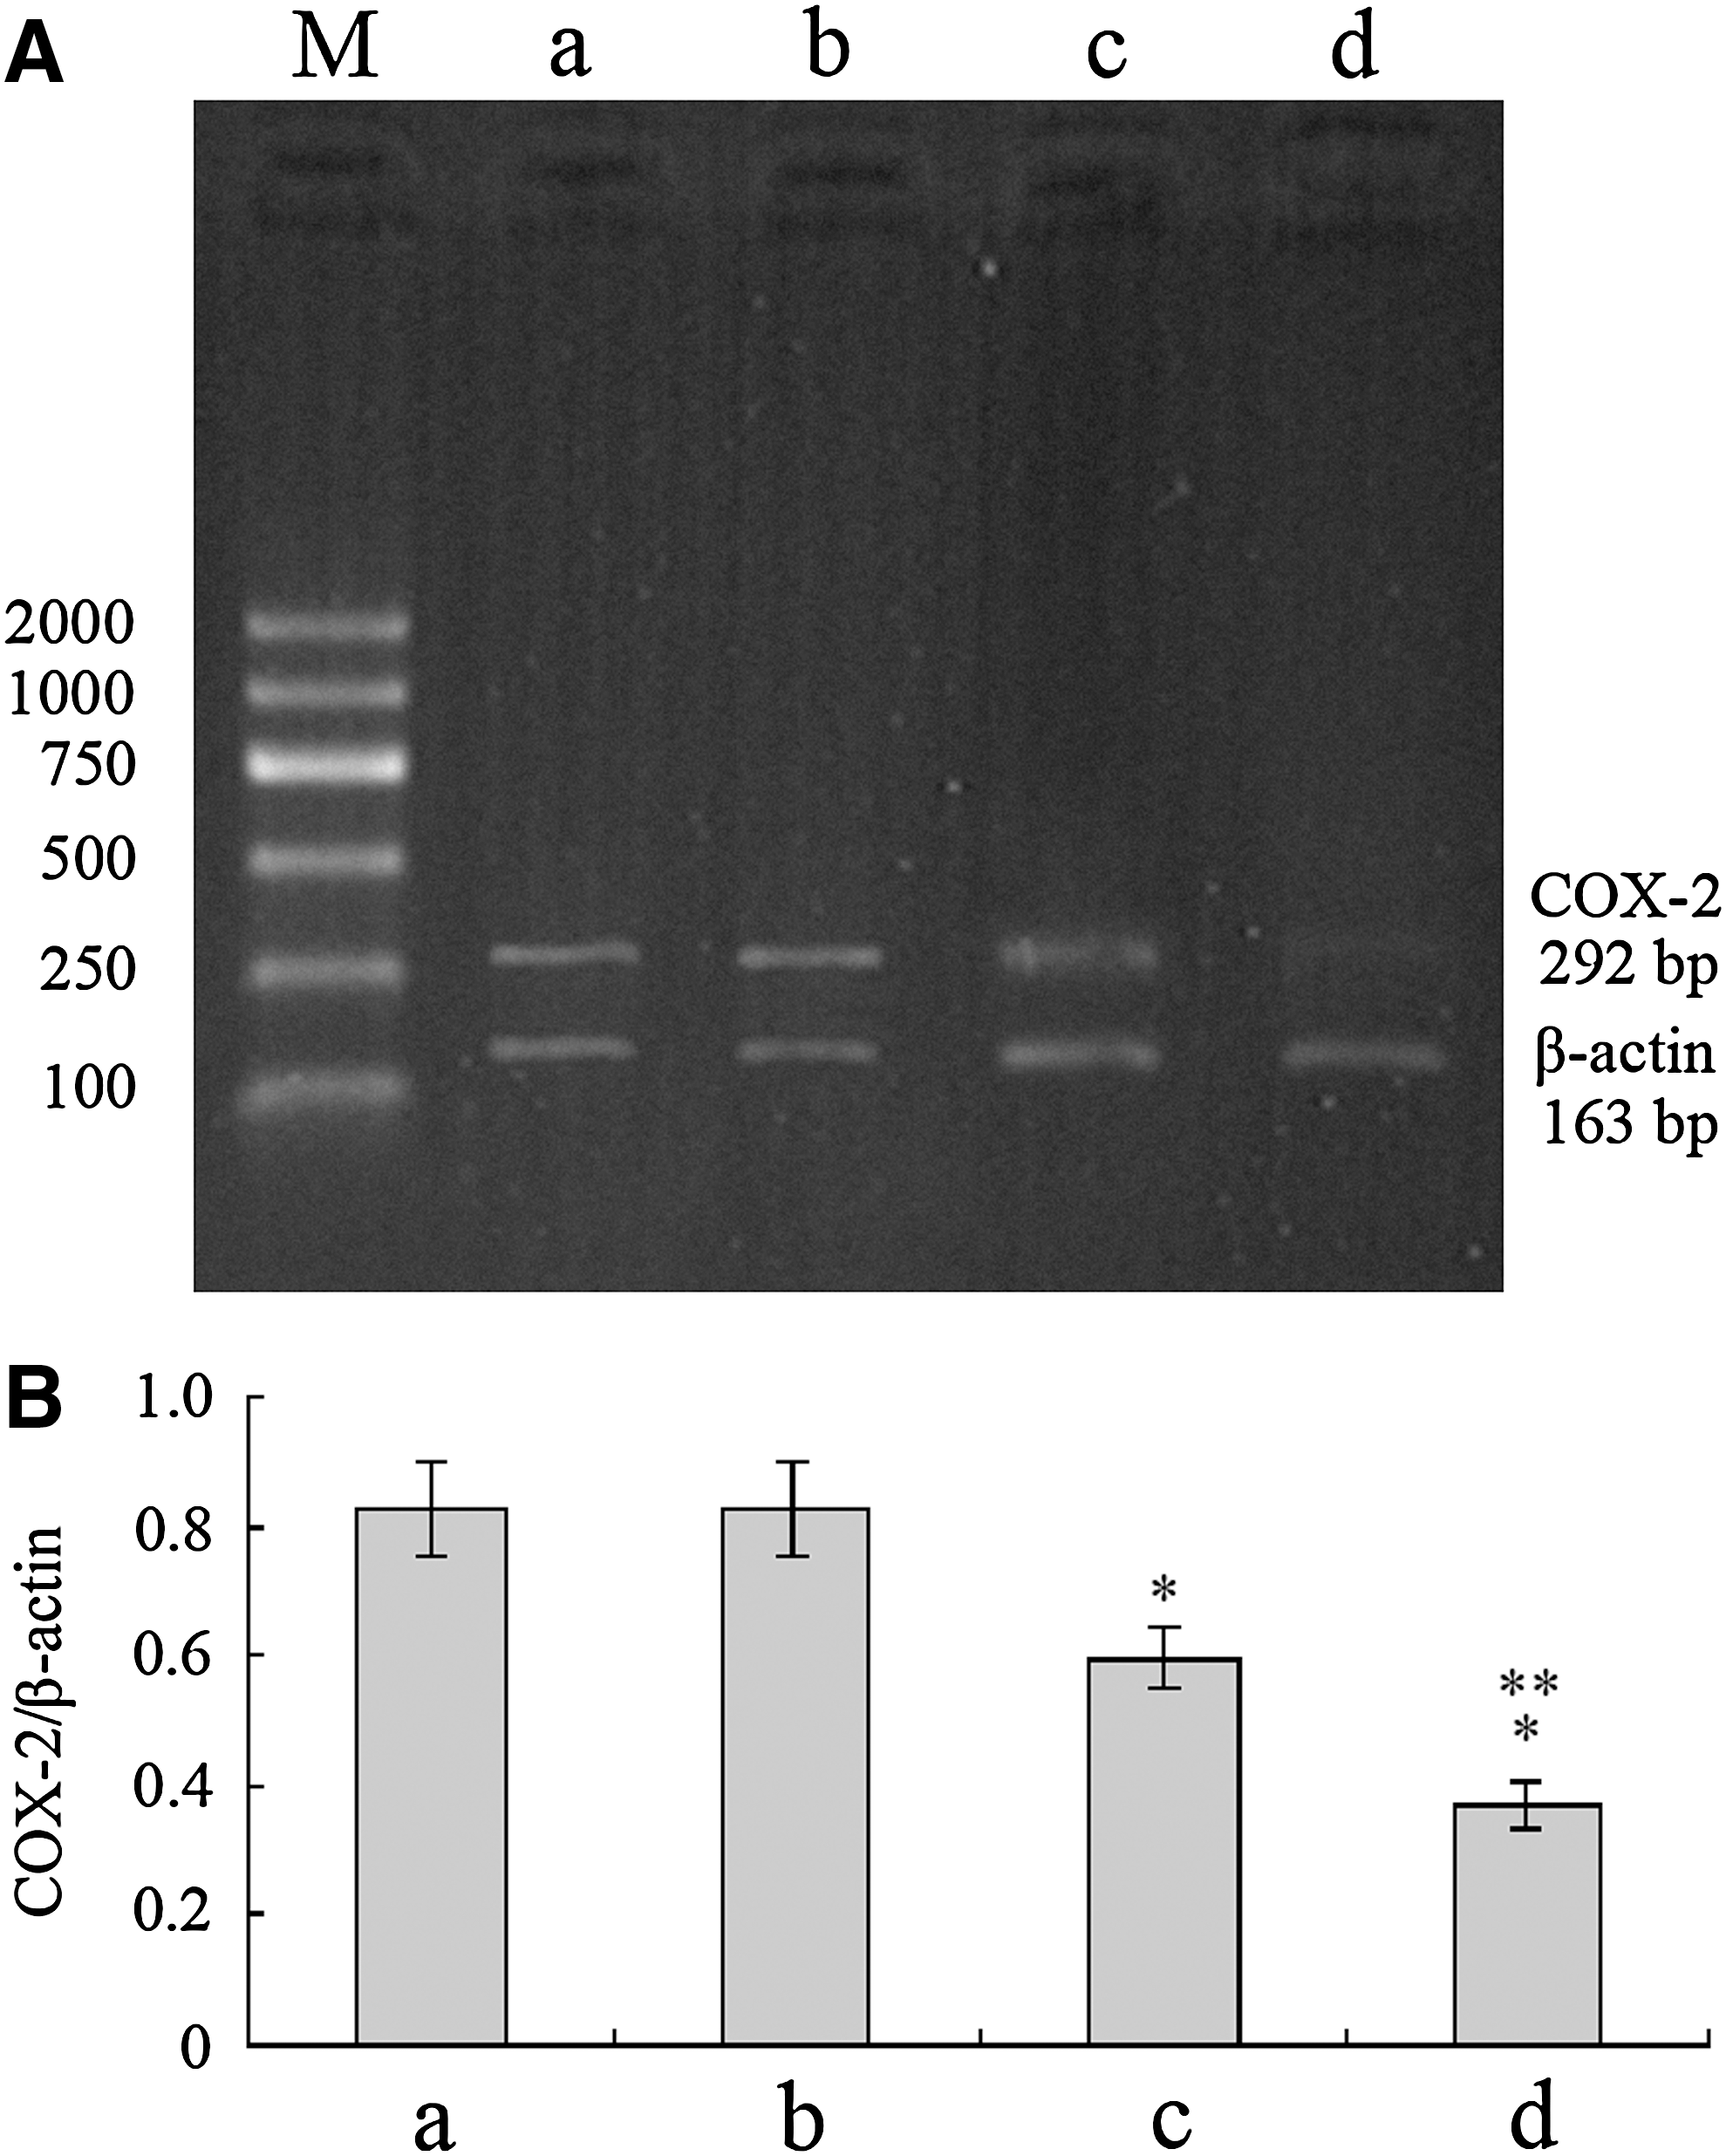
Relative expression levels of COX-2 mRNA. COX-2 mRNA of the COX-2ASODN group and the G4PAMAM/COX-2ASODN group was lower than that of the control group and the G4PAMAM group (p<0.05). COX-2 mRNA of the G4PAMAM/COX-2ASODN group was lower than that of COX-2ASODN group (p=0.016). *p<0.05 vs control, **p=0.016 vs COX-2ASODN. M, marker; a, control group; b, G4PAMAM group; c, COX-2ASODN group; d, G4PAMAM/COX-2ASODN group.
COX-2 protein expression inhibited by G4PAMAM/COX-2ASODN
IHC staining was performed to detect COX-2 protein expression. Observed with a light microscope, the positive staining of COX-2 protein showed brown particles and different shades of color, and it was distributed mainly in the cytoplasm of tumor cells. The results showed that the expression of COX-2 protein in the blank control group and the G4PAMAM group was wide in scope, dark in color, and was significantly higher than that of the other two groups. The positive staining of the COX-2ASODN group was of a smaller range, and the positive granules in the cytoplasm were of different shades. The positive staining of the G4PAMAM/COX-2ASODN group was of a smaller range and the positive granules in the cytoplasm significantly decreased in the extent of staining and showed pale yellow. The gray value of each slice was calculated by the image signal acquisition and analysis systems, and the mean gray value of each group was determined and shown in the
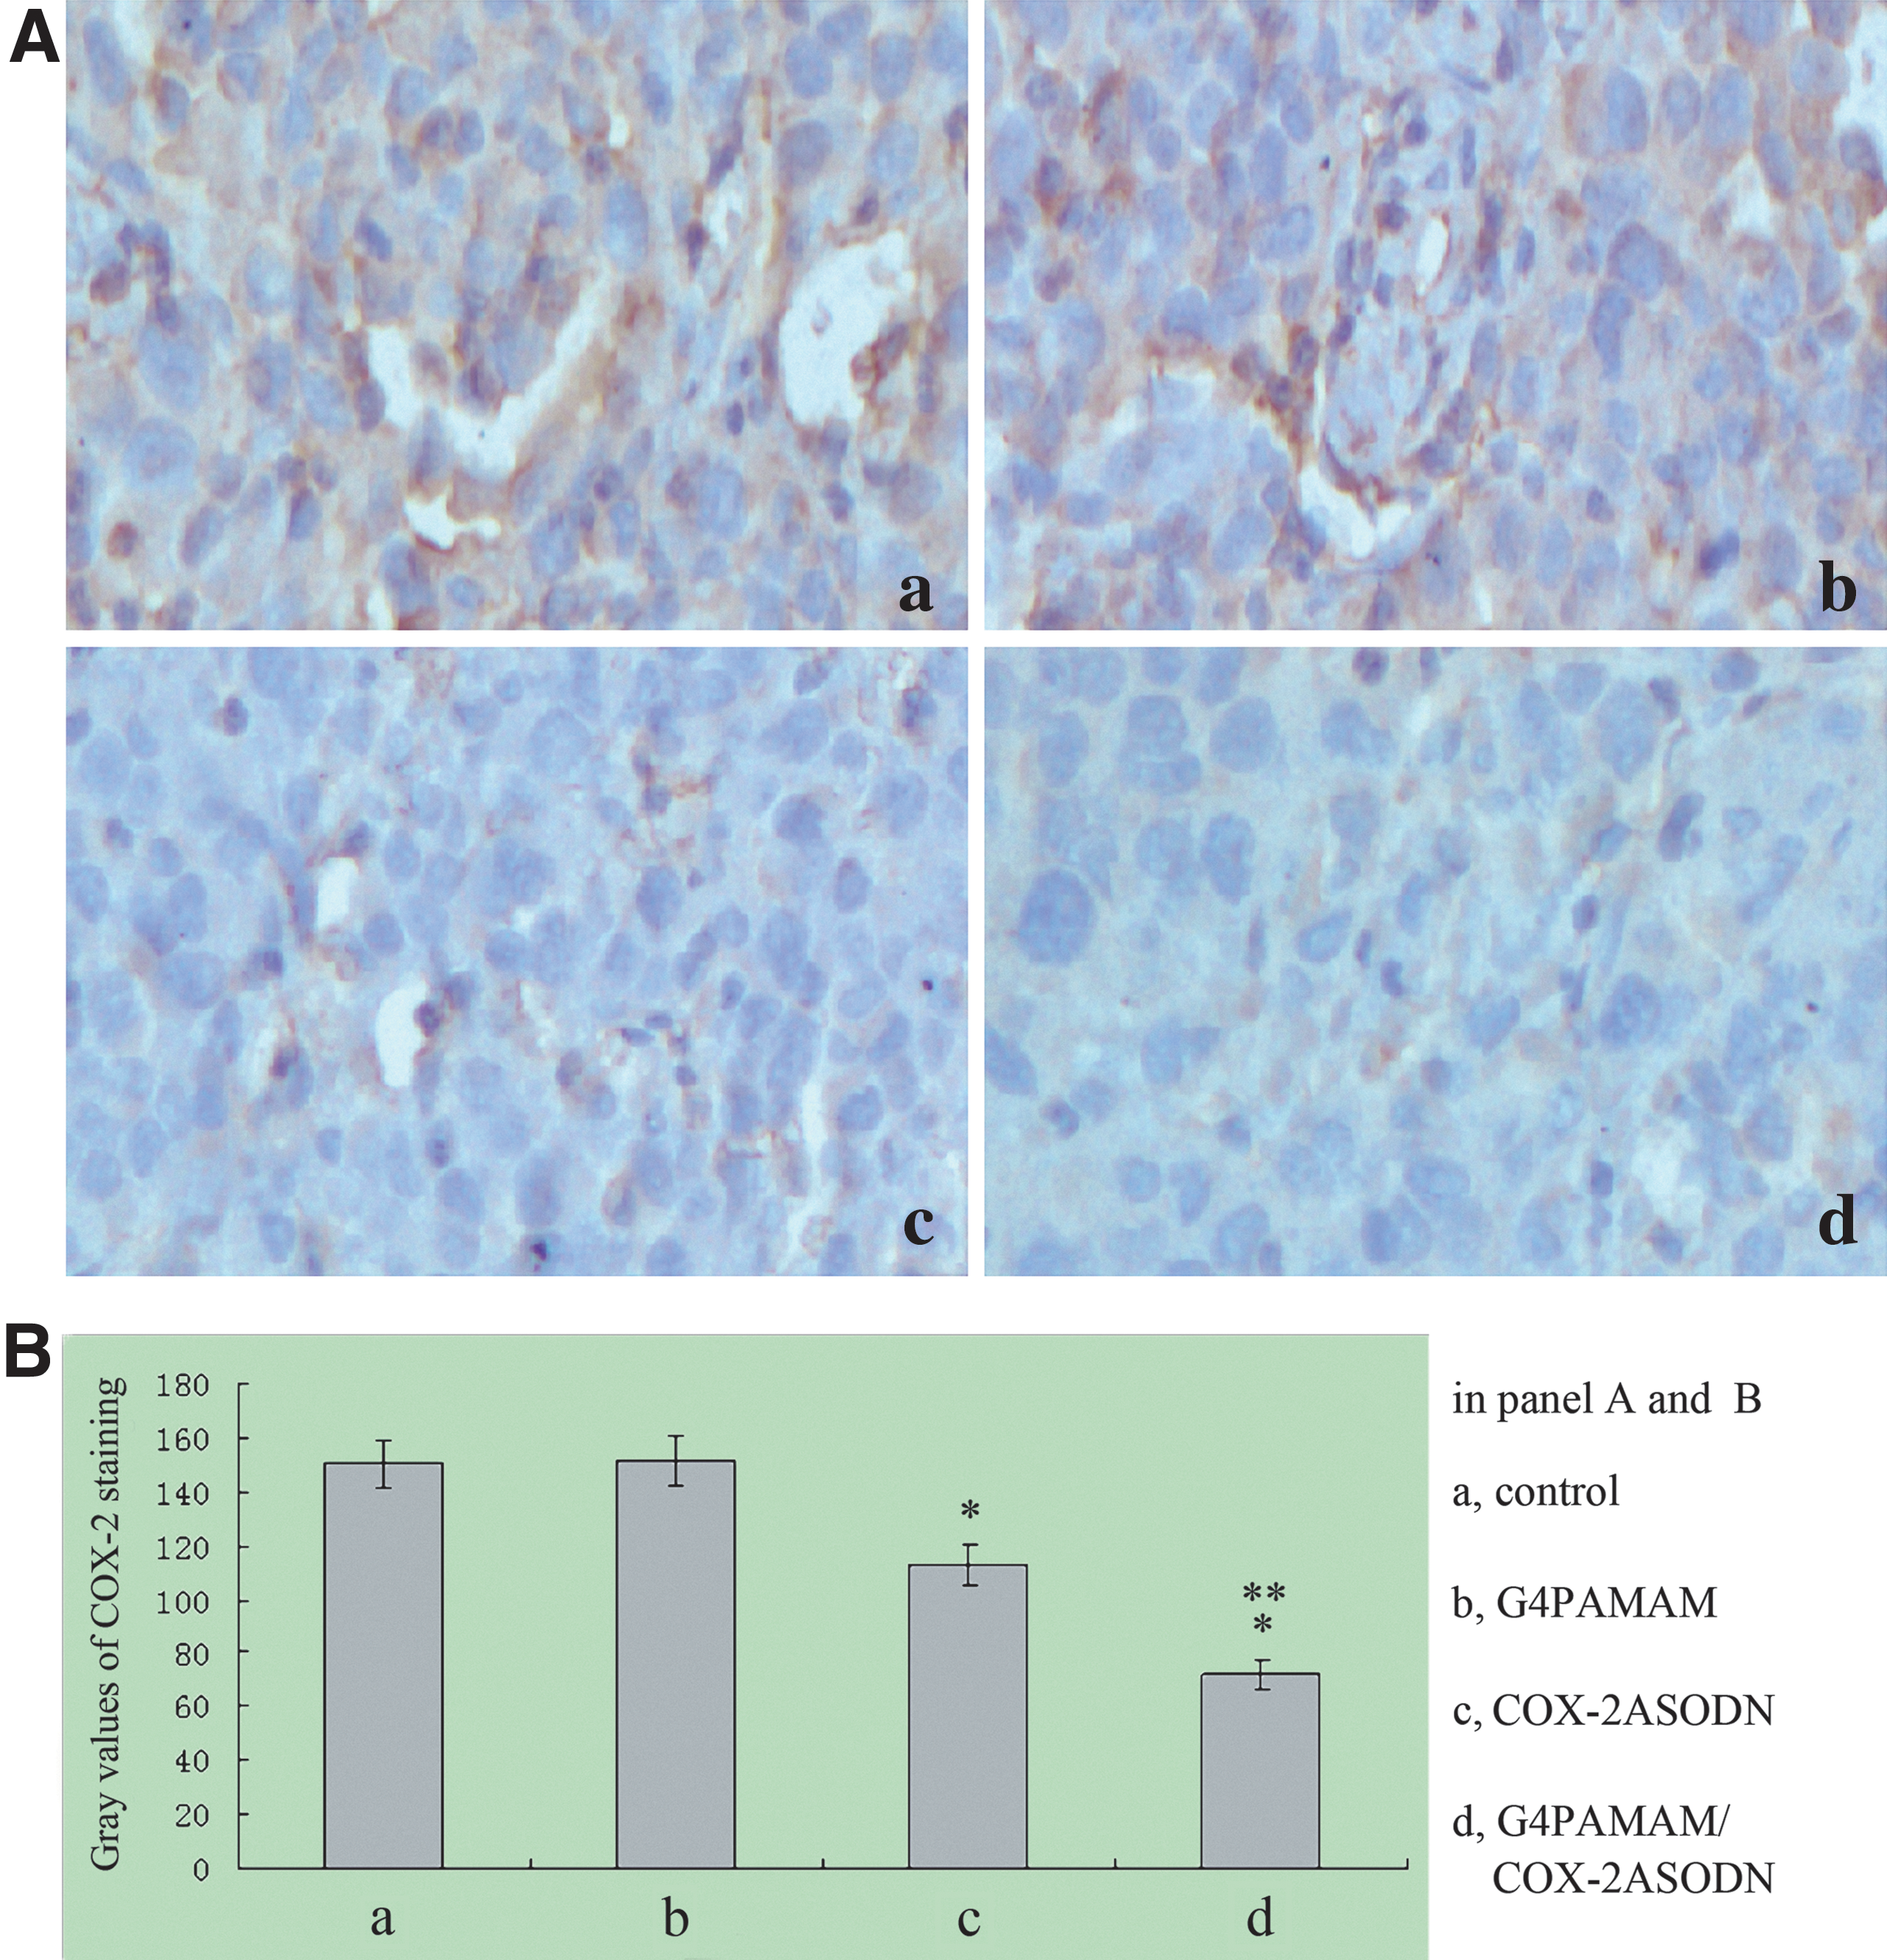
COX-2 protein expression detected by immunohistochemistry staining. The gray values of the COX-2ASODN group and the G4PAMAM/COX-2ASODN group were lower than those of the blank control group and the G4PAMAM group (p<0.05), and the gray value of the G4PAMAM/COX-2ASODN group was lower than that of the COX-2ASODN group (p=0.001). *p<0.05 vs control, **p=0.001 vs COX-2ASODN.
Western blot analysis was also performed to detect COX-2 protein expression (Fig. 8). The results showed that the expression of COX-2 protein of the COX-2ASODN group and the G4PAMAM/COX-2ASODN group was lower than that of the blank control group and the G4PAMAM group (p<0.05), and COX-2 protein of the G4PAMAM/COX-2ASODN group was lower than that of the COX-2ASODN group (p<0.05). These were in line with the results of IHC staining.
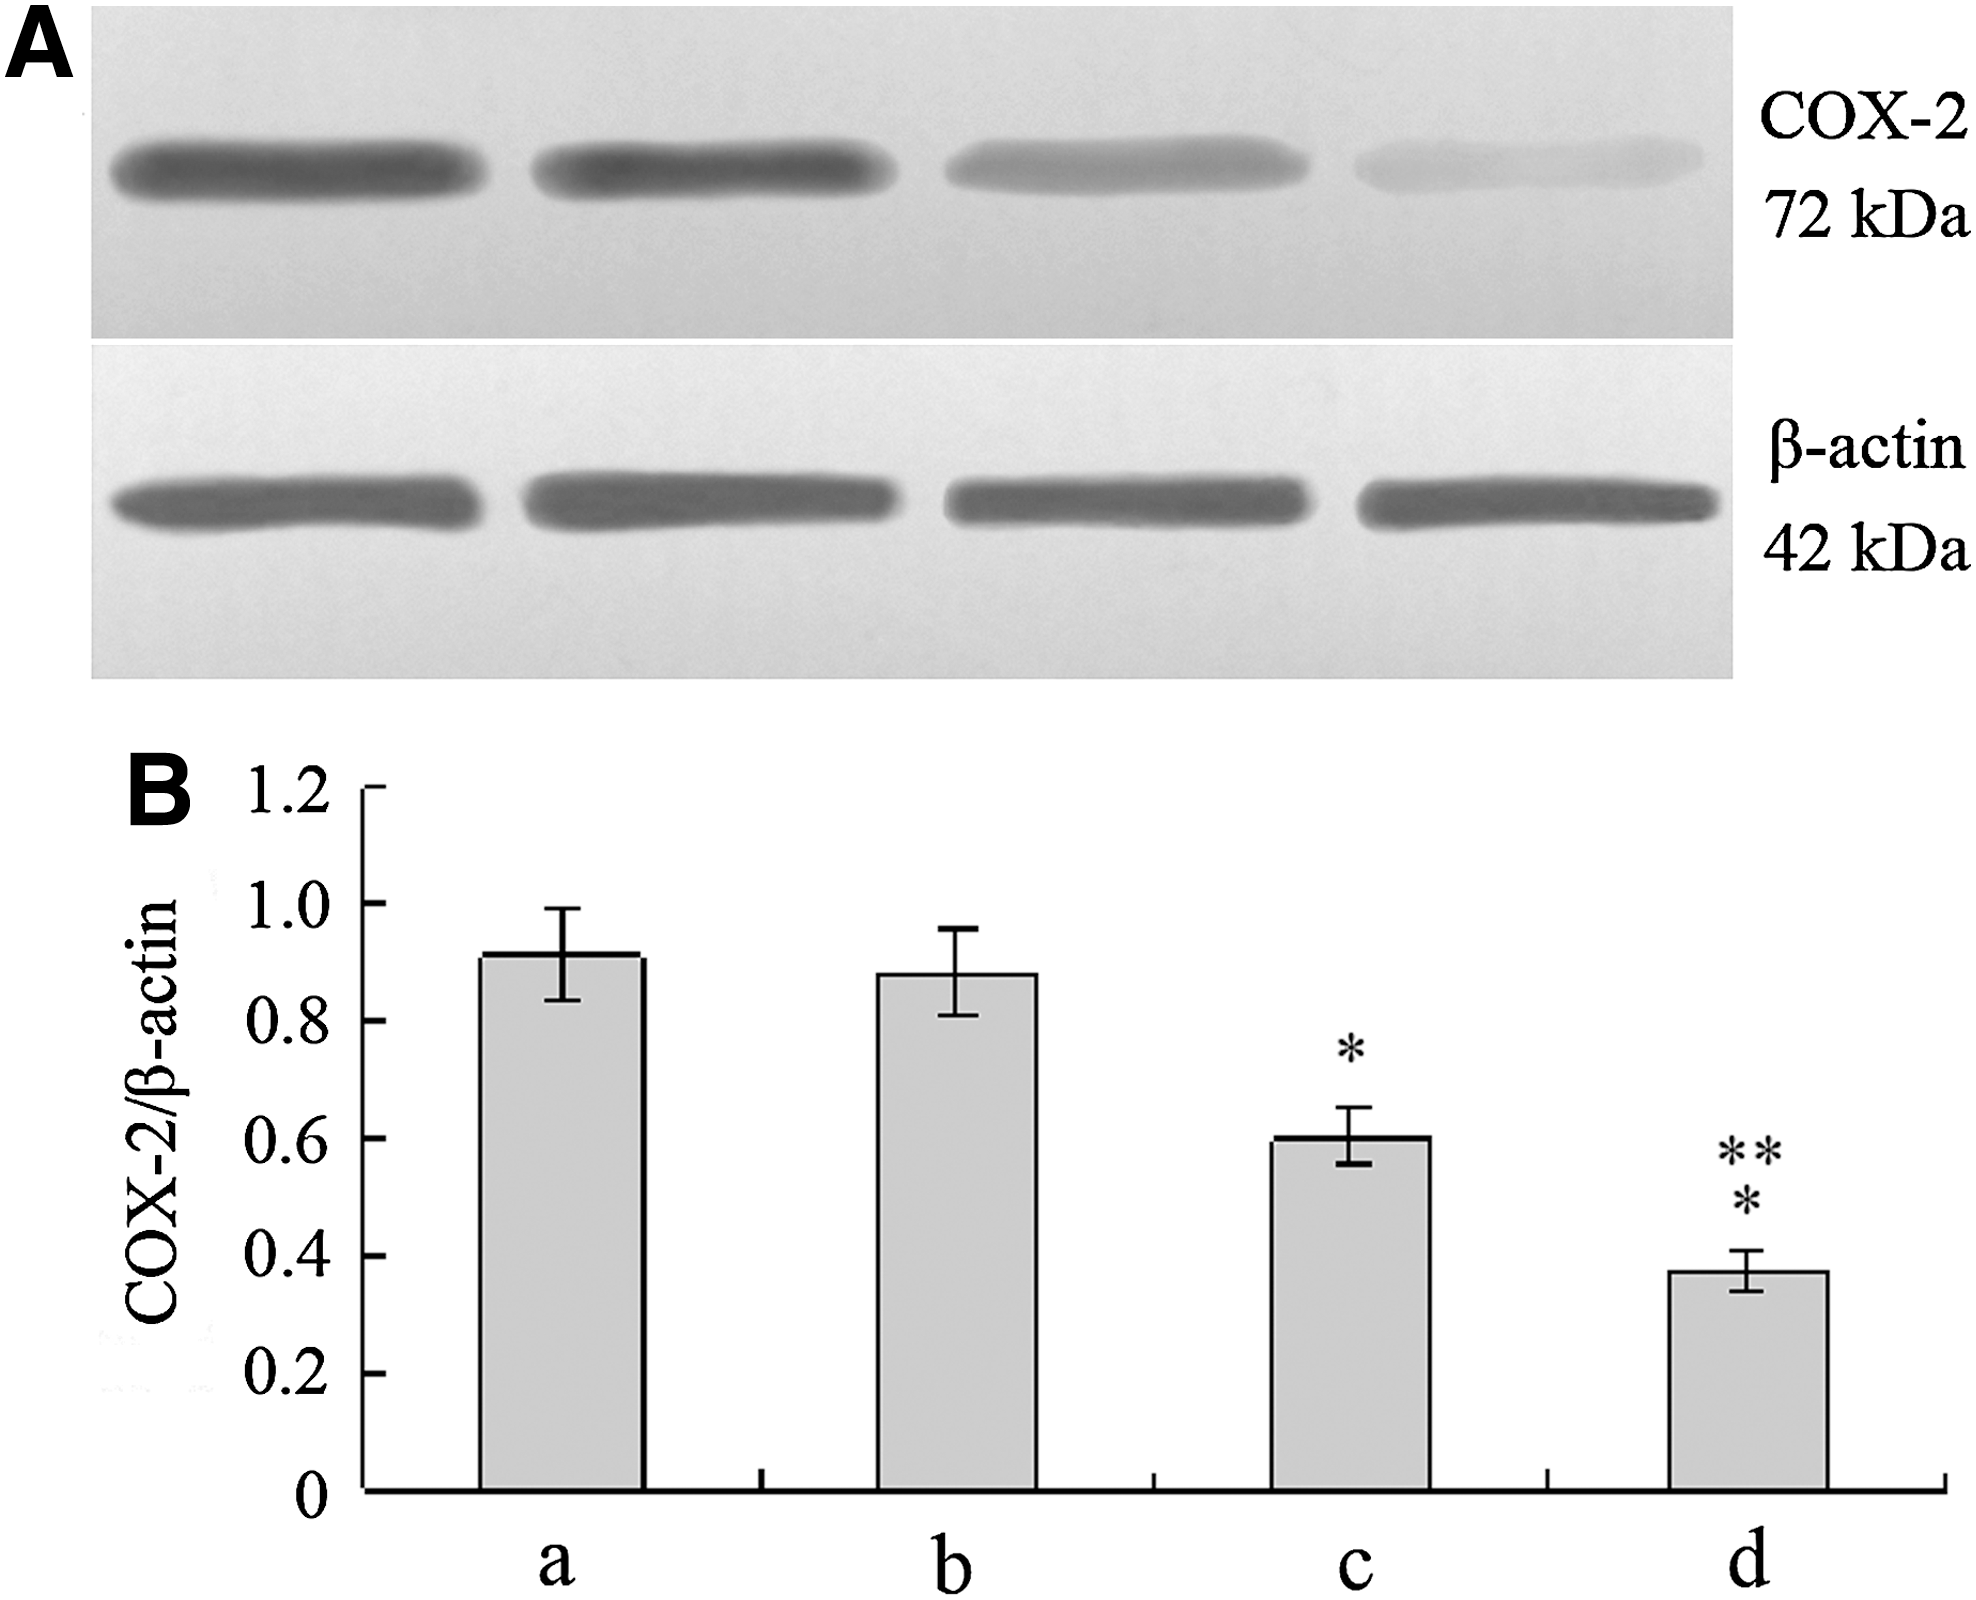
COX-2 protein expression detected by Western blot analysis. COX-2ASODN and G4PAMAM/COX-2ASODN showed significant inhibitory effects on the expression of COX-2 (p<0.05), and G4PAMAM/COX-2ASODN showed a stronger inhibitory effect than COX-2ASODN (p<0.05). *p<0.05 vs control, **p<0.05 vs COX-2ASODN. a, control group; b, G4PAMAM group; c, COX-2ASODN group; d, G4PAMAM/COX-2ASODN group.
MVD decreased by G4PAMAM/COX-2ASODN
The microvessel in tumor tissue of athymic mice was marked with CD34 by IHC staining and counted with a light microscope. Then the MVD of each tissue was determined (Fig. 9). The MVD of the COX-2ASODN group and the G4PAMAM/COX-2ASODN group was lower than that of the blank control group and the G4PAMAM group (p<0.05), and the MVD of the G4PAMAM/COX-2ASODN group was lower than that of the COX-2ASODN group (p=0.003).
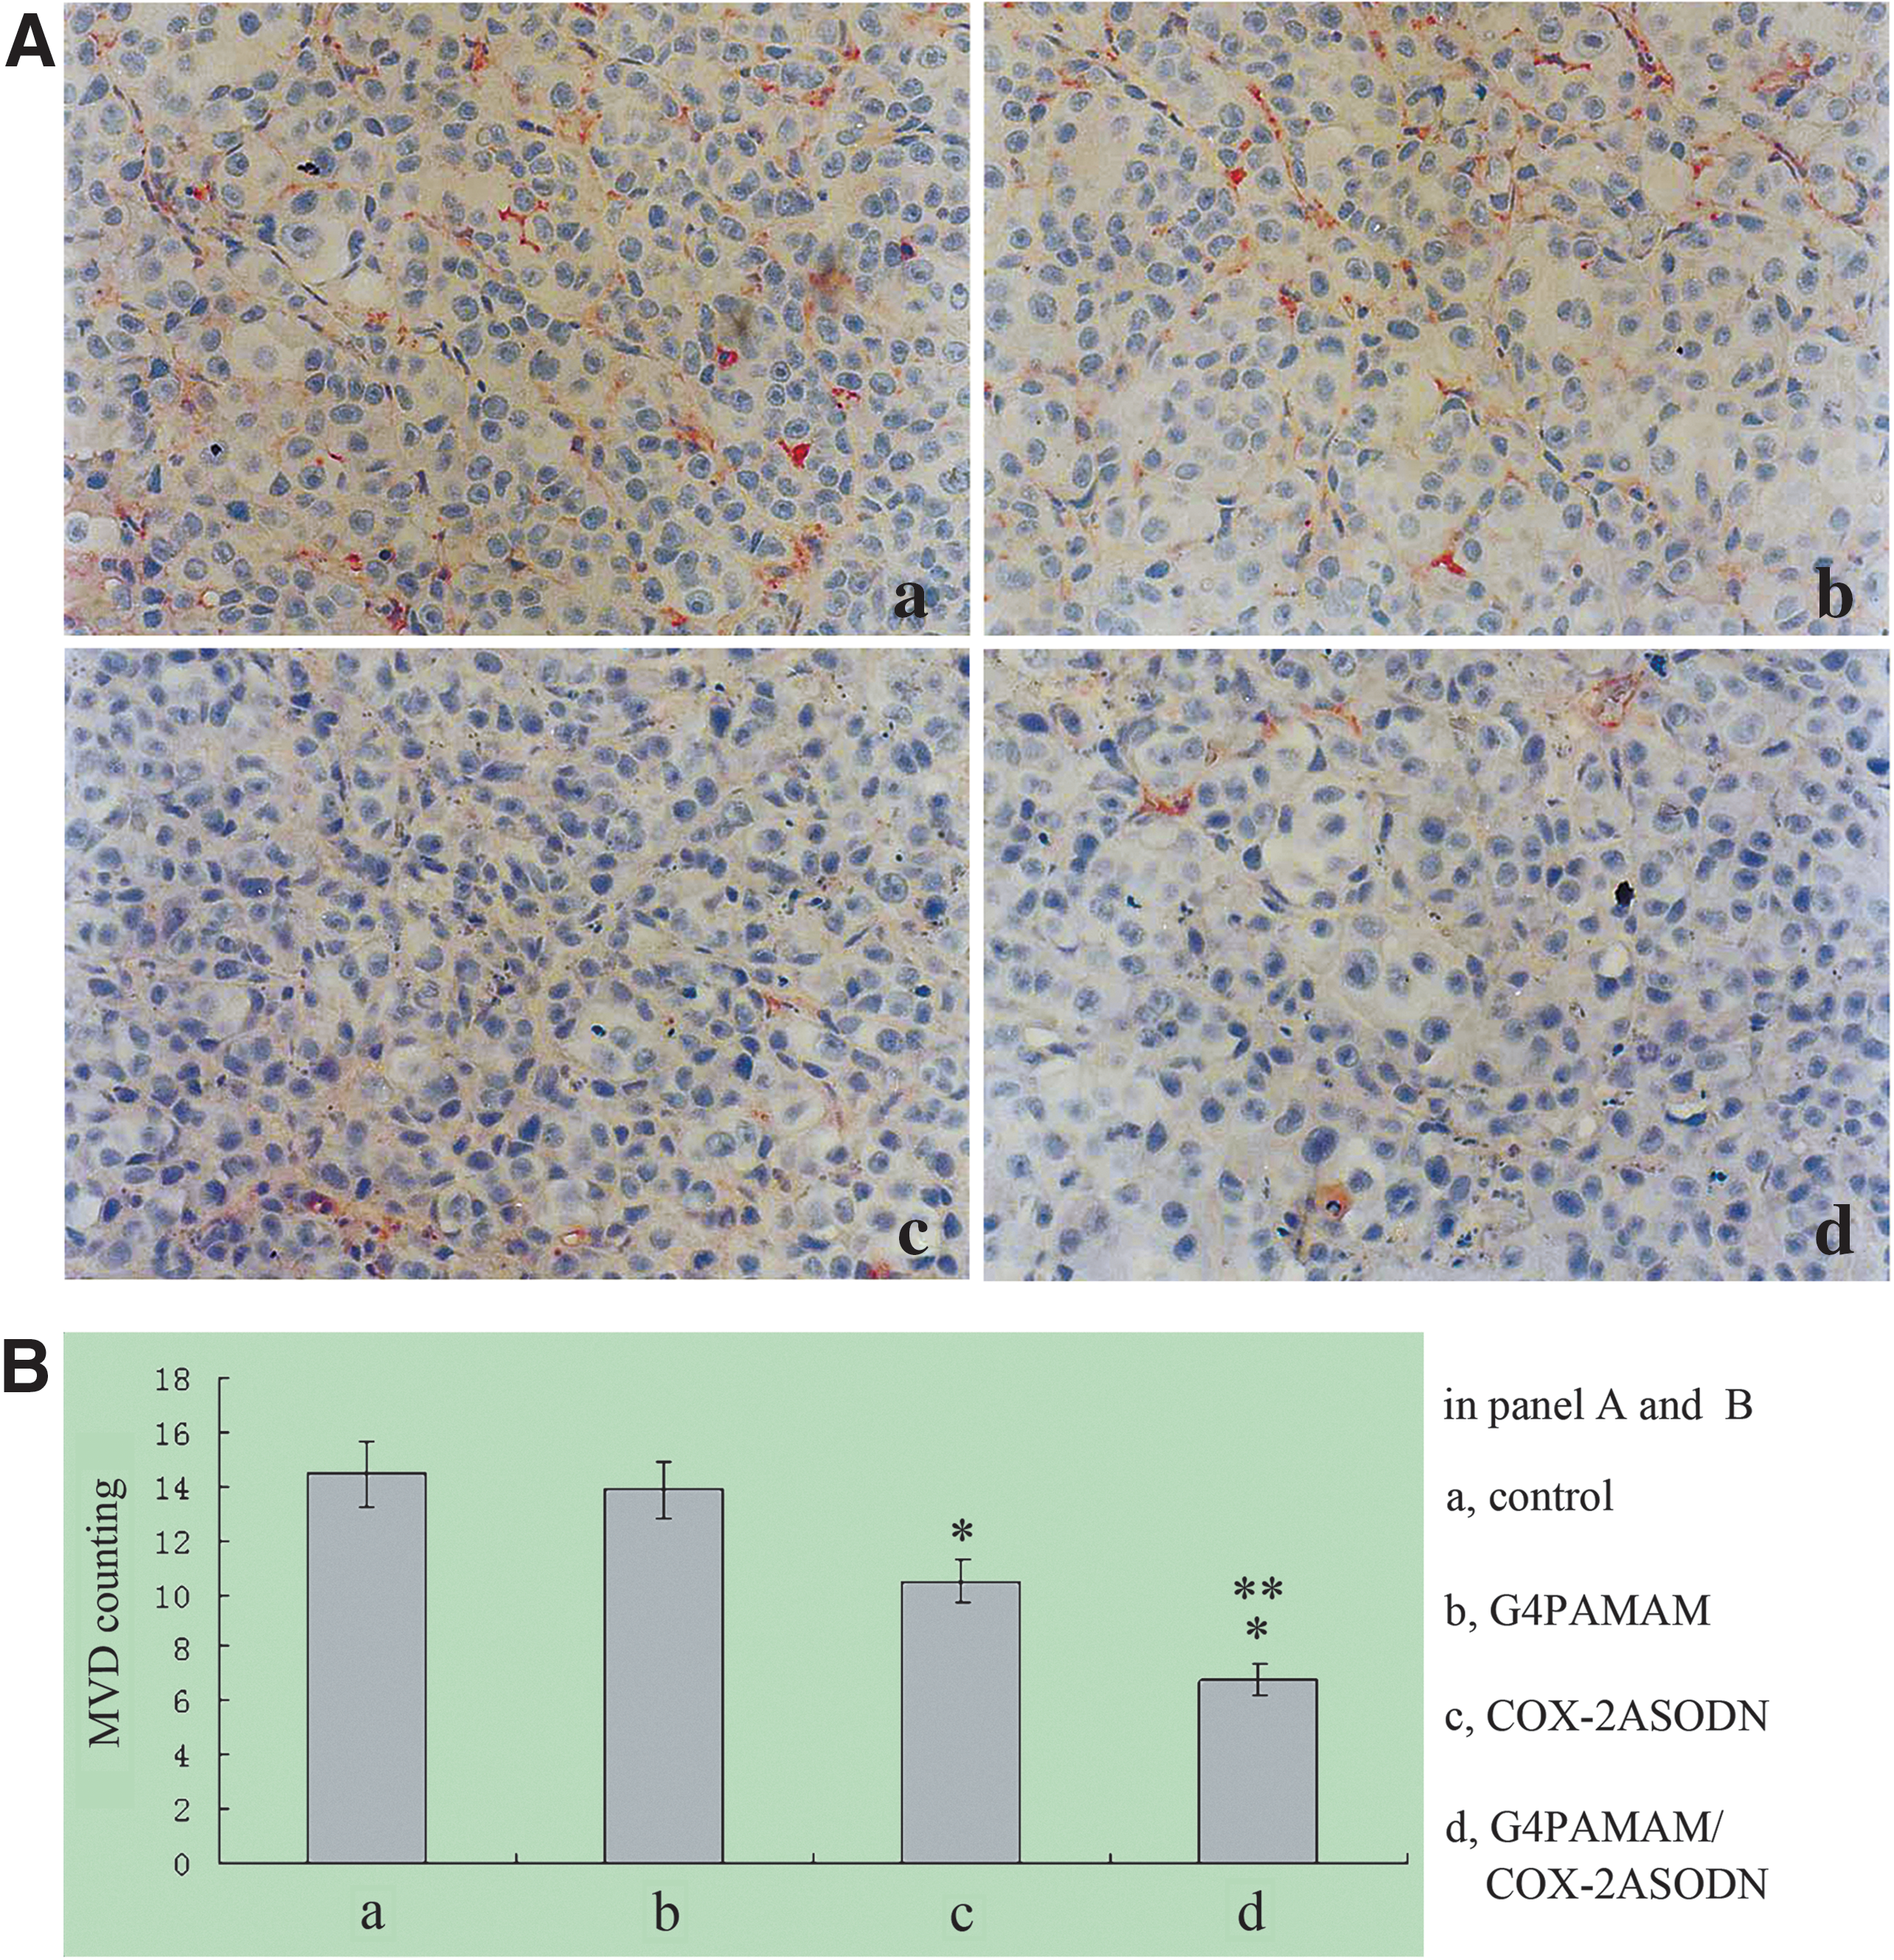
Microvessel density (MVD) counting. The MVD of the COX-2ASODN group and the G4PAMAM/COX-2ASODN group was lower than that of the blank control group and the G4PAMAM group (p<0.05), and the MVD of the G4PAMAM/COX-2ASODN group was lower than that of the COX-2ASODN group (p=0.003). *p<0.05 vs control, **p=0.003 vs COX-2ASODN.
Discussion
COX-2 plays critical roles in tumorigenesis and progression. Many observations have confirmed that the inhibition of COX-2 expression by COX-2 inhibitors can prevent tumorigenesis and slow tumor growth, 14 –17 but their undesirable side effects underscore the importance of searching alternative approaches that can inhibit COX-2 expression. In this context, inhibiting the expression of COX-2 by gene therapy has become popular and showed promising prospects. Loading capacity and the transfection efficiency of vectors play vital roles in gene therapy. In fact, scientists never stopped looking for effective gene delivery systems. PAMAM is a promising vehicle introduced in recent years.
In this study, we synthesized G4PAMAM/COX-2ASODN complex and evaluated its transfection efficacy in vitro. We found that COX-2ASODN was successfully transfected into MDA-MB-231 cells mediated by G4PAMAM dendrimers, and the highest transfection rate was observed at 24 hours. The transfection rate of 40:1 G4PAMAM/COX-2ASODN was higher than that of the other charge ratios of G4PAMAM/COX-2ASODN and liposome/COX-2ASODN, indicating that 40:1 was the most optimal charge ratio of G4PAMAM and COX-2ASODN. The enhanced transfection rate of nucleic acids through PAMAM can be attributed to the high ability to condense nucleic acids (because of high densities of periphery amines of the PAMAM molecule), multiple internalization routes, 38 and proton sponge effect of PAMAM. 39 The cellular uptake of COX-2ASODN decreased with time, which was perhaps because of the cellular metabolic mechanisms.
We then confirmed that G4PAMAM/COX-2ASODN could inhibit the growth of cultured human breast cancer MDA-MB-231 cells by MTT assay, and 40:1 G4PAMAM/COX-2ASODN had the best inhibitory effect. The in vitro experiments showed that COX-2ASODN could be delivered into cultured cells efficiently by G4PAMAM and could inhibit cell viability. The latter result is in contrast to that of the study carried out by Denkert and associates, 40 which claimed that even almost complete inhibition of COX-2 expression in ovarian carcinoma cells by siRNA directed against COX-2 mRNA did not result in any effect on the proliferation of these cells. A probable explanation for this discrepancy is that COX-2 plays less important roles in some cancer cell lines despite a higher COX-2 expression. This provides further evidence for the fact that cancer is a multifactorial disease.
To elucidate the mechanism underlying the antiproliferation ability of G4PAMAM/COX-2ASODN complex, we performed FCM analysis and observed an increase of apoptosis and G0/G1 cell cycle arrest. These results indicate that the antiproliferative effect of G4PAMAM/COX-2ASODN is related to the induction of apoptosis and G0/G1 cell cycle arrest.
We also performed Matrigel invasion assays and observed that the invasiveness of breast cancer cells was suppressed by G4PAMAM/COX-2ASODN. This suppressed invasiveness was partially recovered in the presence of 10 μg/mL of exogenous PGE2. Together, the inhibition of cell invasiveness is related, at least in part, to the down-regulated expression of prostaglandins caused by a decline of COX-2 enzyme activity.
To further investigate the in vivo effects of G4PAMAM/COX-2ASODN on tumor, we first established the mouse tumor xenograft model of human breast cancer, MDA-MB-231; then we gave different interventions with intraperitoneal injection and monitored the tumor growth in mice; and finally, we detected COX-2 mRNA and COX-2 protein expression and MVD level of transplanted tumor tissue. We found that tumor growth was slowed after the transfection of COX-2ASODN through G4PAMAM dendrimers. We also observed that the expression of COX-2 mRNA and COX-2 protein and the MVD of tumor tissue decreased. The precise mechanisms of action by which ASODNs suppress the expression of target mRNA remain unclear.
Two major mechanisms are widely accepted. One is that most ASODNs are designed to activate RNase H, which specifically cleaves the RNA strand of a DNA/RNA heteroduplex and therefore leads to the degradation of the target mRNA. 41 The other is that ASODNs sterically block the binding of translation factors and modulators and impede the movement of the ribosome along the mRNA strand. 42,43 These results are in line with those of the previous studies that, after administration of COX-2 inhibitors, COX-2ASODNs, or antisense COX-2 transfectants, a reduction of COX-2 expression, MVD, and tumor growth was observed. 14,16,44,45 From these results, it can be inferred that the in vivo antitumor effects were caused by the inhibition of COX-2 expression and the subsequent antiproliferation and antiangiogenesis effects.
We have not observed the adverse effects of G4PAMAM/COX-2ASODN on the structure and function of normal tissue in long-term application because of the short experimental span. The effects of G4PAMAM/COX-2ASODN in combination with chemotherapy or radiotherapy need further studies. Whether unspecific effects independent of the antisense inhibitory mechanism exist also needs to be further clarified.
Conclusions
We provide a new strategy for gene therapy targeting COX-2. We synthesized G4PAMAM/COX-2ASODN complex for the first time and authenticated its antitumor effect in vitro and in vivo. G4PAMAM can be used to serve as a surrogate for traditional gene delivery vehicles.
Footnotes
Acknowledgment
This work was supported by the grant from National Natural Science Foundation of China (No. 30572140).
Disclosure Statement
No competing financial interests exist.