
Abstract
Introduction:
Osteosarcoma (OS) management requires a better understanding of tumor/bone interactions in vivo during disease progression. Using [18F]-FDG and [99mTc]-HMDP imaging, we assessed a methodology for an in vivo quantitative characterization of an orthotopic model of osteolytic OS on the basis of (1) tumor proliferation, (2) tumor and bone metabolic activities, and (3) bone remodeling.
Methods:
POS-1 tumor bearing mice were monitored in vivo over a 26-day period, with tumor and bone metabolic volumes (TMV and BMV, respectively) being determined from [18F]-FDG, bone remodeling from [99mTc]-HMDP, and tumoral volume from micro- computed tomography scans.
Results:
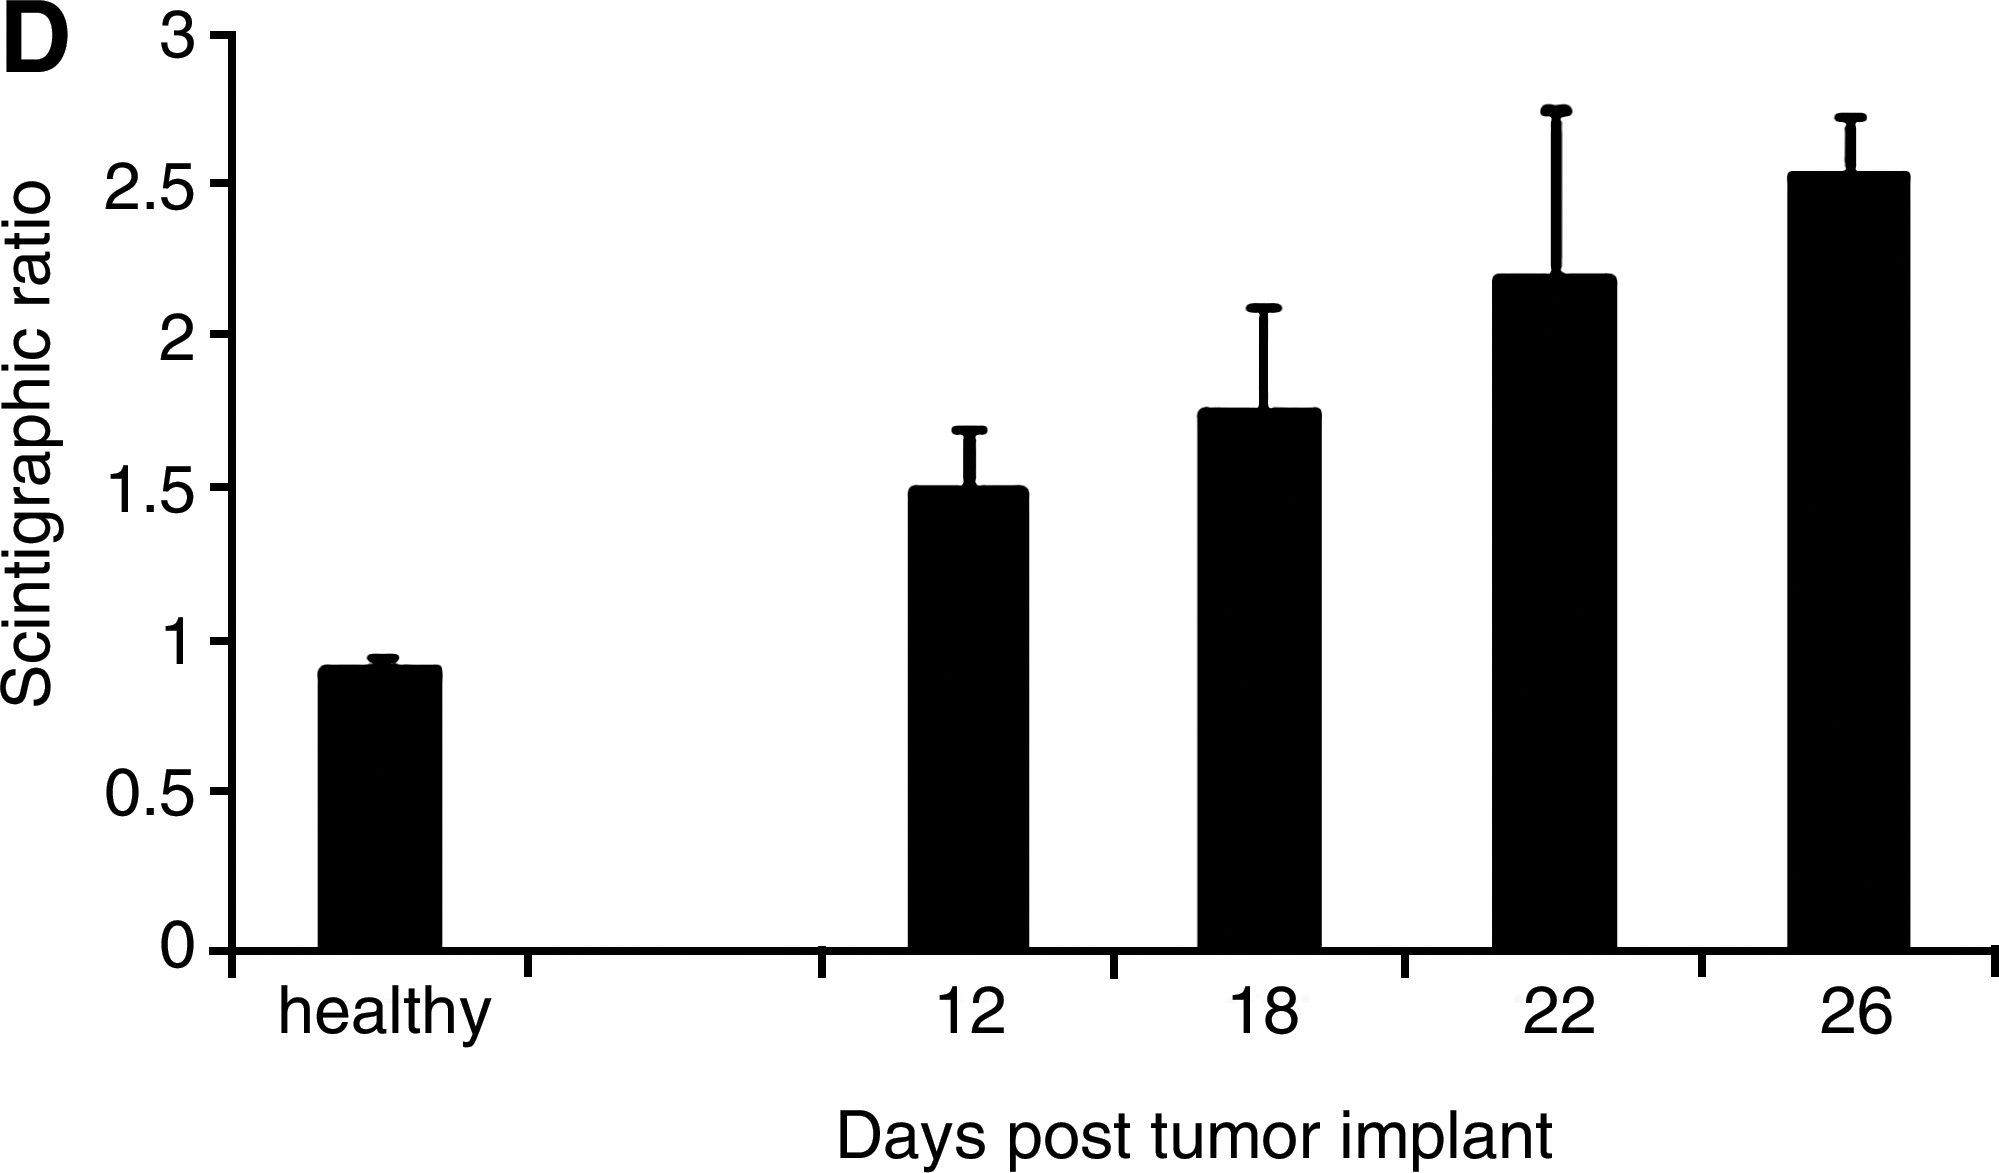
From day 10, [18F]-FDG strongly accumulated within POS-1 tumor, with a tumor/muscle ratio of 3.7±0.8. TMV and BMV increased as pathology progressed: TMV increased at early stage of pathology (from 56%) whereas BMV strongly increased (from 113%) during late stage. From [99mTc]-HMDP imaging, bone remodeling features were evidenced within the distal region of tibia bearing the tumor, with a mean scintigraphic ratio of 1.36±0.11 at day 12, that reached value of 2.53±0.19 at day 26.
Conclusions:
Our results validated the POS-1 orthotopic model as “OS imaging model,” that could serve for evaluating in vivo therapies targeting tumor proliferation and/or bone remodeling in OS.
Introduction
Osteosarcoma (OS) is the most common primary malignant bone tumor in both children and young adults, with no improvement in the survival rates being recorded for two decades. 1 Primary tumor development in bone sites is known to be related to the existence of a vicious cycle between bone resorption and tumor proliferation, as also reported for secondary bone tumors. 2 –5
To date, a better understanding of tumor/bone interactions appears of real need for the development of new therapeutic strategies in musculoskeletal oncology. In vitro models are essential for a better understanding of OS biology at the molecular level but they do not take into account the interactions between tumor and its bone microenvironment. Considering that some biomarkers are known to be only expressed when tumor cells are inoculated in vivo, there is a need for reliable and reproducible in vivo animal models that mimic all aspects of the human condition at the temporal, physiological, and histopathological levels (i.e., expression of appropriate biomarkers, presence of an extensive vasculature, production of osteoid matrix). 6 –8
The management of lesions (osteolysis and bone remodeling) associated with OS remains a priority in musculoskeletal oncology and it appears from preclinical studies, that the antibone resorption strategy could be one of the most promising perspectives. 9 –11 Demonstrating the “proof of concept” of these new targeted therapies, ideally requires the assessment of tumor cell proliferation, osteolysis, and bone remodeling, simultaneously in the same animals in vivo. This implies that ideal OS models should grow at the orthotopic site, to reproduce the multiple interactions between tumor cells and bone cells, which appear as strategic checkpoint in the clinical situation. 8 This also implies that pathophysiological features associated to OS progression could be simultaneously quantified and monitored in vivo in the same animals.
In such a context, this study aimed to perform an in vivo and real time quantitative imaging characterization (by combining [18F]-FDG, [99mTc]-HMDP and micro-computed tomography [micro-CT] imaging) of the relationships between tumor cell proliferation and bone changes associated with the growth of an osteolytic murine model of OS. For this purpose, we chose the syngeneic orthotopic POS-1 osteolytic model, which has been recently demonstrated to respond to antibone resorption strategies. 1,10,11
Materials and Methods
Cell line
The POS-1 model was kindly provided by the Kanagawa Cancer Center (Dr. A. Kamijo, Kanagawa, Japan).
12
Cells were cultured in RPMI-1640 medium (Bio Whittaker) with 10% fetal bovine serum and 2 mM
Animals and OS model
Twenty-two male C3H/HeNRj mice (Janvier) were handled under pathogen-free conditions in accordance with European Directive 86/809/EEC. Protocols were performed under the supervision of authorized investigators in accordance with the institution's recommendations and with the guidelines for the welfare and use of animals in cancer research. 13 For tumor transplantation, anesthetized mice (inhalation of 1.5%, 1 L/min isoflurane/air associated with buprenorphine 0.05 mg/kg; Temgesic®, Schering-Plough) were inoculated with 2×10⁶ POS-1 cells in the hindpaw footpad. Within 3 weeks, the mice develop a primary tumor at the injection site that can be transplanted to mice of the same strain as a small fragment (2×2×2 mm3) in close contact with the tibia, as previously reported. 6,7 For this purpose, the periosteum of the diaphysis was opened and resected along a 5 mm length, leaving underlying bone intact. The OS fragment was placed contiguous to the exposed bone surface without periosteum, and cutaneous and muscular wounds were sutured.
Anesthesia for imaging
For all imaging procedures, ketamine (Imalgène® 500; Rhone Mérieux) and xylazine (Rompun® 2%; Bayer) (4:1 ratio) were used by intraperitoneal route (40 μL/20 g mouse).
Micro-CT imaging: tumor volume determination
For each animal, micro-CT (eXplore CT 120®; GE Healthcare) examinations were performed at day 10, 15, and 25 postimplant. Acquisition consisted of 220 views acquired in 0.877° increments collected in one full gantry rotation, with a 32 ms exposure/view and X-ray tube settings being 70 kV and 50 mA. Images were analyzed using MicroView analysis+version 2.2 software (GE Healthcare). Tumor volume was determined from volume of interest (VOI) obtained by both thresholding procedure and manual segmentation.
Data were averaged and expressed as mean±SD. The mean tumor volume value determined on day 10 was used as the reference value and was compared with the mean values determined at the others time points of study (paired two-sided Student's t-test with a level of significance set at p<0.05).
Micro-CT imaging: bone mineral density determination
At the late stage of study day 25, bone mineral density (BMD) was determined for both the tumor-bearing and contralateral tibias, with calibration being performed with a bone mimic phantom (SB3; Gamex RMI). Acquisition consisted of 360 views acquired in 1°increments collected in one full gantry rotation, with a 20 ms exposure/view and X-ray tube settings being 100 kV and 50 mA. CT images were reconstructed using a modified conebeam algorithm with an isotropic voxel of 0.045×0.045×0.045 mm3. Images were analyzed using MicroView analysis+version 2.2 software (GE Healthcare). Trabecular bone of the distal tibia was selected by fitting a cylindrical region within distal tibia and BMD was estimated as the mean converted gray-scale level within the region of interest.
To obtain reference values in healthy animals, three additional healthy mice were successively scanned three times over a short period (9 days). Each scan was analyzed as described above and BMD ratio (BMDR) calculated as:
BMDR=BMD of right tibia/BMD of left tibia.
Data were averaged and expressed as the mean±SD.
For healthy group, BMDR reproducibility was assessed by calculating the coefficient of variation according to the formulae: CV (%)=SD/mean×100. Reproducibility coefficient was calculated as R=100−CV.
For each POS-1 tumor bearing animal, a BMDR was determined as follows:
BMDR=BMD of tumor-bearing tibia/BMD of contralateral tibia
Data were averaged and expressed as the mean±SD.
The mean BMDR values determined for tumor-bearing group was compared with the mean BMDR value of healthy group (Student t test with a level of significance set at p<0.05).
[18F]-FDG PET imaging
For each animal, PET (eXplore VISTA®; GE Healthcare) examinations were performed at day 10, 15, and 25 postimplant. Images were acquired 40 minutes after i.v. administration of [18F]-FDG (GLUCOTEP®; Cyclopharma Laboratories) (9.25 MBq/mouse) for a total acquisition time of 20 minutes, and an energy window set at 250–700 keV. Image reconstruction used an ordered-subset expectation maximization (FORE/2D OSEM) method including corrections for radioactive decay, scanner dead time, and scattered radiation. Scans were analyzed for metabolic volume determination using eXplore VISTA workspace. The tumor metabolic volume (TMV) was determined from a VOI obtained by summing multiple two-dimensional regions-of-interest from consecutive tomographic planes encompassing the entire uptake volume. When a “hot” pattern was observed within the tumor-bearing tibia, bone metabolic volume (BMV) was also determined, as described above. At each time point, TMV and BMV parameters were averaged, respectively, and data expressed as the mean±SD. The mean values determined on day 10 was used as the reference value and was compared with the mean values determined at other time (paired two-sided Student's t-test test with a level of significance set at p<0.05).
For coregistration with the PET dataset, the mice were transported immediately after PET acquisition to the micro-CT equipment while still fixed to their bed. For fusion, fiducial markers placed close to the mice were aligned using AMIDE software. 14
[99mTc]-HMDP bone gamma scintigraphy
Since 99mTc-HMDP is known to be taken up by bone tissues under physiological situations, additional healthy mice (n=3) were successively submitted to bone scintigraphy, three times over a short period (9 days). Acquisition was performed 2 hours after i.v. injection of [99mTc]-HMDP (Osteocis®; IBA) (30 MBq/mouse), using a dedicated small animal gamma camera (Gammaimager®; Biospace Mesures). Whole body images were obtained from 10-min List mode acquisition, with a 15% window set at 140-keV. Image processing was performed using Gammavision+ software (Biospace Mesures), with two identical fixed-sized rectangular ROI being delineated over the right and left paws, respectively.
For each animal and for each examination, scintigraphic ratio (SR) was calculated as follows:
SR=average counts in right paw/average counts in left paw
SR parameters were averaged and data expressed as the mean±SD.
For healthy group, SR reproducibility was assessed by calculating the coefficient of variation according to the formulae: CV (%)=SD/mean×100.
Reproducibility coefficient was calculated as R=100−CV.
For each of the POS-1 tumor animals, bone scintigraphy (Gammaimager; Biospace Mesures) was performed at day 12, 18, 22, and 26 postimplant. Whole body Images were acquired 2 hours after i.v. injection of [99mTc]-HMDP (Osteocis; IBA) (30 MBq/mouse) as described above. Image processing was performed using Gammavision+ software (Biospace Mesures), with two identical fixed-sized rectangular ROI being delineated over the tumor-bearing and contralateral paws, respectively.
For each animal and for each time point, SR was calculated as follows:
SR=average counts in tumor-bearing paw/average counts in contralateral paw
SR parameters were averaged within each group at each time point. Data were expressed as mean±SD.
Two analyses were performed:
First, the mean SR values determined at each time point for tumor-bearing group was compared with the mean SR value of healthy group (Student's t-test with a level of significance set at p<0.05).
Second, for the tumor-bearing group, the mean value determined on day 12 was used as the reference value and was compared with the mean values determined at other times (paired two-sided Student's t-test with a level of significance set at p<0.05).
Histology
At study end point and for each animal, tumor-bearing paws were removed, fixed in 10% buffered formalin and decalcified in 10% EDTA. Samples were then embedded in paraffin and cut into 4-μm sections stained with hematoxylin–eosin.
Results
Incidence of tumor implant
Ninety-one percent of mice transplanted with POS-1 tumor fragment in close contact to the right tibia after periosteum resection developed OS
Quantitative study of tumor progression by micro-CT imaging
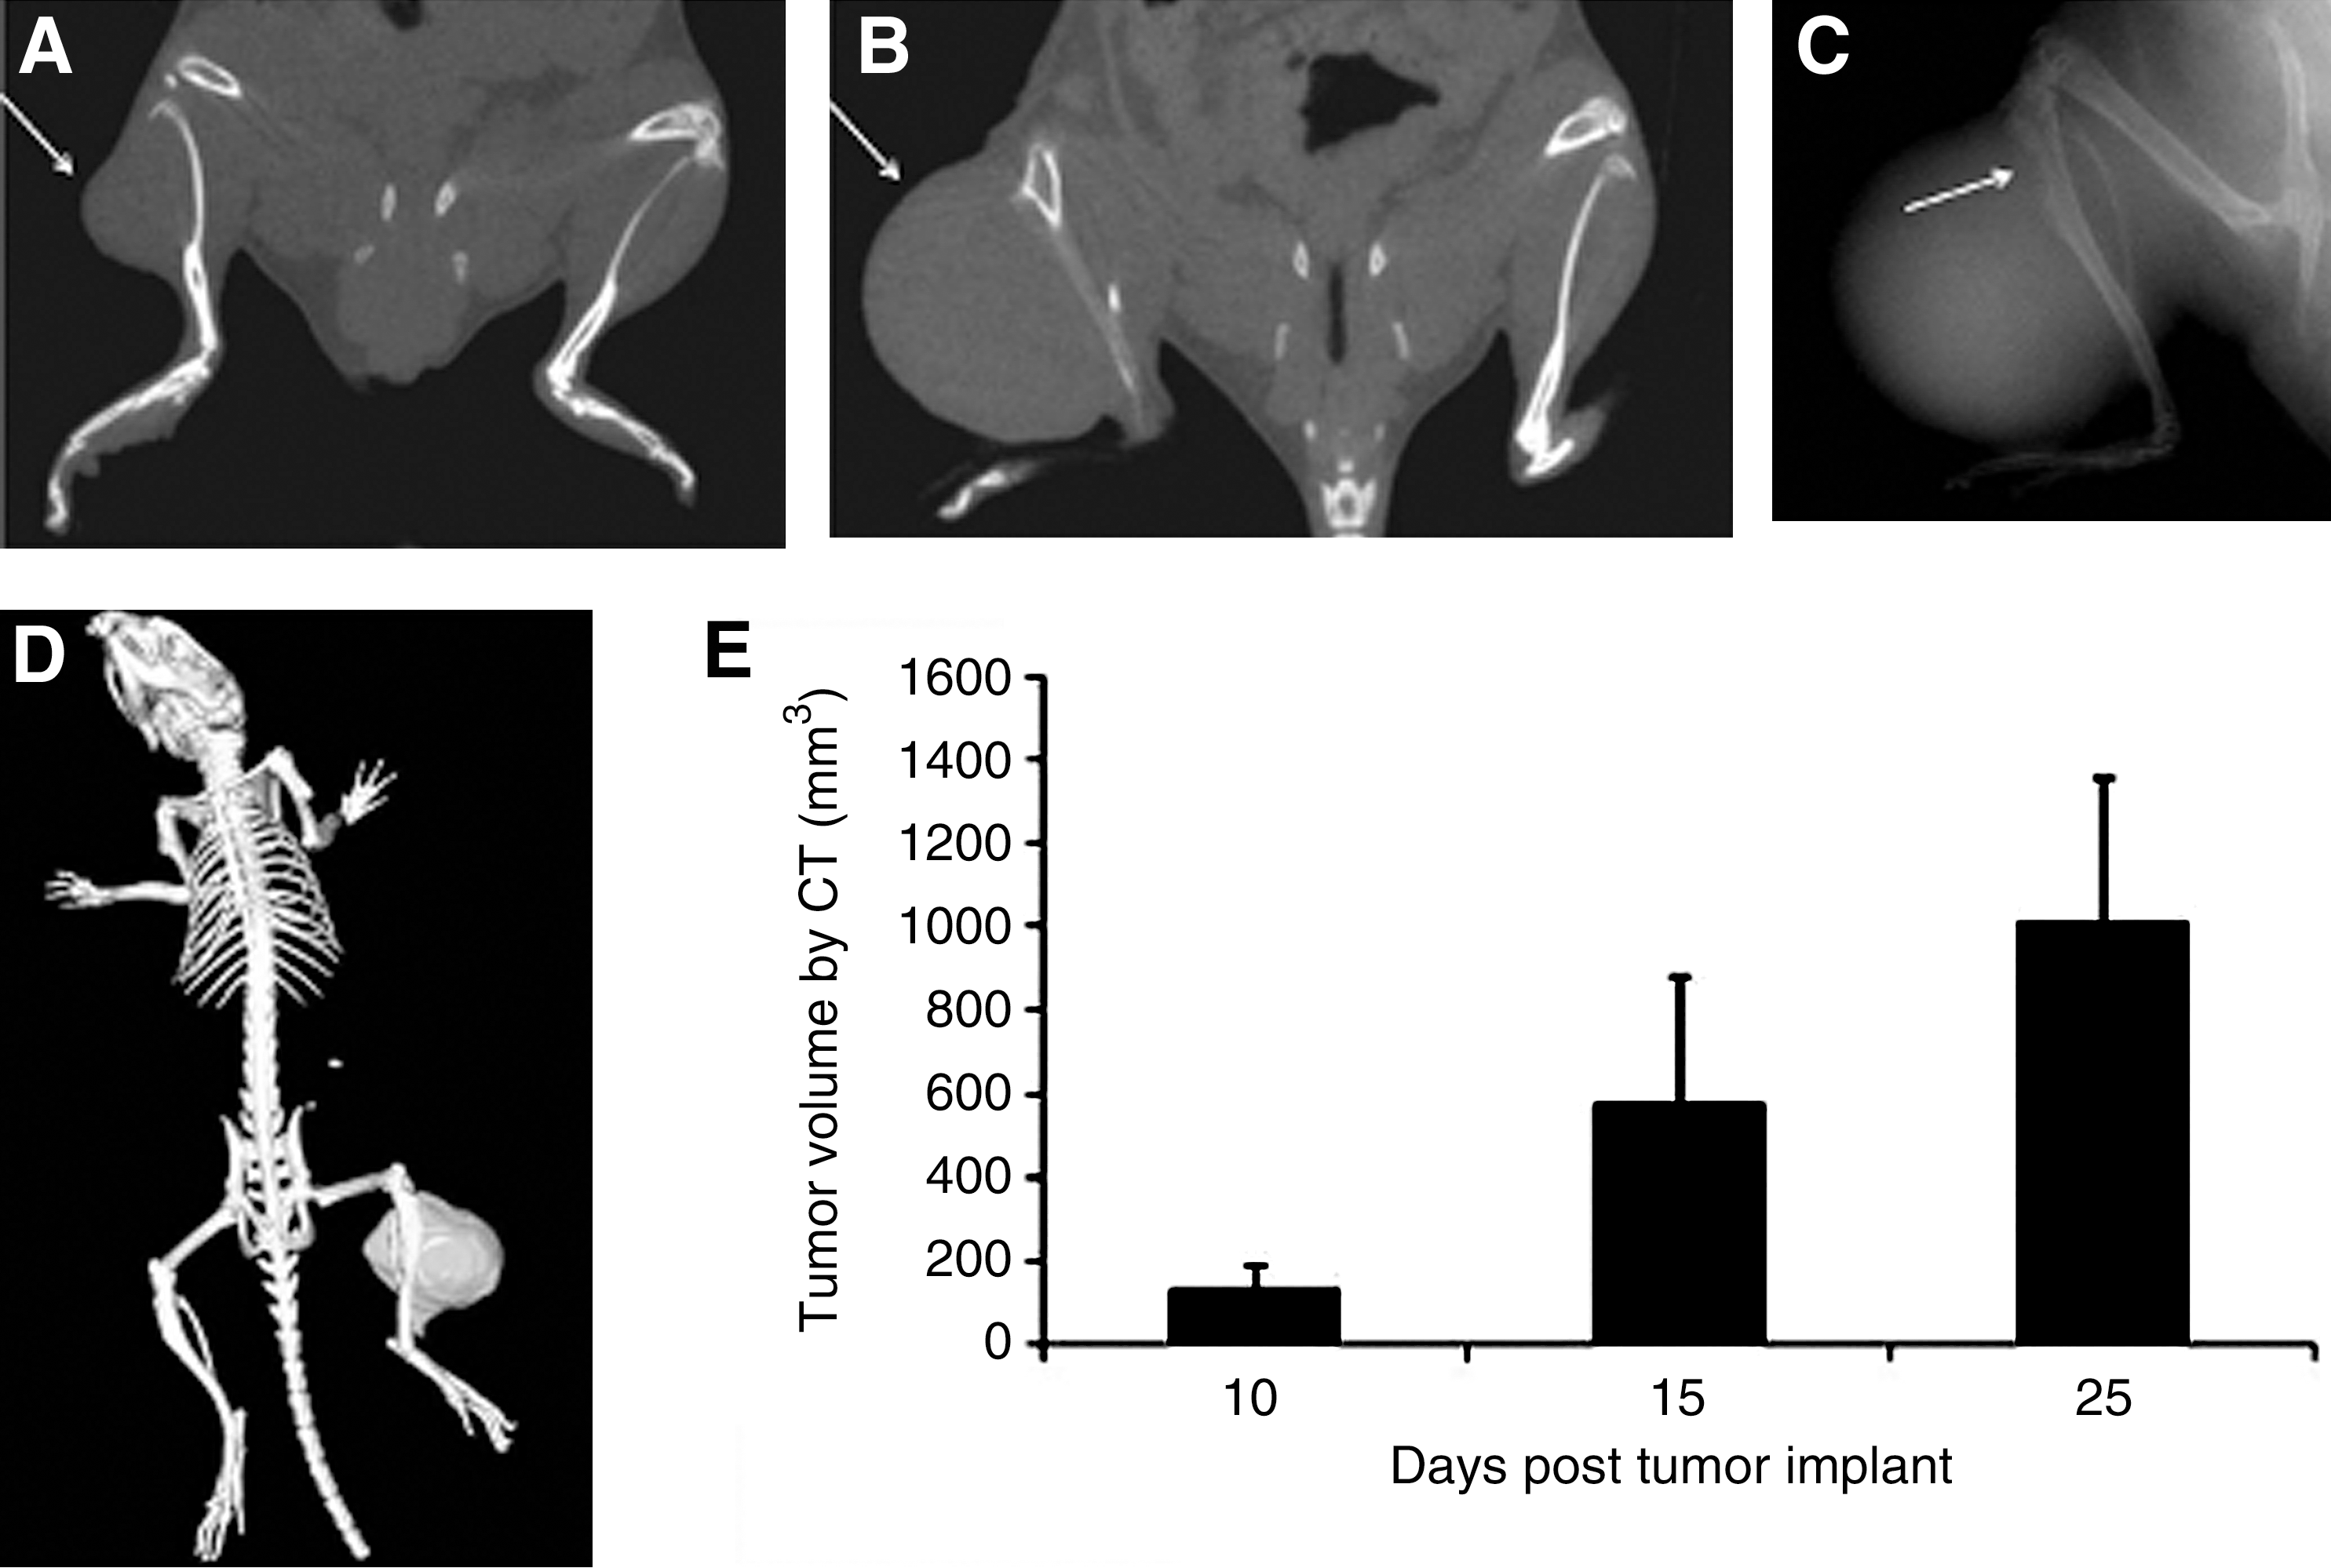
At the first time point examined (day 10 postimplant), and for all the animals that developed tumors, OS burden was easily distinguished on coronal CT views (Fig. 1A). CT scans of the same animals at the late stage of study day 25 (Fig. 1B) evidenced an increase in tumor size.
Coronal computed tomography (CT) views of posterior paws of POS-1-bearing mice at day 10
Using surface rendering analysis and a global thresholding procedure, CT imaging was able to spatially separate bone from underlying soft tumoral tissues: This allowed a clear and accurate delineation of tumor VOI (Fig. 1D), with a mean value of tumor volume of 129.9±59.3 mm3 as early as day 10. CT imaging allowed in vivo a precise quantification of tumor progression over time: As observed in Figure 1E, significantly (p<0.05) higher tumor volumes were found at day 15 and 25, respectively, to day 10. At day 25, mean tumor volume was 1011.8±344.2 mm3.
At the late stage of study day 25, X-ray scans evidenced signs of osteolysis within the distal part of the tumor-bearing tibia (Fig. 1C, arrow). Quantification of osteolytic lesions was also assessed, with BMD being determined in vivo from the 3D data:
Determination of BMD by micro-CT imaging
As a first step to such a study, the reproducibility of BMDR parameters was determined in three healthy animals successively scanned three times over a short period.
As shown in Table 1, a high reproducibility in BMDR (BMDR=BMD of right tibia/BMD of left tibia) was observed between the animals and the scans, with a mean reproducibility coefficient of 97.8%±1.3%.
BMD, bone mineral density; BMDR, BMD of right tibia/BMD of left tibia.
In POS-1 tumor-bearing animals, a mean BMDR value of 0.79±0.24 was observed at day 25, versus 0.99±0.04 in healthy mice (Fig. 2). Nevertheless, this difference was not statistically significant at p<0.05.
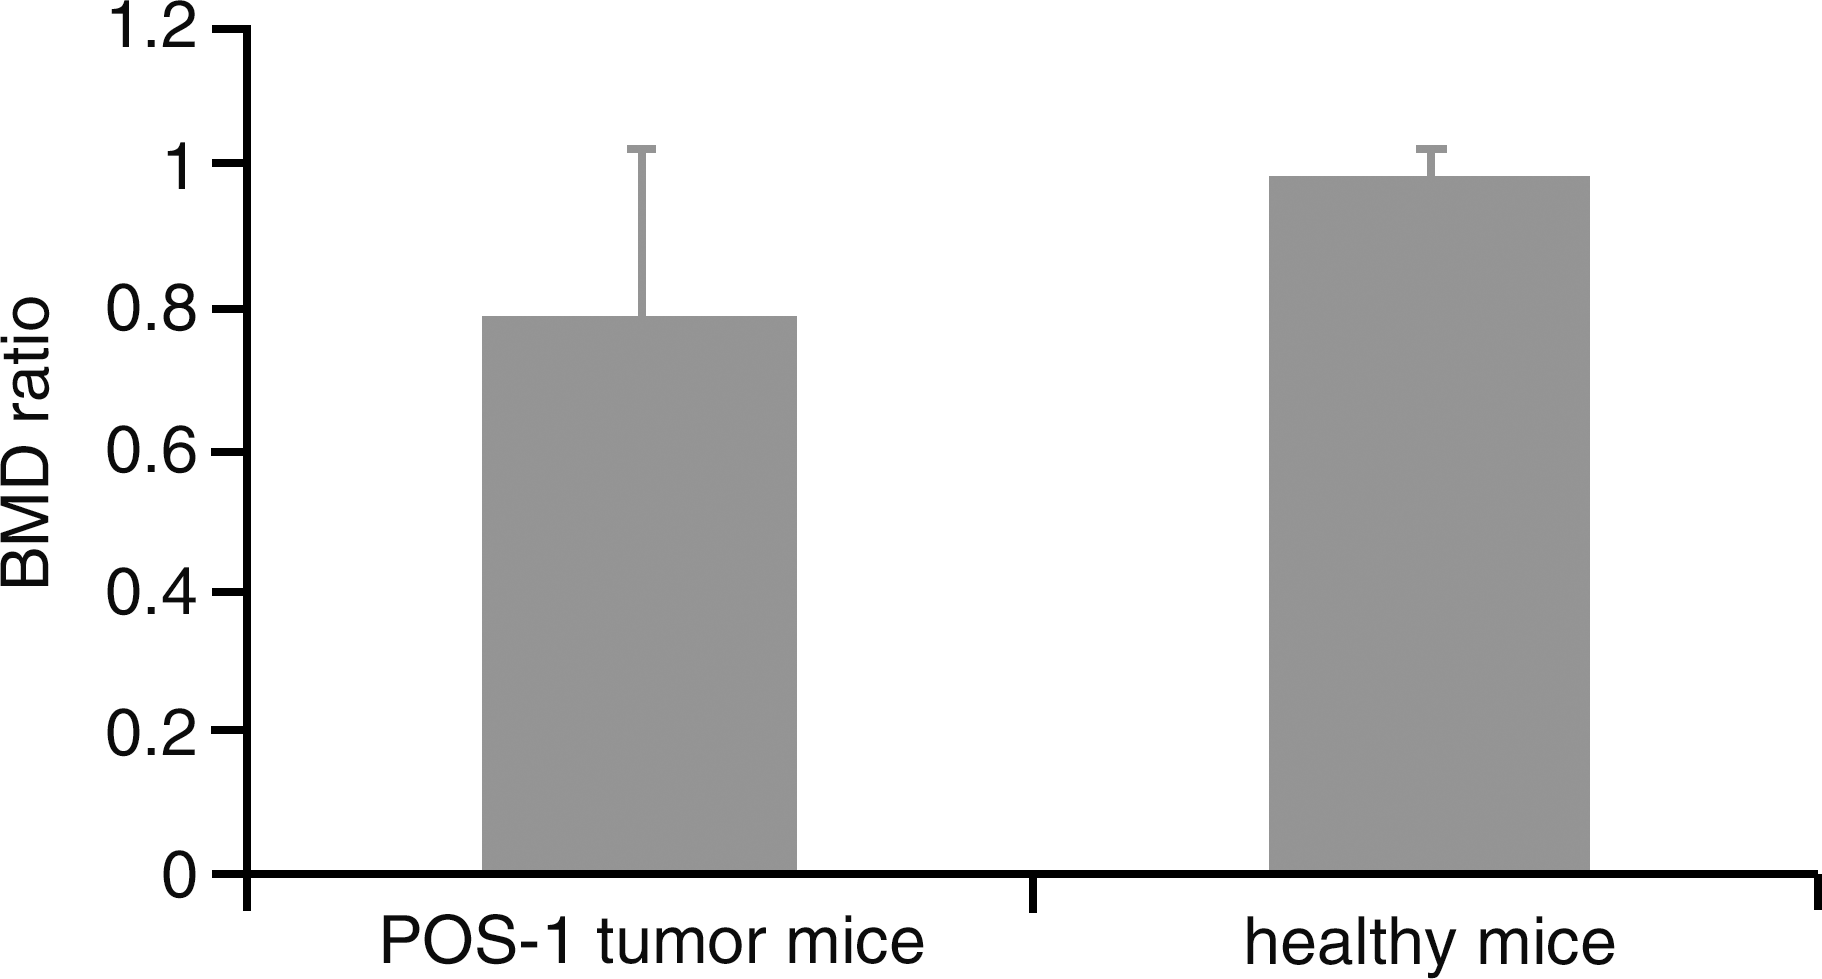
Comparison of BMD ratio between tumor-bearing mice at day 25 of pathology and healthy mice; mean±SD are presented.
Early detection and in vivo quantitative monitoring of metabolic activity of orthotopic POS-1 model by [18F]-FDG imaging
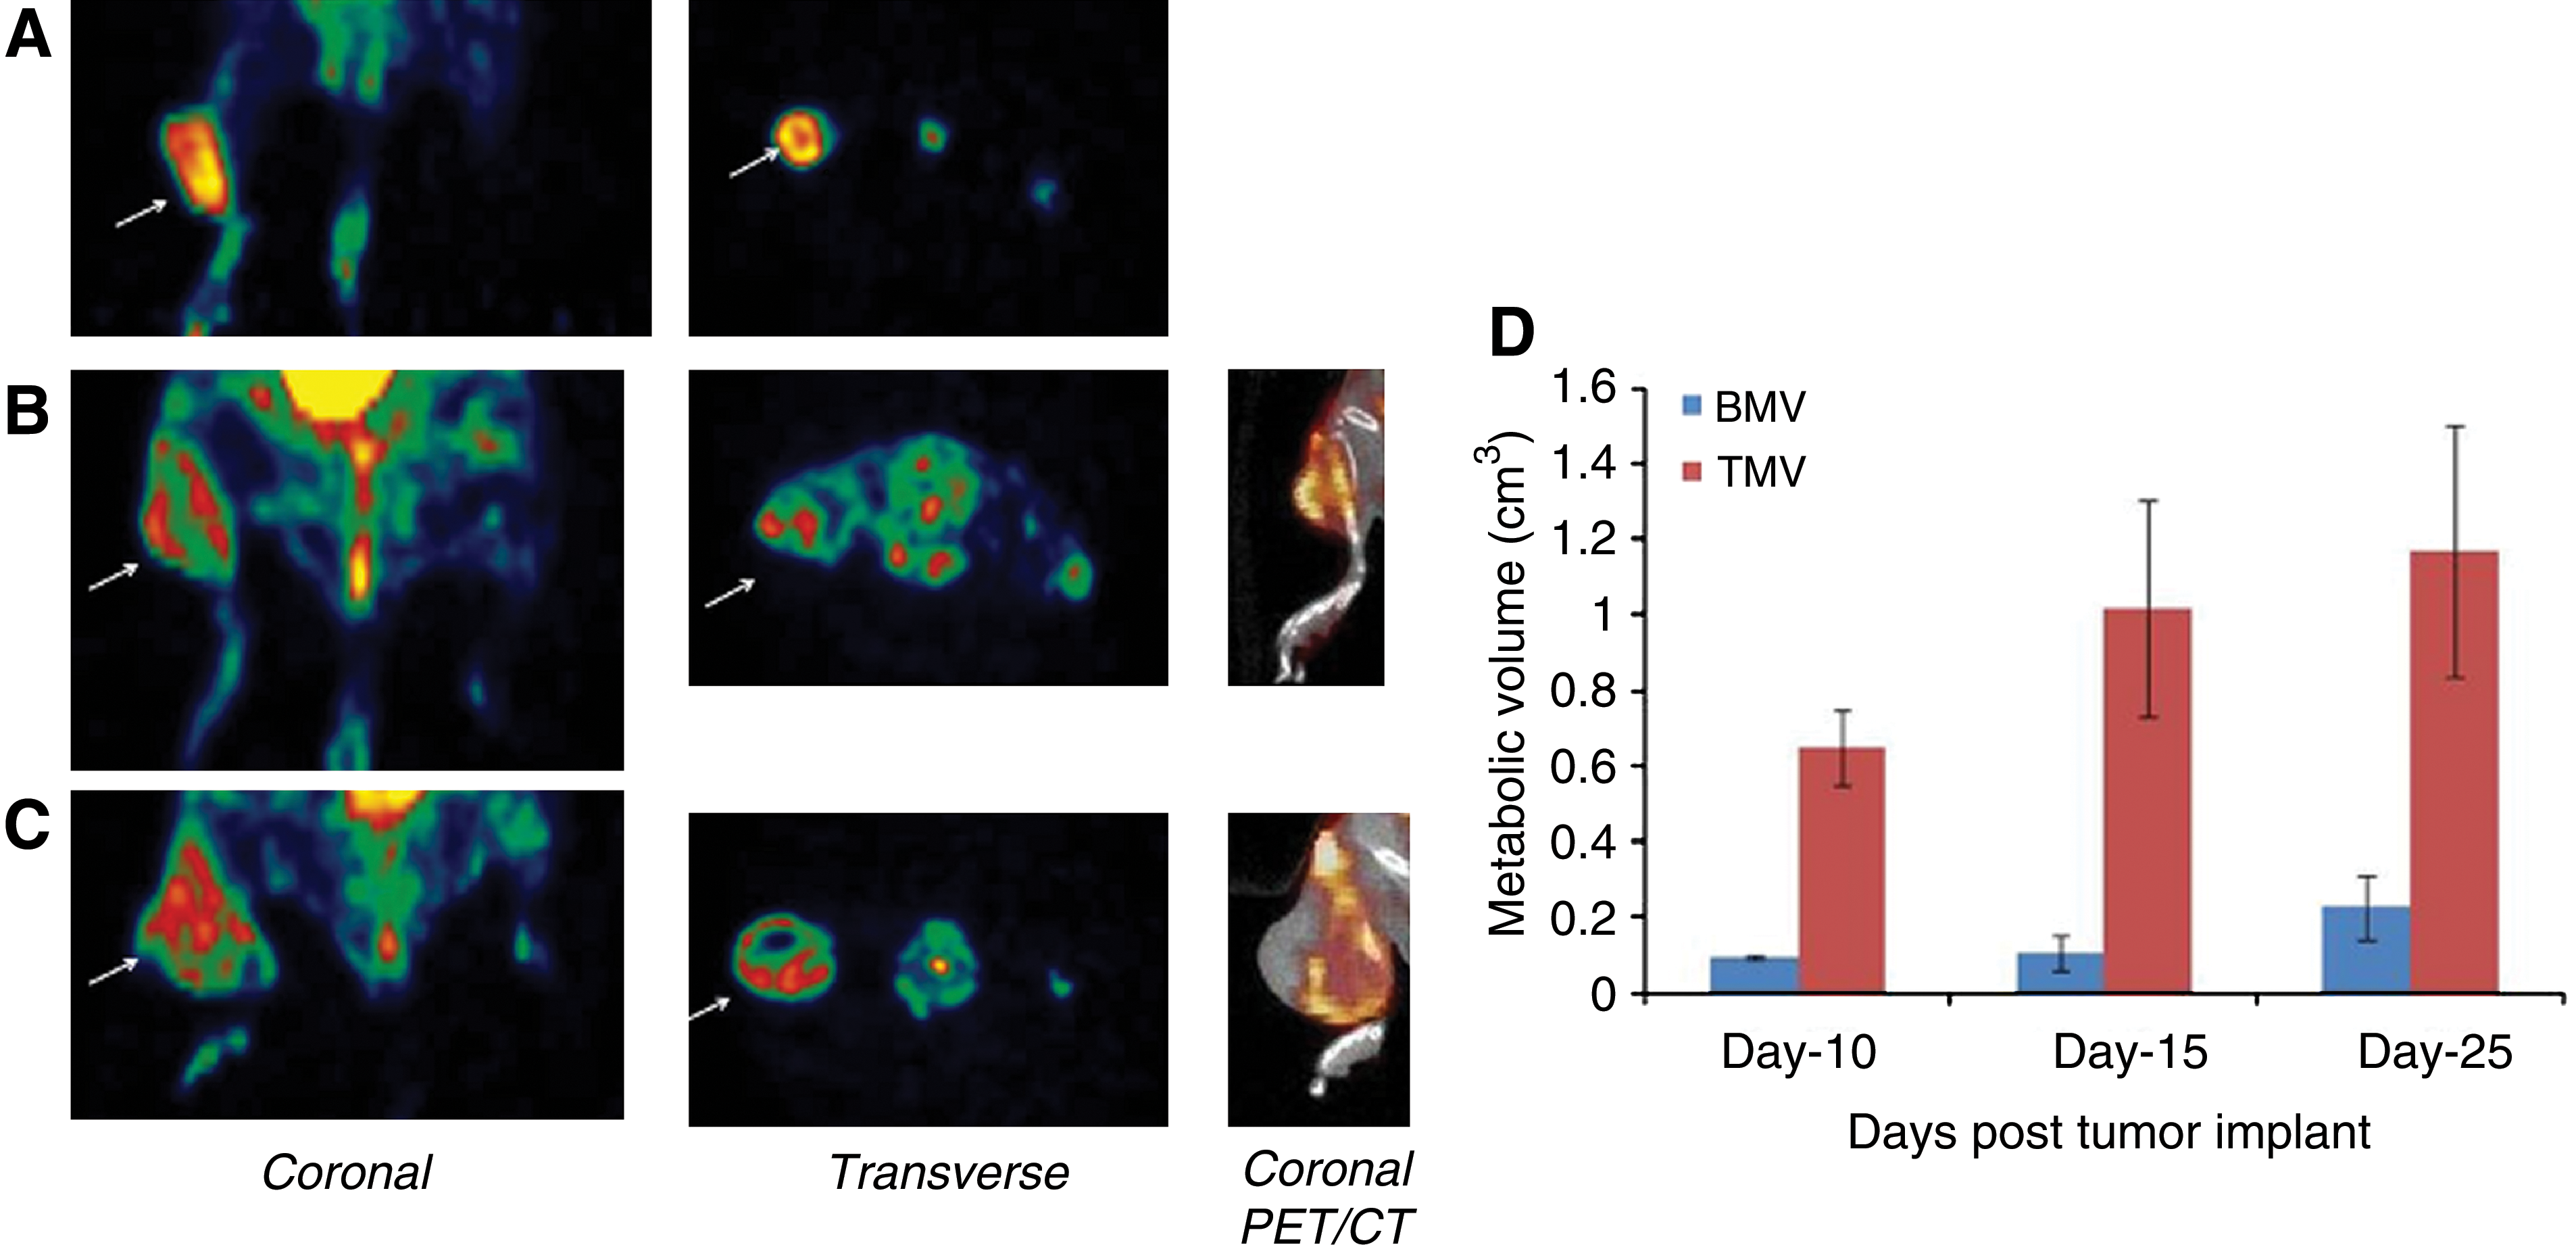
For each animal, the first [18F]-FDG PET scan was performed at day 10: All the animals that developed tumors showed tracer accumulation at implant sites. POS-1 tumors were clearly visualized at 40 minutes post-i.v. administration of radiotracer (Fig. 3A), with a mean tumor/muscle ratio of 3.7±0.8.
[18F]-FDG and [18F]-FDG PET/CT fused images of posterior paws of POS-1-bearing mice at day 10
At this early stage of pathology, visual inspection of [18F]-FDG scans (Fig. 3A) revealed that a “hot homogeneous pattern” of tracer accumulation was localized within the soft tumoral tissue, suggesting preferential tracer uptake by the active tumor cells. As pathology progressed over time, two phenomena were observed: First, a “cold” central area (Fig. 3B, C) was localized within the central region of the neoplastic mass, mainly attributed to necrosis, as confirmed by PET/CT fusion images. Second, a “hot” pattern appeared within the diaphysis of the bone (Fig. 3B, C) adjacent to the tumoral tissue as evidenced by PET/CT fusion. This “bone signal” was evidenced in 66% of animals at day 15 and 80% of animals at day 25.
Lesions were quantitatively assessed in vivo using mean TMV and BMV parameters. TMV and BMV values were 0.64±0.24 and 0.09±0.005 cm3, respectively, on day 10. Both TMV and BMV increased as the pathology progressed (Fig. 3D). Interestingly, TMV was increased during the early stage of pathology whereas BMV strongly increased during the late stage of pathology. Mean increase in TMV and BMV was 56% and 12.7% during the day 10–17 period and 14% and 113% during the day 14–25 period, respectively. The TMV determined from [18F]-FDG uptake showed a linear correlation with tumor size determined from CT (linear regression analysis; R 2=0.93).
Early detection and in vivo quantitative monitoring of bone remodeling of orthotopic POS-1 model by [99mTc]-HMDP imaging
Since 99mTc-HMDP is known to be taken up by bone tissues under physiological situations, additional healthy mice (n=3) were successively submitted to bone scintigraphy, three times over a short period (9 days).
In healthy mice (Fig. 4A), posterior planar scintigrams evidenced radiotracer accumulation within skeleton, bladder, pelvis, and the metaphysis of both femur and tibia. No differential radiotracer accumulation was observed between the right and left paws, as evidenced by a mean SR value of 0.91±0.05. As shown in Table 2, a high reproducibility in SR determination was observed between the animals and the scans, with a mean reproducibility coefficient of 97.8%±0.49%.
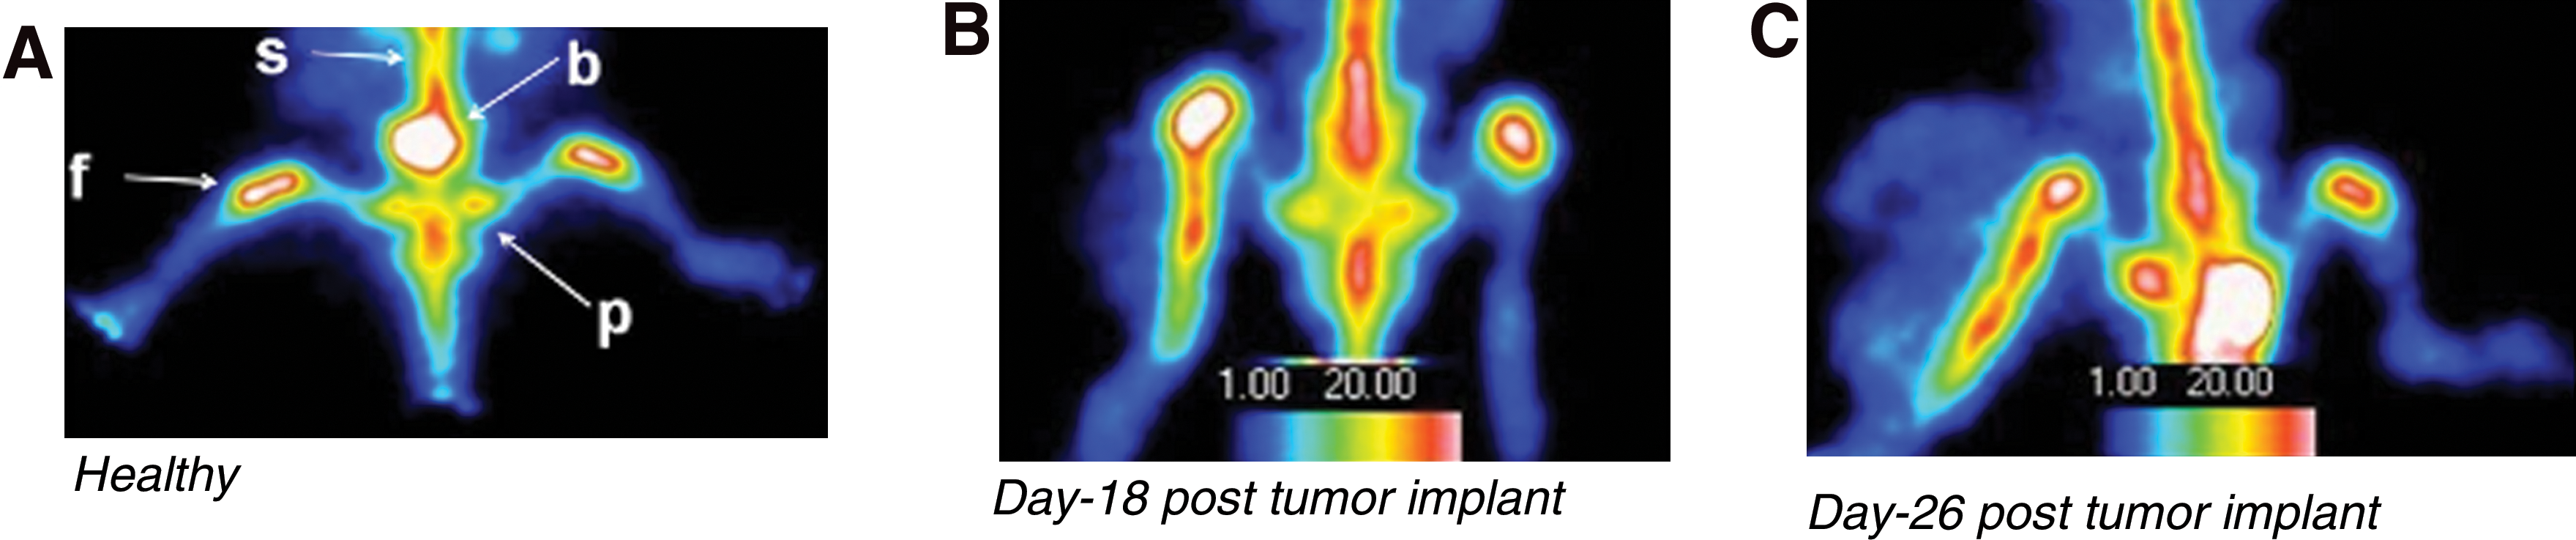
[99mTc]-HMDP imaging of posterior paws of both healthy and POS-1-bearing mice:
SR, average counts in right paw/average counts in left paw.
In tumor-bearing mice, visual analysis of scintigrams evidenced a differential radiotracer accumulation between the tumor-bearing paw and contralateral paw as early as day 12 postimplant. Radiotracer accumulation was not localized within the soft tumoral tissue but was strongly restricted to the diaphysis of the proximal tibial bone bearing POS-1 tumor. This “hot pattern” was localized within the proximal tibia region at early stage (Fig. 4B) and extended toward the distal region as pathology progressed (Fig. 4C).
Quantitative analysis is presented in Figure 4D. As early as day 12, the differential radiotracer accumulation between the tumor-bearing and contralateral paws was reflected by a mean SR of 1.36±0.11, that was found to be statistically different from SR value of healthy animals (p<0.05). Mean SR values were observed to increase as pathology progressed over time. At each time point of study, SR value for tumor-bearing mice was statistically different (p<0.05) from SR value of healthy group.
Moreover, considering tumor-bearing group, mean SR was significantly increased (p<0.05) at day 18, 22, and 26, respectively, to day 12. At the late stage of study day 26, SR reached a value of 2.53±0.19.
End point control by histology
Histological staining of POS-1 tumor indicated hyperproliferative areas characterized by a high density of round and fusiform cells. Cells showed high rates of atypia and mitosis (Fig. 5A). Histology analysis also reveals that tumor invaded the cortex and grew into the tibial medullar cavity. Cortical disruption and progressive infiltration of tumor cells was observed in Figure 5B.
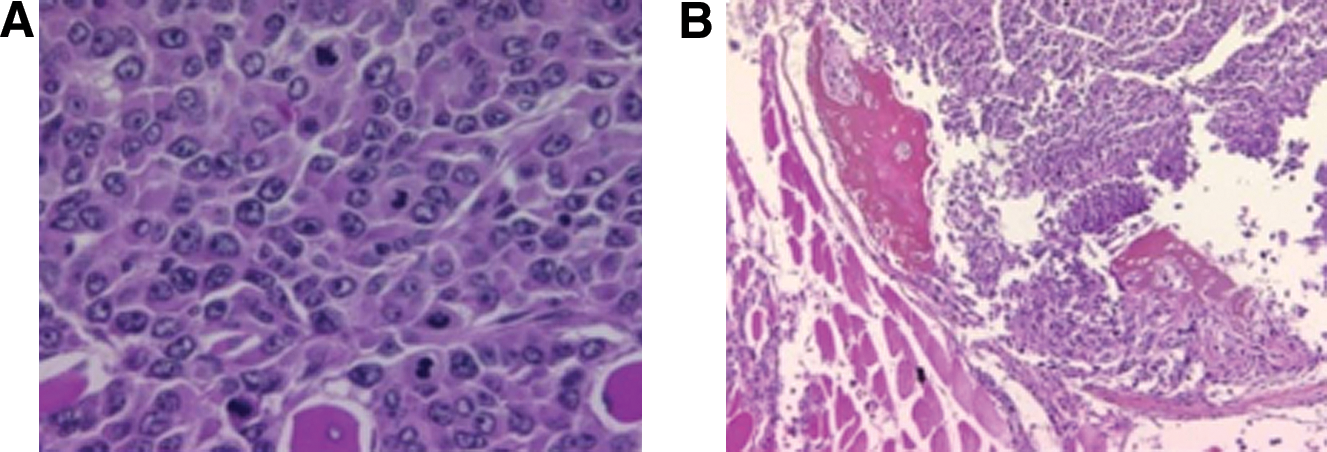
Histology of POS-1 tumor.
Discussion
Considering the lack of improvement of survival rate in OS, there is a real need for new therapeutic approaches. 1 Increasing interest has been dedicated to strategies based on the existence of a vicious cycle between bone resorption and tumor cell proliferation during OS development. 15 The assessment of new therapeutic strategies such as those designed at interrupting the vicious cycle between tumor cells and bone requires taking into account tumoral growth in a bone microenvironment. 9,10
In such approaches, mouse models of OS play a crucial role in enhancing understanding of the biologic interactions between cancer cells and bone, and to demonstrate the proof of concept of targeted therapeutic approaches. This implies that preclinical studies should combine relevant orthotopic animal models and relevant follow-up in vivo methods. Molecular imaging can meet this demand of “follow-up” by providing a noninvasive, quantitative, and real-time access to specific biological targets in vivo. 15 –19
In this study, we have combined micro-CT, bone [99mTc]-HMDP scintigraphy, and [18F]-FDG PET imaging to simultaneously and quantitatively monitor tumor growth, metabolic activity of both tumor and bone tissues, and bone remodeling involved in POS-1 osteolytic OS. The orthotopic implantation of POS-1 tumor fragment led to the development of local bone tumors in 90% of the animals. This model grows locally, leads to in-bone proliferation and osteolysis, and provides the opportunity to reproduce the critical cross-talk interactions between tumor cells and bone cells. 6 –8,10,11
Tumoral tissue exhibited a high density of round and fusiform cells, associated with a high rate of atypia and mitosis. As pathology progressed and similar to human pathology, tumoral tissue invaded the bone cortex and grew into the tibial medullar cavity, at the origin of osteolytic features.
By providing morphological features of tumor implant and burden, micro-CT appeared of value for the evaluation of the development of such orthotopic tumor, when progression is difficult to assess by palpation. Analysis of X-ray raw scans also clearly visualized signs of osteolysis at later stages. These findings are in accordance with those of Wittrand et al., which have demonstrated that the POS-1 model evidenced decrease in relative trabecullar bone volume, and total bone volume. 7 We therefore determined in vivo the BMDR for each tumor-bearing animal. As a first step to such a semi-quantitative approach, the reproducibility of the method used was found to be higher than 97% and expected to detect BMD changes in relation to osteolysis. At later stage of pathology, BMD differences were observed between contralateral and tumor-bearing paw: a mean BMDR value of 0.79±0.24 was observed in tumor-bearing animals, versus a mean BMDR value of 0.99±0.04 in healthy mice. Nevertheless, this difference was not statistically significant: this could be mainly attributable to difficulties to confidently delineate trabeculae at the 50 μm resolution used for in vivo acquisition.
The POS-1 model was also assessed in vivo through radionuclide functional imaging. PET imaging with [18F]-FDG and [99mTc]-HMDP bone scintigraphy assessed quantitatively different and complementary physiopathological patterns in the chronology of events accompanying the growth of orthotopic OS.
In vivo functional imaging characterization of the POS-1 model was first performed on the basis of its metabolic activity using [18F]-FDG PET imaging: tumoral tissue evidenced a high glucose metabolism with a high tumor/muscle ratio (3.7±0.8); tumor uptake increased as pathology progressed and when its size was below 1000 mm3. For larger tumors, [18F]-FDG accumulation was maintained at a plateau, mainly attributable to necrosis, as evidenced by “cold areas” in the center of tumoral tissue. As a consequence and as expected, in this POS-1 model, [18F]-FDG appeared as a useful indicator of viable tumor cell fraction.
Interestingly, a BMV was evidenced as a “hot” pattern within the diaphysis of the bone adjacent to the tumoral tissue. Interestingly, the BMV strongly increased during the late stage of pathology (113% increase during the day 14–25 period). Our hypothesis is that [18F]-FDG uptake in bone during this late-phase tumoral growth could be attributed to active inflammation-driven bone osteolytic process, and metabolically active peri-tumor inflammatory cells, as it has already been reported in preclinical and clinical musculoskeletal oncology. 16 –19
Simultaneously, the dynamic and quantitative approach of bone remodeling features were assessed in the same animals in vivo, through a semi quantitative analysis of serial [99mTc]-HMDP imaging. This semi quantitative analysis was clearly relevant since the reproducibility coefficient of the method used was found to be around 98% in healthy animals. An increased accumulation of the radiolabeled biphosphonate was observed within the tumor-bearing paw, respectively to the contralateral one, with a mean SR of 1.36±0.11 at day 12, that reached value of 2.53±0.19 at late stage. For each of tumor-bearing animal, accumulation of radiotracer was not localized within the soft tumoral tissue but was strongly restricted to the diaphysis of the proximal tibia bearing the tumor. This is not surprising since POS-1 cells have shown no mineralization capacity and no alkaline phosphatase activity. 6,7 This raised the question of its pathophysiological significance: since images were obtained from the “delayed bone uptake phase” acquisition, we can rule out the hypothesis of inflammation contribution. 20 We can postulate that radiotracer accumulated at sites of osteoblastic activity and bone remodeling in response to (1) a reparative activity induced by tumor osteolysis 21 and/or (2) a direct stimulation of osteoblasts by POS-1 tumor cells since the presence of the functional receptor RANK, (one of the main molecules involved in the regulation of bone metabolism and resorption), was demonstrated at the surface of these cells. 6,7,11,22
Conclusions
In conclusion, the combination of [18F]-FDG PET, [99mTc]-HMDP, and micro-CT imaging modalities applied to an orthotopic OS murine model offers the opportunity to quantitatively and simultaneously assess in the same animals in vivo (1) tumor proliferation, (2) the metabolic activity of both tumor and bone, and (3) bone remodeling.
As a consequence, we propose the POS-1 orthotopic OS model as being used as an “OS imaging model” that can be used to demonstrate the “proof of concept” of emerging therapies targeting both tumor proliferation and/or bone resorption. This may represent the opportunity to bridge the gap between preclinical and clinical testing that is a real need for OS.
Footnotes
Acknowledgment
Grants: Institut National du Cancer, Projet intercanceropoles (No. R 07022NN; coordinator to Dr. F. Rédini).
Disclosure Statement
The authors declare that they have no conflict of interest.