
Abstract
Aim of the present article was to perform three-dimensional (3D) single photon emission tomography-based dosimetry in radioimmunotherapy (RIT) with 90Y-ibritumomab-tiuxetan. A custom MATLAB-based code was used to elaborate 3D images and to compare average 3D doses to lesions and to organs at risk (OARs) with those obtained with planar (2D) dosimetry. Our 3D dosimetry procedure was validated through preliminary phantom studies using a body phantom consisting of a lung insert and six spheres with various sizes. In phantom study, the accuracy of dose determination of our imaging protocol decreased when the object volume decreased below 5 mL, approximately. The poorest results were obtained for the 2.58 mL and 1.30 mL spheres where the dose error evaluated on corrected images with regard to the theoretical dose value was −12.97% and −18.69%, respectively. Our 3D dosimetry protocol was subsequently applied on four patients before RIT with 90Y-ibritumomab-tiuxetan for a total of 5 lesions and 4 OARs (2 livers, 2 spleens). In patient study, without the implementation of volume recovery technique, tumor absorbed doses calculated with the voxel-based approach were systematically lower than those calculated with the planar protocol, with average underestimation of −39% (range from −13.1% to −62.7%). After volume recovery, dose differences reduce significantly, with average deviation of −14.2% (range from −38.7.4% to +3.4%, 1 overestimation, 4 underestimations). Organ dosimetry in one case overestimated, in the other underestimated the dose delivered to liver and spleen. However, both for 2D and 3D approach, absorbed doses to organs per unit administered activity are comparable with most recent literature findings.
Introduction
Over the last decade tumor dosimetry has gained an increasing interest aiming at establishing a correlation between absorbed dose and tumor response. 1 –3 Planar imaging being much less resource intensive than other techniques, most dosimetric calculations employ the well-established conjugate view method, as reported on MIRD pamphlet n.16. 4 –7 Unfortunately, the conjugate-view method may be inaccurate because of variation in scattered radiation from adjacent organs, activity from overlapping areas, and contributions of background regions. 8
Further, for planar imaging, S factors required for dose calculations have been derived from Monte Carlo radiation transport simulation in standard anthropomorphic models. 9 –11 Hence, S values are only tabulated for specific organs, where a uniform distribution is assumed, and not for tumors, where non uniform areas are frequently observed and a large variation in organ shape and location may occur between individuals, producing results of limited accuracy.
It is generally believed that voxel-based dosimetry derived from single photon emission tomography (SPECT) acquisitions might overcome the typical pitfalls of planar imaging with the exception of partial volume effect (PVE) and that three-dimensional dosimetry (3D) is therefore required to produce accurate patient-specific dose maps. 12–13 To overcome the limitations due to phantom-based S-factors, during the last decade different authors calculated voxel S values for various radionuclides and for different voxel sizes using direct Monte Carlo radiation transport simulation (EGS, EGS4, ETRAN code) and by direct integration of dose-point kernel. 14 –16 In addition, voxel based dosimetry may allow the implementation of radiobiological models based on the biological effective dose (BED) and equivalent uniform dose (EUD) concepts, both requiring volumetric information on the dose distribution. 17 –21
Nevertheless, even activity quantification via tomographic imaging is affected by inherent limitations. Attenuation and scatter of photons degrade the image quality, and the accuracy of activity estimates varies with the object size due to the limited spatial resolution and PVE. Proper compensation techniques are thus required.
We have tested our concept of voxel based dosimetry in patients undergoing radioimmunotherapy (RIT) with 90Y-ibritumomab-tiuxetan (Zevalin®) as, to our knowledge, no such data have been published so far, whereas a few pioneering studies based on 3D dosimetric protocols were carried out with 131I-tositumomab (Bexxar®). 1,3 In the present study, 111In-Zevalin was used as a surrogate gamma-emitting radioisotope.
We have developed a MATLAB-based code which allows for 3D dose calculations using SPECT images. In the absence of a hybrid SPECT/CT camera, correction for attenuation was obtained through attenuation maps derived from x-ray data separately acquired on a computed tomography (CT) scanner and rescaled to match with SPECT images. Scatter correction was performed applying the well-known triple energy window (TEW) technique.
Since our code allows tumor boundaries to be directly delineated on SPECT images, PVEs have to be accounted for to recover both volume and activity of outlined regions. Volume determination was performed applying a threshold edge detection technique, while volume dependent recovery coefficients (RCs) were used for activity recovery. Such correction techniques were validated through preliminary phantom studies. The code was subsequently applied to patient dosimetry evaluating the absorbed dose to lesions and to organs at risk (OARs) on four patients before RIT with 90Y-ibritumomab-tiuxetan. The absorbed dose to lesions and OARs calculated with the 3D method were compared with those assessed with planar dosimetry. Absorbed dose obtained from SPECT data are presented in terms of dose-volume histograms (DVHs).
Materials and Methods
Voxel-based dosimetry formalism
The three-dimensional internal dosimetry formalism is described in MIRD pamphlet n.17
16
according to which the mean dose
where
Monte carlo calculation of voxel S-values
A Monte Carlo N-particle radiation transport computer code (MCNP4c) was used for the evaluation of S values at the voxel level. An infinite, homogeneous soft-tissue lattice phantom consisting of 9.3×9.3×9.3 mm3 cubic voxels was created (such voxel dimensions were used during both phantom and patient study) with the same elemental composition and physical density defined by Cristy and Eckerman. 22
A unit activity was assumed to be uniformly distributed and isotropically emitted in the centroid voxel (index 0,0,0 in the Cartesian grid). Energy deposition was scored in the neighboring voxels in unit of MeV per particle. All simulations were performed without using variance reduction techniques, with 107 starting particles and a cutoff energy of 1 keV. Simulations were carried out taking into account all the available advanced options, including bremsstrahlung contributions.
The calculated S factors were compared with the same values obtained from the Medical Imaging Group of the Bologna University available on line for a homogeneous medium with the same voxel dimensions and elemental composition. 23 In this case evaluations were performed using DOSxyznrc, a program based on the EGSnrc code for a grid of 9.28×9.28×9.28 mm3 cubic voxels.
Preliminary phantom studies for SPECT activity quantification
Preliminary phantom studies are necessary to assess the accuracy of activity quantification when using SPECT data.
A hot-sphere based procedure was used to cross calibrate our SPECT imaging system with the well counter and to obtain the counts-to-activity calibration factor (cps/MBq) needed for three-dimensional dose evaluation with the MATLAB code. Phantom acquisitions were performed using an International Electrotechnical Commission body phantom with 6 spherical inserts of different nominal volumes ranging from 0.5 to 24.5 mL and a 194 mL cylindrical insert (lung insert). The volume of the empty cylinder was 9.7 L. Calibration procedures, scatter analysis, and PVEs were investigated filling the spheres with a 111In-chloride activity concentration of 74 kBq/mL. The cross calibration factor was evaluated in air to obtain ideal conditions of no scatter contribution, while a water filled background with no activity was used for scatter and PVE assessment.
For all phantom acquisitions, the Chang attenuation correction method was applied, with μ=0.125 cm−1. Phantom SPECT images were acquired at different time points with the same parameters used for patient imaging, consisting in 64 projections acquired over 360° (32 steps, 30 seconds/step); matrix size was 64×64. SPECT acquisitions were all reconstructed using OSEM reconstruction algorithm (8 substeps, 12 iterations).
Once corrected for attenuation, scatter and PVE, the cross calibration factor was calculated relating the activity of the spheres with the activity concentration measured with the well-scintillation counter and evaluating the linear regression line. The calibration factor was implemented into the MATLAB code for the following activity quantification in patient studies.
Corrections for Scatter
Scatter correction on SPECT images was performed applying the TEW technique,
24
based on the evaluation of the primary counts and the scattered component. Such algorithm consists of two main windows centered at the photopeak energy (20% energy window over the 171 and 245 keV photopeak) and two subwindows on both sides of the main window (6% scatter windows centered at 155,190, and 222 keV respectively). The assumption was made that there were no scattered events above the upper limit of the 245 keV window. With the main windows, the total counts Ctot can be estimated, while the scattered components Cscat for both photopeaks can be assessed through the following relations:
where C155keV, C190keV, C222keV are the counts in the three subwindows which are located respectively at the sides of the main windows and w 171, w 245, w 155/190, w 222 are the width of the main windows and the scatter windows, respectively. The count of primary photons is given by Cprim =Ctot −(Cscat _171+Cscat _245).
The primary counts were measured performing acquisition of hot inserts with no scattering medium. Background volume of the phantom was then filled with clean water for assessment of the scattered component.
Corrections for PVEs
Due to the PVE the signal intensity of small lesions is spread out producing a blurred image which is larger and less active than it actually is (spill-out effect). This may affect three-dimensional dosimetry leading to tumor volume overestimation and activity underestimation, which both have the effect of driving dose estimates toward lower values. The impact of such effects on dose assessment was separately evaluated.
Since our code allows tumor boundaries to be directly delineated on SPECT axial slices, a volume dependent threshold edge detection algorithm was used. 25 –28 According to such method, an isocontour was defined at some percentage of the maximum voxel value inside the reconstructed volume of interest (VOI). An intensity threshold as a function of the actual object volume was evaluated through preliminary phantom studies. The spherical inserts were acquired and manually contoured on SPECT slices. For each insert an intensity threshold was progressively applied to cut low intensity voxels and to recover the actual object volume.
The intensity threshold as a function of the object volume was then implemented in MATLAB for volume recovery. In patient studies, the nominal target volume was determined through CT images and input in MATLAB to apply the required intensity threshold.
Finally, to account for uptake underestimation, recovery coefficients (RCs) were determined as a function of volume from a phantom study and measured for each sphere as the ratio between the calculated activity and the actual activity contained in the spherical inserts. According to the method of Koral 2,29 the inverse of the RCs was used as a correction factor and multiplied by the initial estimate of tumor activity.
Both intensity threshold values and the correction factor 1/RCs were fit to a power-law equation as a function of sphere volume according to the following formula: a·Vb , where a and b are fit derived coefficients and V the sphere volume. The resultant equations were implemented into the code for proper volume recovery and to correct the measured activity.
Imaging on patients: planar and SPECT acquisition protocol
Dose calculations were performed on four patients with NHL receiving RIT with Zevalin® (RIT-Z). Mean tumor doses obtained with the voxel-based analysis were compared with those obtained applying the 2D conjugate view technique. For planar dosimetry, OLINDA/EXM code 30 was used to fit biokinetic data.
All patients underwent both planar and SPECT dosimetry studies after the administration of 250 mg/m2 rituximab (Mabthera®), followed by 111In-Zevalin®,185 MBq. A total of 5 lesions and 4 OARs (2 livers and 2 spleens) were analyzed. Two lesions (P1a and P2) were located in the axilla of two different patients, one (P1b) was cutaneous, one (P3) mediastinal, and one (P4) pulmonary.
Planar whole-body (WB) images were acquired 10 minutes, 1, 24, 48, 72, 96, and 144 hours after tracer administration on a dual-headed gamma camera Philips-FORTE equipped with medium energy all purpose collimators. Two double-sided 20% energy windows were centered at the two 111In peaks, 171 and 245 keV. Scan speed was set at 10 cm/min for all acquisitions, matrix size was 512×512. Before 111In-Zevalin administration, patients underwent a transmission scan using a 111In flood source for attenuation correction.
SPECT scans encompassing tumor sites were acquired 48, 72, 96, and 144 hours after radiopharmaceutical administration at the same 111In photopeaks. Scatter corrections were performed with a second acquisition on tumor site implementing the TEW technique. SPECT scans were performed with the same gamma camera and the same collimators used in static WB acquisitions.
Corrections for attenuations were performed producing an attenuation map from x-ray CT scans acquired with a low-current acquisition protocol (120 kV and 70 mA). CT numbers were converted with linear scaling to the attenuation coefficients μ corresponding to the 111In energy.
Quantitative analysis for two-dimensional absorbed dose evaluation
No calibration procedure was executed for the planar method since relative dosimetry was performed measuring the fraction (expressed as a percentage) of the administered activity present in some specific tumor or organ.
Dosimetric evaluations to calculate tumor and organ absorbed doses were performed applying the conjugate view method as reported in MIRD Pamphlet n 16. 4
Background correction was performed according to Buijs method,
31
applying the following correction factor:
where T is the patient thickness and t is the average thickness of the target region calculated as the ratio of the organ volume to the organ regions of interest (ROI) area.
Attenuation correction was performed through WB transmission scans executed with a flood source filled with an aqueous solution containing 185 MBq of 111 In, prior to 111 In patient administration for imaging purposes.
Scatter correction was performed according to pseudo-extrapolation number technique,
4
where the scatter compensation is accounted for by considering the following transmission factor
ROIs around target sites were manually drawn on anterior and posterior images. For each time point, tumor/organ uptake was expressed relative to the total body counts evaluated on images acquired 10 minutes after tracer administration. A time-activity curve was thus created for each source region and OLINDA/EXM package was used to model 111In-Zevalin biokinetic distribution and to retrieve S values for dose evaluations. Data points were fit with a double exponential function evaluating, for each target region, the coefficient of determination r 2.
Absorbed doses were assessed considering individual lesion/organ masses obtained contouring CT images on the Varian Eclipse™ Treatment Planning System workstation used for external beam radiation therapy.
Quantitative analysis with MATLAB for three-dimensional absorbed dose evaluation
A MATLAB code was designed and developed to perform volumetric reconstruction of SPECT slices with three-dimensional calculation of isodose maps, according to the flowchart reported in Figure 1.
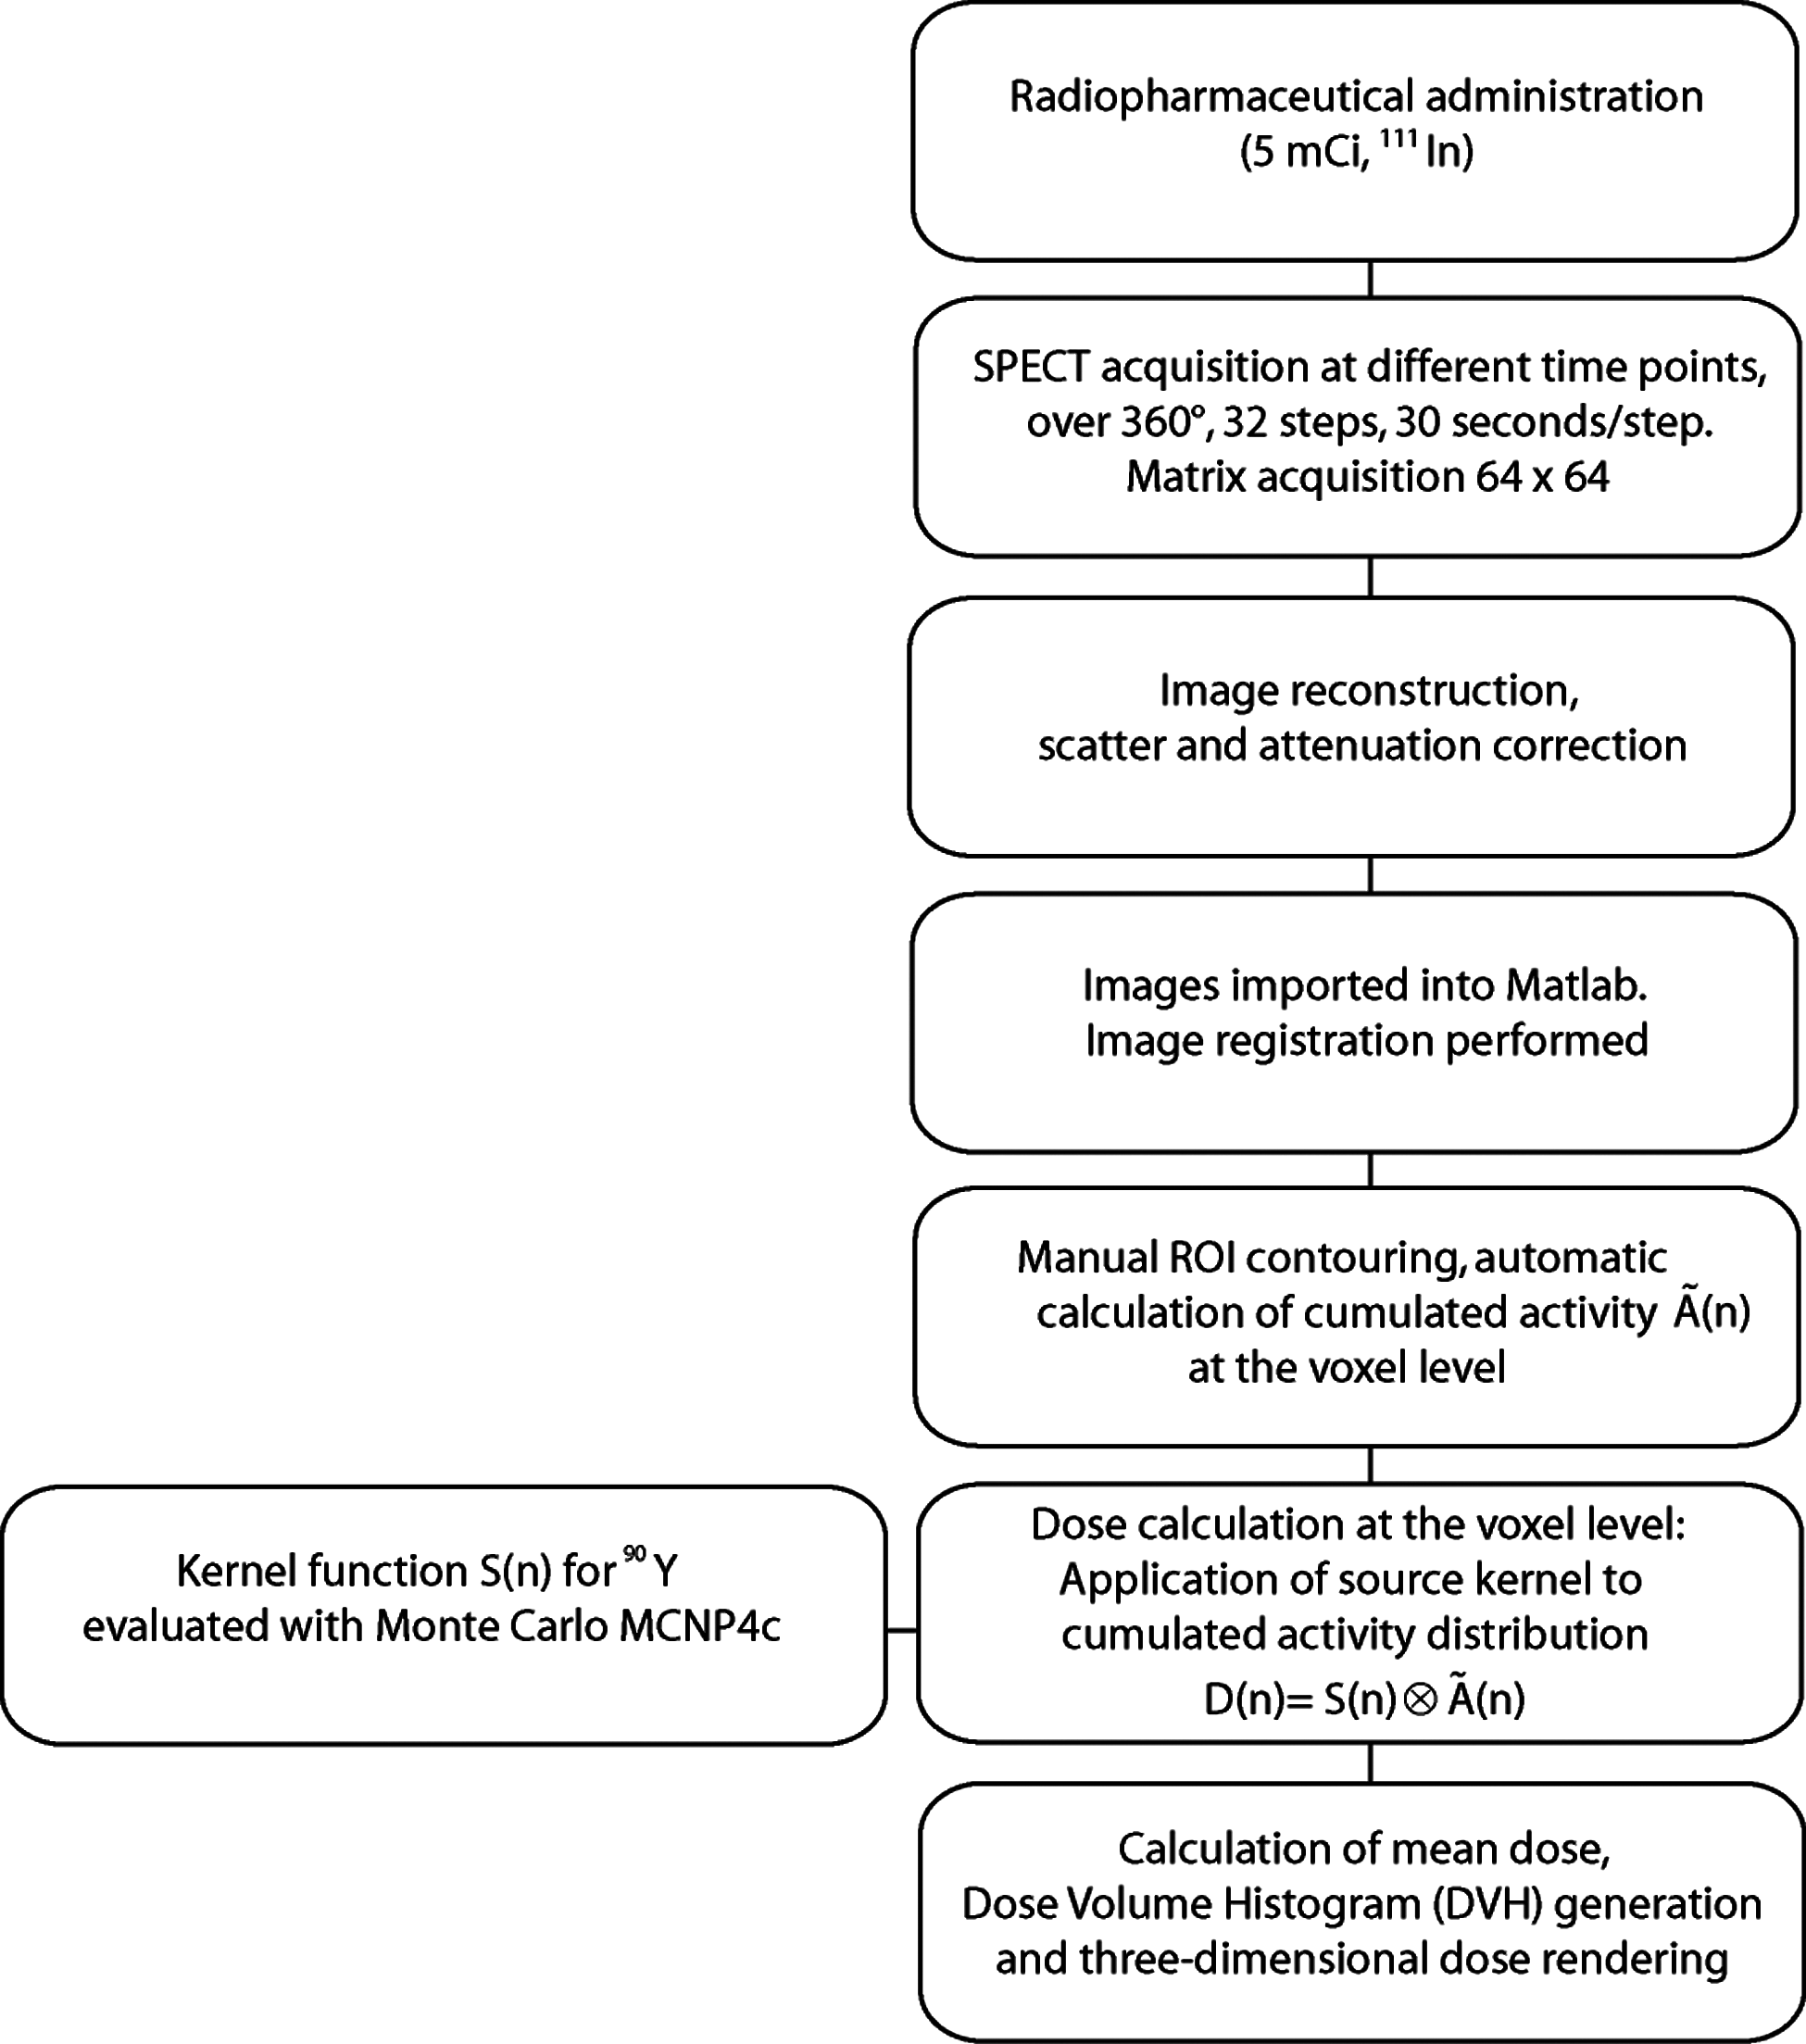
Flowchart for SPECT based dosimetry. SPECT, single photon emission tomography.
After tracer administration, SPECT scans were acquired using the same phantom acquisition protocol and reconstructed using OSEM algorithm (8 substeps, 12 iterations).
Scatter correction was performed via MATLAB loading both the noncorrected DICOM images and the Compton acquisitions. For each patient, attenuation correction was performed through CT maps acquired prior to treatment. Corrected images were then registered using a specific registration toolbox which uses a mutual information algorithm. Besides the computed registration procedure, a visual inspection of the aligned images was also performed. A manual drawing tool allows the clinician to perform a slice-by-slice ROI contouring on the transverse plan of the SPECT image. Activity inside the VOI is automatically calculated correcting for PVEs (intensity threshold and RC tuned according to target volume assessed via CT images) and cumulated activity at the voxel level is computed for each time point fitting activity data with a single exponential function. The reliability of the fit was evaluated calculating, for each organ/lesion, the average r2. The different decay constant between 111In and 90Y is considered in the code. For each voxel n, the cumulated activity was convolved with the voxel dose kernel to obtain the three-dimensional radiation absorbed dose distribution:
where S(n) represents the voxel dose kernel function and
Results
Monte carlo evaluations of S values
Calculated S values are reported in Table 1, along with the same values evaluated by the Bologna Medical Imaging Group. For the centroid voxel an excellent agreement was found, while significant differences were obtained as the distance from the source position increases.
Phantom study
Given the difficulty in defining the physical size, the smallest insert (0.5 mL) was not included in the calibration data. The cross calibration factor was (10.806±0.078) cpm/kBq (r 2=0.994).
The impact of PVE was investigated by evaluating the threshold that best allowed for volume recovery of spherical inserts. Different thresholds were progressively applied to each insert VOI (Fig. 2A). As the threshold increases, calculated volumes approach the nominal values up to a volume-dependent threshold after which underestimation occurs. As a general rule, the smaller the volume, the greater the effect, the higher the intensity threshold needed for volume recovery. For spherical inserts, an intensity threshold ranging from 48.7% to 92.1% is required for volume recovery, depending on volume (see Table 2), while for the lung insert a 35% threshold is needed. An intensity threshold as a function of insert volume was calculated and implemented into the MATLAB code for patient study (Fig. 2A).

Intensity threshold values and 1/RCs coefficients were fit to a power-law equation
Negative signs indicate underestimation of SPECT estimates compared to calibrated values. SPECT, single photon emission tomography.
Activity values were also assessed and results are reported in Table 2. Relative differences between SPECT derived (SPECTact) and nominal activities are calculated as [100*(SPECTact–Nomact/Nomact)], where Nomact represents the nominal activity inside the sphere. The activity underestimation reaches 12.95% for volumes of 11.3 mL, while it is higher than 20% for spheres smaller than 10 mL.
To compensate for activity underestimation, RCs were calculated for each sphere as the ratio of the measured activity to the nominal activity inside the spheres. The inverse of recovery coefficients, 1/RC, were plotted as a function of the sphere volume. Since the plotted curve drops below 1 for volumes larger than 28 mL approximately, we truncated 1/RC values that are less than 1 to 1 (Fig. 2B). The power law equation was implemented into the MATLAB code and applied to clinical measurements multiplying the measured activity by the proper 1/RC value to obtain the corrected activity.
Nominal and calculated absorbed doses evaluated on spherical sources after application of RCs are reported in Table 2. The relative difference between doses assessed with SPECT method is compared with nominal dose Sdose as [100*(SPECTdose–Sdose/Sdose)], where SPECTdose represents the dose for the spherical sources, evaluated as the product of the cumulated activity and the S factors obtained through Monte Carlo simulations. Sdose values were obtained as the product of nominal cumulated activities and the S factors for spheres derived from OLINDA/EXM. In this case, the accuracy in dose determination decreases as the object size gets smaller.
Satisfactory dose estimates were obtained for the larger inserts, with underestimation of −1.97% and −5.87% for the 24.56 mL and 11.3 mL spheres, respectively. Discrepancies >10% were found for nominal volumes below 5 mL, approximately.
Patient study
Consistent differences were found between 2D and 3D tumor dose estimates, with absorbed doses calculated with SPECT data being systematically lower than those obtained from planar images. If no volume correction is performed, important underestimations of 3D doses occur, with average underestimation of −39% (range from −13.1% to −62.7%, see Table 3). After volume recovery, dose estimates significantly improve, with average deviation of −14.2% (range from −38.7% to +3.4%).
Negative signs indicate underestimation of 3D dose estimate compared with the 2D method.
Dose differences ranging between +3.5% and −36.1% were found for organ dosimetry, in one case underestimating (P1) in the other overestimating (P3) planar dose estimates (see Table 3). For 3D dosimetry, the average r2 was in the range 0.93–0.96, while for planar dosimetry 0.95–0.99.
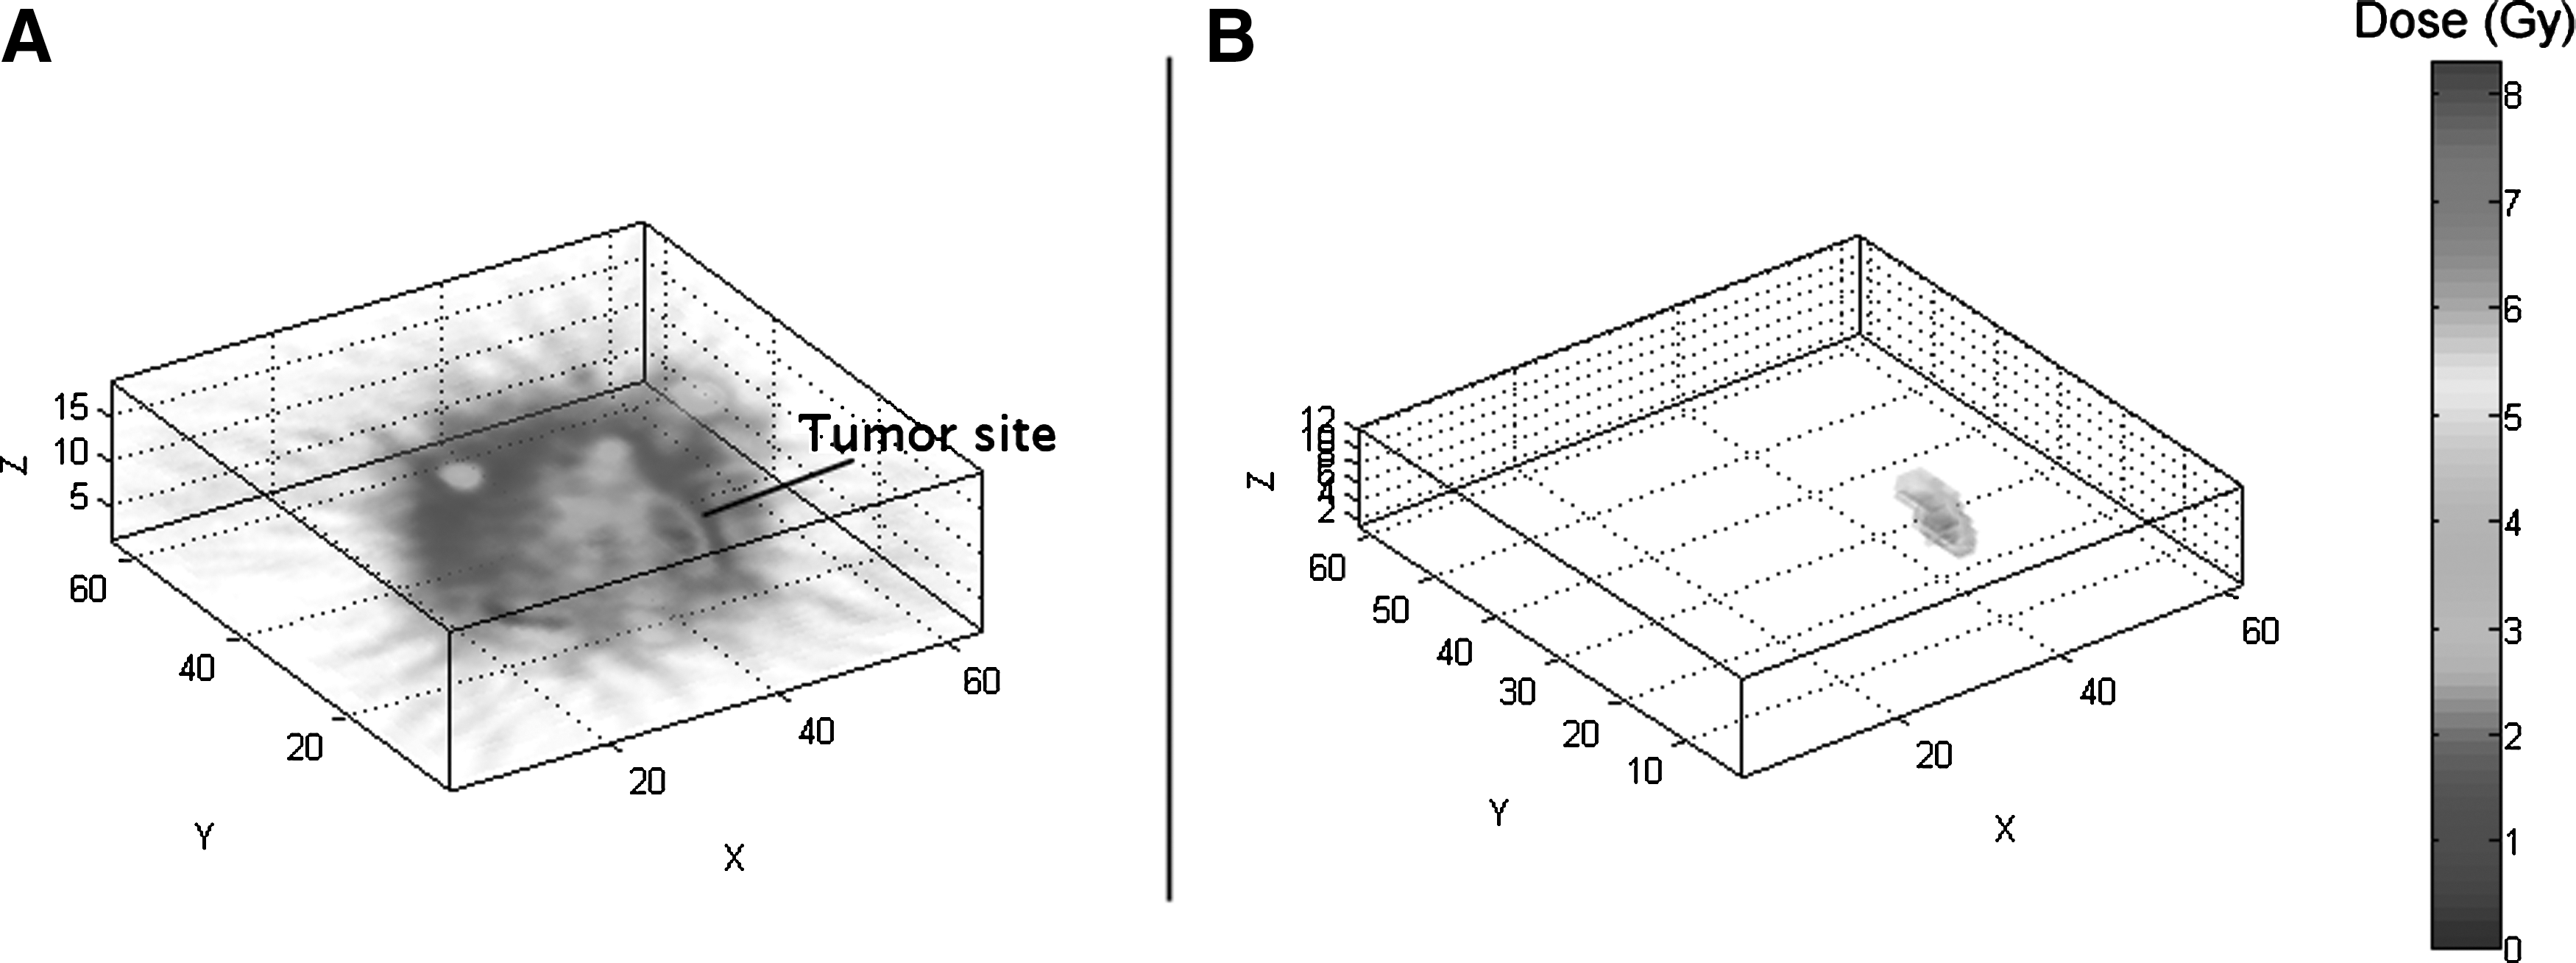
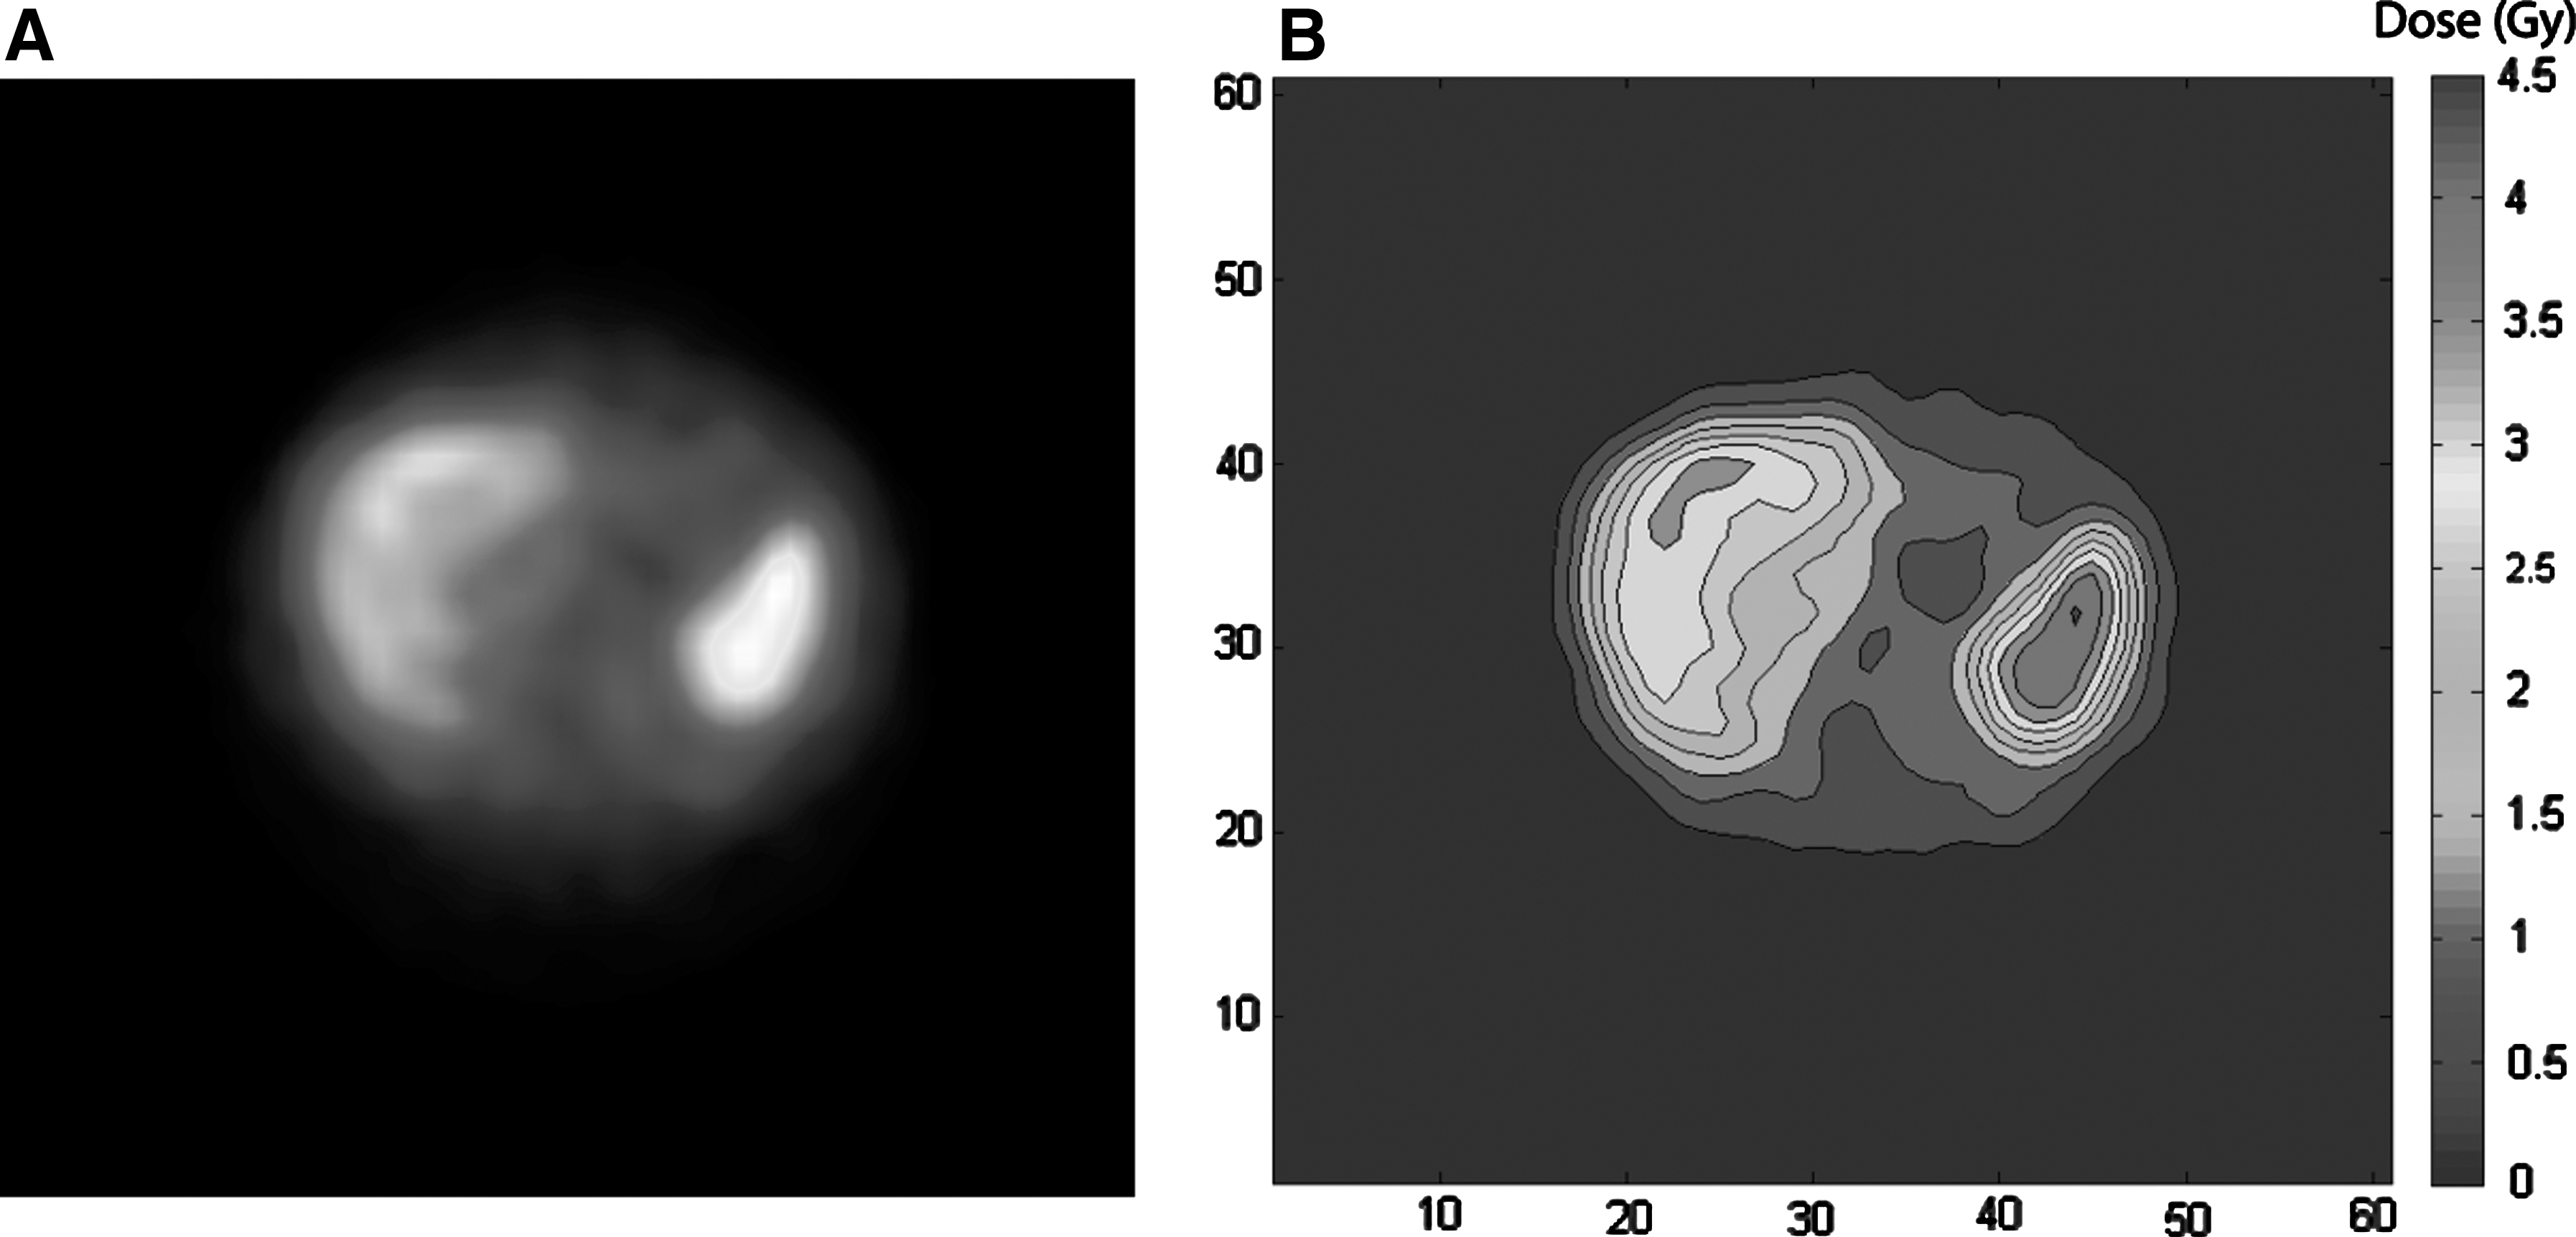
Graphical identification of lesions (Fig. 3A) along with isodose representation (Fig. 3B) can be obtained with the MATLAB code, isolating tumor sites from background.
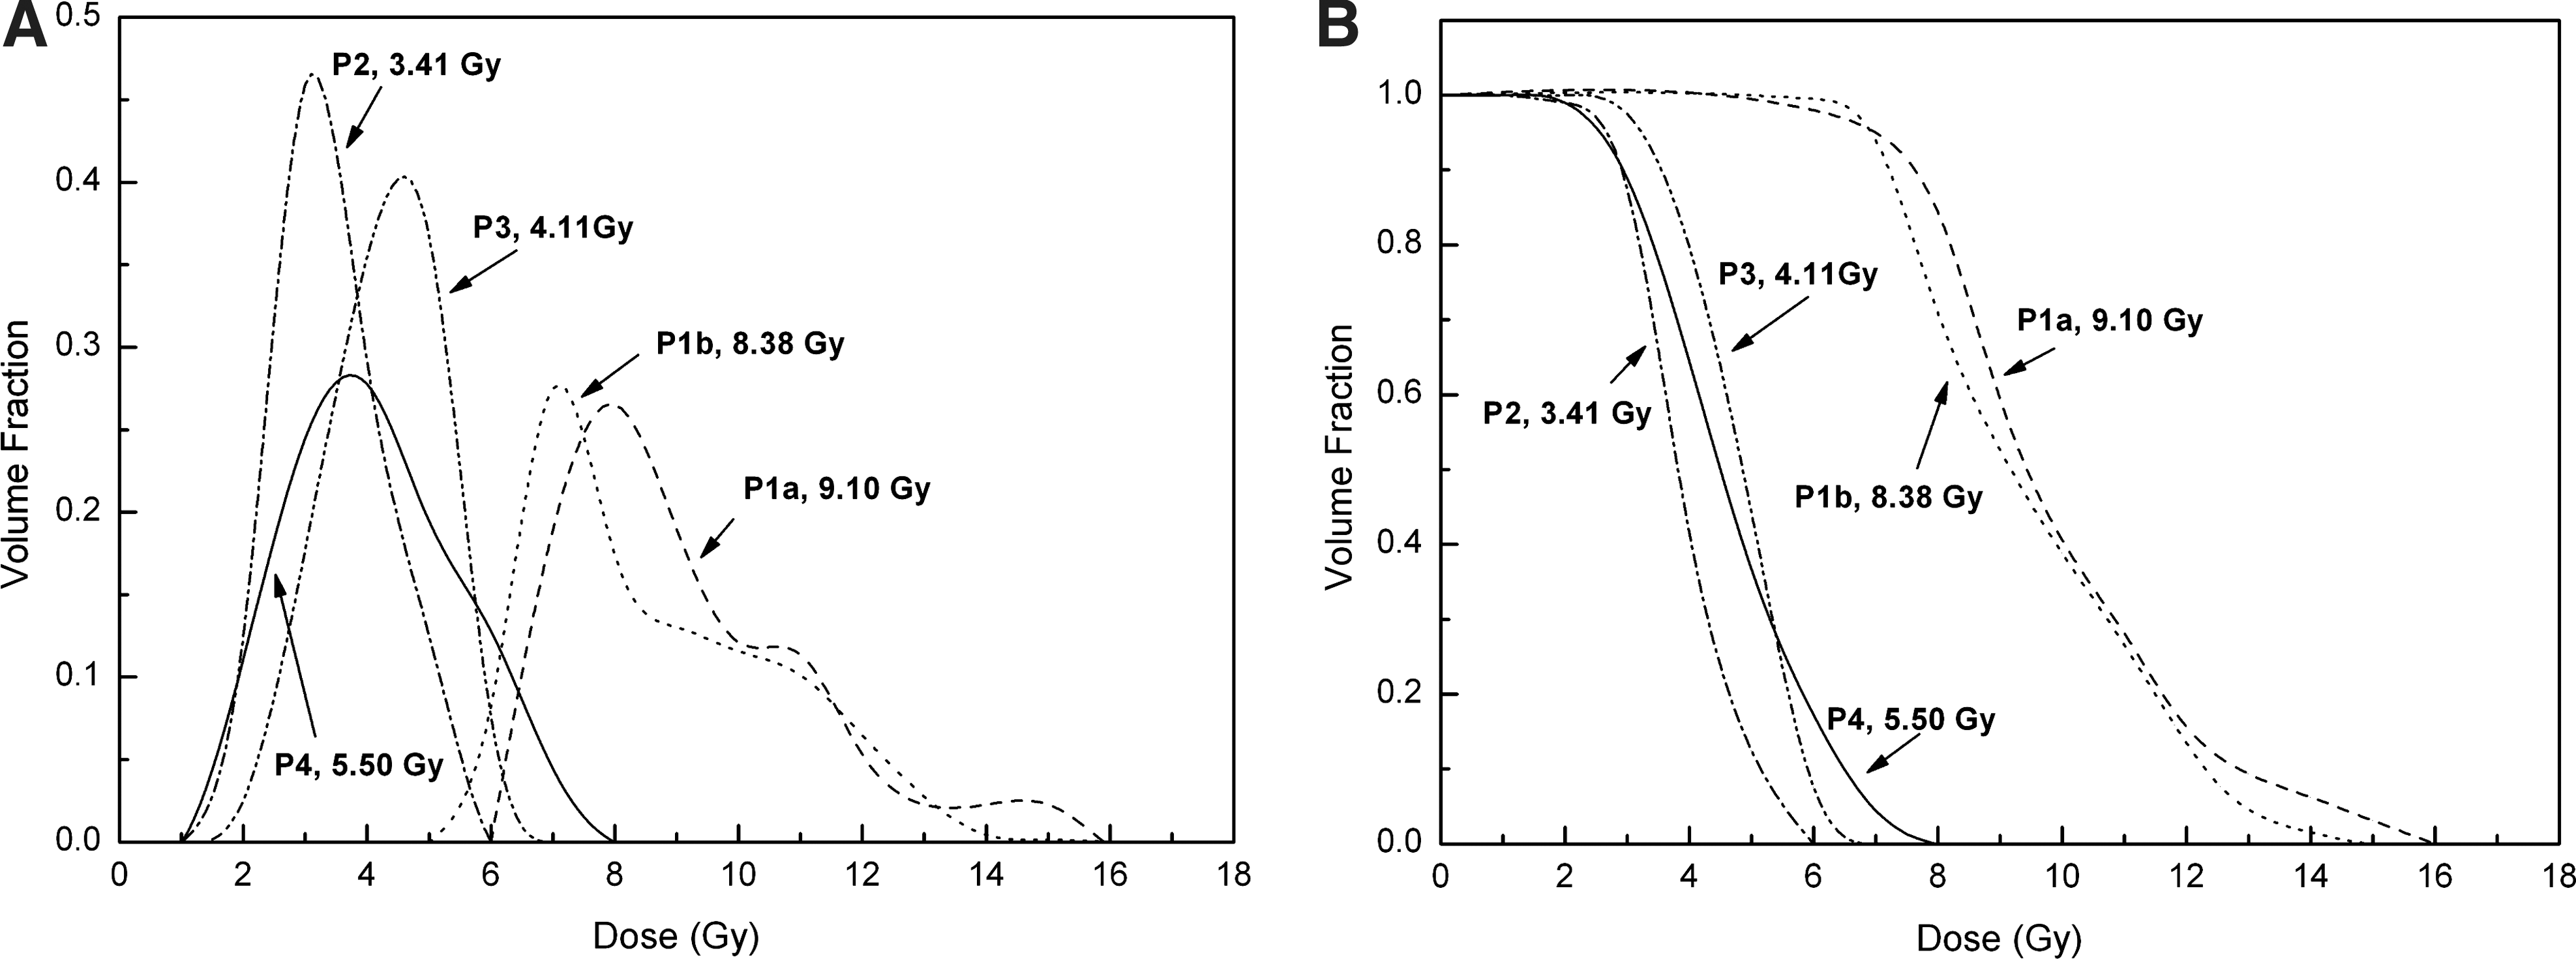
Lastly, differential and cumulative dose volume histograms were calculated for all lesions (Fig. 4A,B, respectively). DVHs of lesion P1a and P1b show a non homogeneous dose distribution with small volumes receiving high doses.
Differential
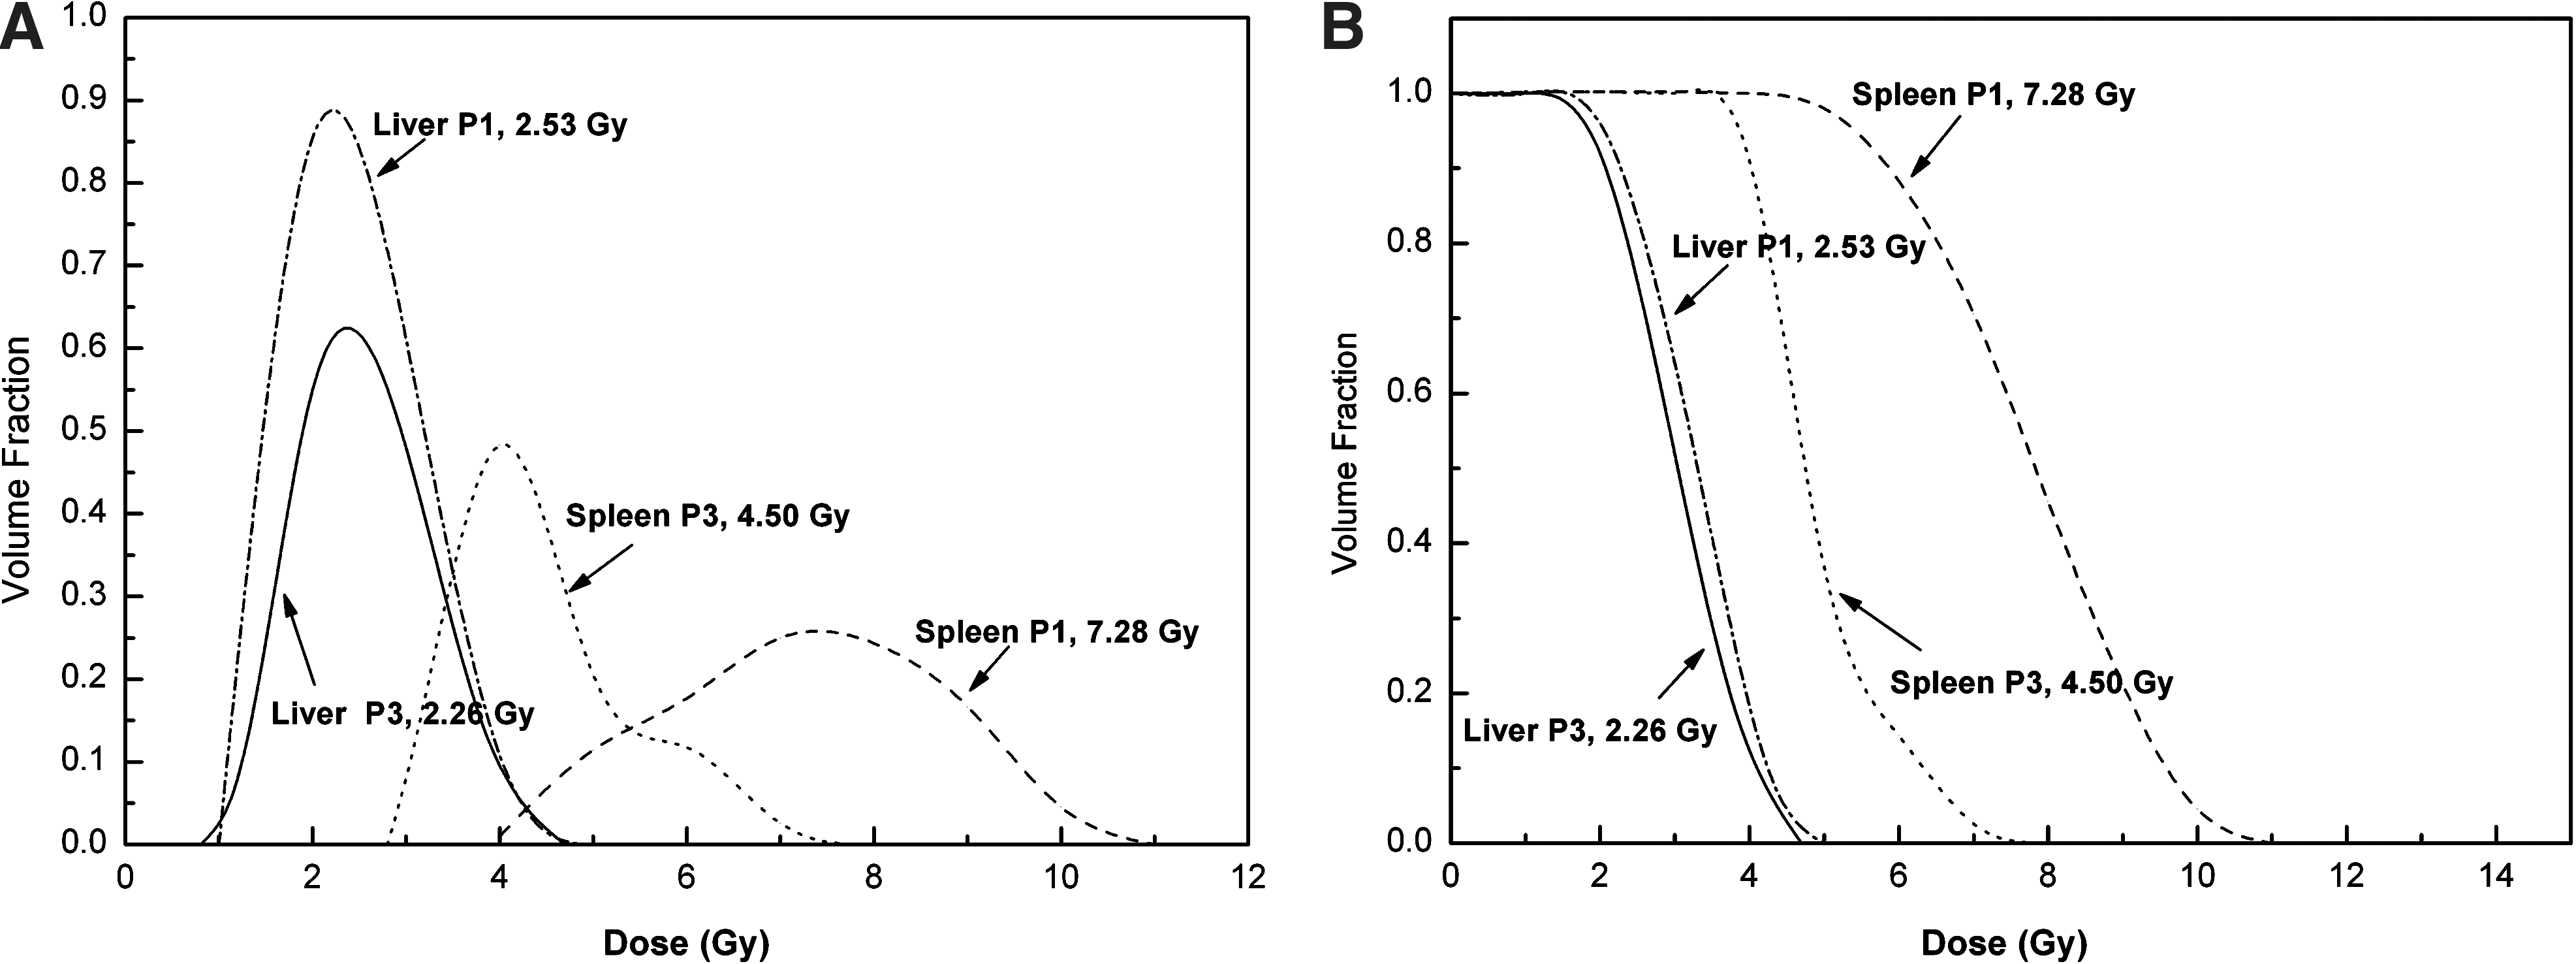
Differential and cumulative DVHs of organs are graphed in Figure 5A and B, respectively. In the absence of tumor involvement, livers and spleens were characterized by a quite uniform dose distribution.
Differential
Figure 6 shows an axial SPECT slice of patient P3 (Fig. 6A) with the corresponding MATLAB reconstruction of isodose contours over the liver and the spleen (Fig. 6B).
Discussion
Over the last years major efforts have been devoted to three dimensional dose evaluations, with the intent of moving toward patient specific dosimetry and to establish possible correlations between absorbed dose and failure rate of RIT.
Nevertheless, at the time of writing, only few publications report on absorbed dose to lesions with a 3D protocol in targeted RIT with 90Y-ibritumomab-tiuxetan, most articles addressing activity quantification of OARs.
Different authors have concluded that the estimation of absorbed doses using a 3D protocol is more accurate, because physical and technical limitations of the 2D approach (overlapping of adjacent structures, scatter, PVEs) might lead to quite large errors if not properly accounted for. In a recent work Assié et al. 12 reported remarkable discrepancies between real and estimated activity measured on phantom with 2D imaging, with differences ranging from −86% to +18%. In the same work they conclude that the estimation of absorbed doses from SPECT might lead to a more accurate dose assessment in patients. In another study, Sandrström et al. 32 carried out an individualized dosimetric study on 24 patients undergoing therapy with 177Lu-DOTA-D-Phe 1 -Tyr3-octreotate. They compared planar dosimetry with voxel dosimetry performed through SPECT acquisition concluding that the SPECT-based method provided more accurate results.
Dewaraja et al. 33 performed dose calculations for 131I radionuclide therapy, implementing 2D and 3D techniques both on phantom and patients. They reported good activity quantification and dose evaluations up to 16 mL; below, PVEs become important and SPECT derived activity and dose are underestimated.
The present work reports on the full implementation of a voxel-based method for patient specific three-dimensional dose assessment. For our evaluations a hot sphere-based calibration procedure for 111In quantification with small sized inserts was used; scatter, attenuation, and PVE corrections were performed.
S factors for 90Y were evaluated through Monte Carlo simulations, and a good agreement was found with the same values obtained by the Bologna Medical imaging group. 23 Large differences, imputable to the different Monte Carlo algorithm and the slightly different voxel dimension, were found for distant voxels. Nevertheless, the impact of such remarkable differences on dose estimates is quite limited, usually in the order of few percentage points for 90Y. 11 In fact, it is worth noting that despite the calculated S value for voxel position (0,0,1) showing a relative difference of 9.55%, the dose contribution of this voxel is more than one order of magnitude lower than the centroid element (0,0,0).
As for SPECT absolute quantification, a number of considerations arise; above all, PVEs play a crucial role in volume quantification with SPECT technique and, if not properly accounted for, they can be considered one of the major sources of error in dose evaluations. Due to PVE, the contour of a given lesion as seen on a SPECT image may appear larger than the metabolically-active area actually is (bigger volume); in addition, due to spill out effects any hot lesion of a small size will appear “dimmer” than it is (lower activity). We tried to overcome these limitations by applying a volume dependent threshold edge detection for volume determination and by evaluating recovery coefficients for uptake quantification. On phantom studies, the application of a threshold has the effect of removing spurious voxels restoring the nominal volumes and thus allowing the user to perform dose calculations on the target volume, excluding neighboring voxels affected by spill out effect. To this purpose, we used phantom inserts in the range 1.30–194 mL. Unfortunately, although it may have improved the fit to the data point, an insert between 25 mL and 194 mL was not available in our center.
In our study, a simple power-law equation was used to model recovery coefficients, as done by other authors (2, 29). Despite a poor fit to data is obtained for extremely small volumes (approximately below 10 mL), such approach does not significantly affect the absorbed dose calculations, since lesion volumes ranged between 11.5 and 107.3 mL. However, for lesions of small size a different function should be used, ideally converging to 1 for volumes greater than 30 mL.
In patient dosimetry, major effects were observed on lesion P1b and P3, where volume correction has the effect of significantly increasing the average absorbed dose. Such effect might be attributable to the small lesion volume.
In a recent work Pereira et al. 34 measured the activity recovery coefficient for 111In in SPECT with a Jaszczak phantom demonstrating the need of applying the correction for PVEs on objects with a volume ≤6 mL. Our results show that this is particularly true for inserts with a well-defined shape, but volume corrections should be performed even on larger objects, especially with irregular shape. Nevertheless, caution is advised in the presence of small volumes (diameter <2 cm) where important dose differences (around 20%) were observed even on spherical inserts.
Dose volume histograms provide important statistical information on the lesions such as minimum, average, and maximum dose, identifying possible nonuniformity areas. Nonuniformity is of utmost importance in defining correlations between absorbed dose and tumor regression. The evaluation of the spatial distribution of the absorbed dose along with the calculation of specific radiobiologic parameters such as BED or EUD could shed light on the influence of dose nonuniformity on treatment efficacy; in tumor regions exposed to very low doses possible tumor regrowth may occur, subsequently leading to treatment failure. The impact of these radiobiological issues is currently under study.
In the present study, average liver doses of 2.43 and 2.04 mGy/MBq were found with the voxel-based method in patient P1 and P3, respectively. These values approach the median values of 2.8 mGy/MBq (range 1.8–10.6 mGy/MBq) and 3.1 mGy/MBq (range 2.3–6.6 mGy/MBq) obtained with a planar method by Cremonesi et al. 35 and Fisher et al., 36 respectively. Higher 2D-estimated doses to OARs have been reported by others, 5 –7 while a detailed comparison between all these studies can be found elsewhere. 37
The mean radiation dose to the spleen obtained with our SPECT based method was 7.0 and 4.02 mGy/MBq for patients P1 and P3, respectively. Such 3D dose estimations, and those obtained with the conjugate view method (8.16 and 3.88 mGy/MBq for patients P1 and P3, respectively), are in the median-upper range of previous reports. 5 –7,35,36
As far as tumor doses are concerned, our results confirm most recent literature data, according to which 2D absorbed dose evaluations tend to overestimate 3D ones. 12,32,33
In our study we observed that this is particularly true if no volume correction is applied, where 3D tumor doses were systematically lower than 2D. When volume correction is taken into account dose differences drastically reduced and only three out of four SPECT based doses were sensibly lower. Assié et al. compared absorbed doses from a 2D protocol with dose estimates assessed with a SPECT based approach in patients, and found that the mean percent differences between the two methods were −32%, −59%, −38% for liver, spleen, and kidneys, respectively. These results are consistent with our findings. In addition, organ overlap in planar dosimery may further contribute to dose overestimation.
Despite time consuming and demanding from a computational point of view, a SPECT based approach to evaluate dose to lesions is strongly recommended since it might overcome some limitations of the two-dimensional method, offering the potential for improved dosimetric accuracy. Further studies are needed, especially on the effect of dose nonuniformity. The conjugate view method can only provide average doses, which turn out to be quite adequate for OAR dosimetry and diagnostic applications, but unacceptable for therapy where hot/cold spots and heterogeneity become relevant.
We acknowledge that in absence of a hybrid SPECT/CT system an arduous post processing work is needed. The use of a SPECT/CT device may circumvent the problems of attenuation correction and tumor uptake delineation since biokinetic data can be modeled on SPECT images corrected with low-dose registered CT and volumes can be directly outlined on registered SPECT/CT images. 1,38 Further advantages of such hybrid devices in clinical oncology are discussed in ref. 39 To determine to which extend hybrid systems may improve absorbed dose calculations was beyond the purpose of the present study.
Conclusions
A custom MATLAB based dosimetry code was created and implemented in our center. The package turned out to be a reliable tool for the evaluation of three-dimensional absorbed dose to lesions. The software can provide for partial volume corrections, using an intensity threshold method.
Further developments are currently ongoing concerning the possibility to implement three-dimensional radiobiologic dosimetry. SPECT based dosimetry provided dose values lower than 2D absorbed dose in three cases out of four, and might be close to the real values. In our opinion, whole body planar dosimetry might be sufficient for OARs, while a SPECT based dosimetry is strongly recommended for the evaluation of absorbed doses in lesions. A voxel-based protocol can be successfully accomplished in clinical practice, even in the absence of up-to-date hybrid SPECT/CT cameras.
Footnotes
Disclosure Statement
There are no existing financial conflicts.