
Abstract
In oncology 2-deoxy-2-[18F]fluoro-D-glucose ([18F]-FDG), a glucose analogue, is the most used positron emission tomography (PET) tracer. There are however some limitations due to low metabolic activity or high surrounding physiological uptake in several tumors or regions. Investigating new tracers or methods is expensive and elaborative when animal experiments or phase I clinical trials are used. In vitro experiments can overcome these limitations. We analyzed the influence of incubation time, cell medium conditions, administered activity, and cell density on [18F]-FDG uptake in six different cell cultures. Glucose transporter 1 (GLUT1)- and hexokinase 2 (HK2)-expression at high and low cell density was analyzed using immunocytochemistry. FDG-uptake increases over time and absence of glucose in the incubation medium increases uptake. By increasing the administered activity, uptake per protein also increases and tracer uptake per protein is lower at higher cell densities. Immunocytochemical analysis reveals a lower expression of both GLUT1 and HK2 at higher cell concentrations. All investigated parameters influenced FDG uptake and therefore we can conclude it is of utmost importance to keep administered activity, incubation medium, and time constant and to correct uptake when cell density changes due to environmental conditions, such as therapy.
Introduction
Today's most widely used positron emission tomography (PET) tracer in oncology is 2-deoxy-2-[18F]fluoro-D-glucose ([18F]FDG). As a glucose analogue its mechanism of action relies on enhanced glucose uptake and glycolysis. 1 Despite its widespread use, a number of problems and limitations still exist. For oncological applications, the poor specificity of [18F]FDG represents an important drawback. Infections and inflammatory processes can cause false positive findings. For brain tumors and tumors in the pelvis, the physiologic [18F]FDG uptake and excretion hamper the tumor assessment. On the other hand, some tumors such as prostate carcinoma, mucinous carcinoma, and hepatocellular carcinoma display low [18F]FDG-uptake due to low metabolic rates or elevated glucose-6-phosphatase levels. 2,3 New techniques like dynamic scanning and dual-time point imaging are under investigation to overcome these shortcomings and improve clinical work-up of patients with PET. When validating new tracers or when evaluating new therapies and procedures using validated tracers, a thorough knowledge of its uptake mechanism, uptake dynamics, and stability is needed. Phase I clinical trials and animal experiments are known to be elaborative, relatively expensive, and bound by numerous regulations. These problems are not encountered when performing in vitro experiments. However, when performing in vitro uptake experiments it is important to take into account all the different parameters that could influence tracer-uptake to assure comparable and reliable results. As it is generally known that cell metabolism and growth is influenced by factors like environmental temperature, growth medium, and cell density, we try to describe some practical aspects of in vitro experiments using [18F]FDG, which is the most available PET-tracer worldwide. For this purpose we analyzed six different cell cultures of four different tumor types and investigated the influence of incubation time, cell medium conditions, administered activity, and cell density on the in vitro uptake of [18F]FDG.
Materials and Methods
Cell culture
Three glioma (Hs683, F98, U-118), 1 epidermoid cancer (Hep2), 1 hepatocellular carcinoma (HepG2), and 1 colorectal carcinoma (HT-29) cell line were obtained from ATCC (F98, U-118MG) or kindly provided by the department of radiation oncology and experimental cancer research, Ghent University (Hs683, Hep2, HepG2, HT-29). Cells were cultured in DMEM (Invitrogen, Merelbeke, Belgium) supplemented with L-glutamine, penicillin, streptomycin, and fungizone or McCoy's 5A (Invitrogen) supplemented with 10% fetal bovine serum, L-glutamine, penicillin, and streptomycin. Cell culture medium was refreshed twice a week and cultures were kept in the exponential growth phase at 37°C and 5% CO2.
Uptake experiments
Analysis of the influence of incubation time on [18F]FDG-uptake was done using the LigandTracer® device (Ridgeview, Uppsala, Sweden). Briefly, cells were seeded in 3 mL of incubation medium at one end of a Petri dish and the dish was placed inclined in the incubator for at least 6 hours giving the cells time to adhere to the dish. Afterward, the dish was washed, fresh medium was administered, and the dish was placed back in a normal position at 37°C and 5% CO2. Two to 4 days after seeding, the dish was washed with phosphate-buffered saline (PBS), and 10 μCi of [18F]FDG was diluted in 3 mL PBS and added after placing the dish in the device. By sequentially measuring the side of the dish with and without cells, uptake was quantified in counts per second in an easy way for up to 2 hours (Fig. 1).
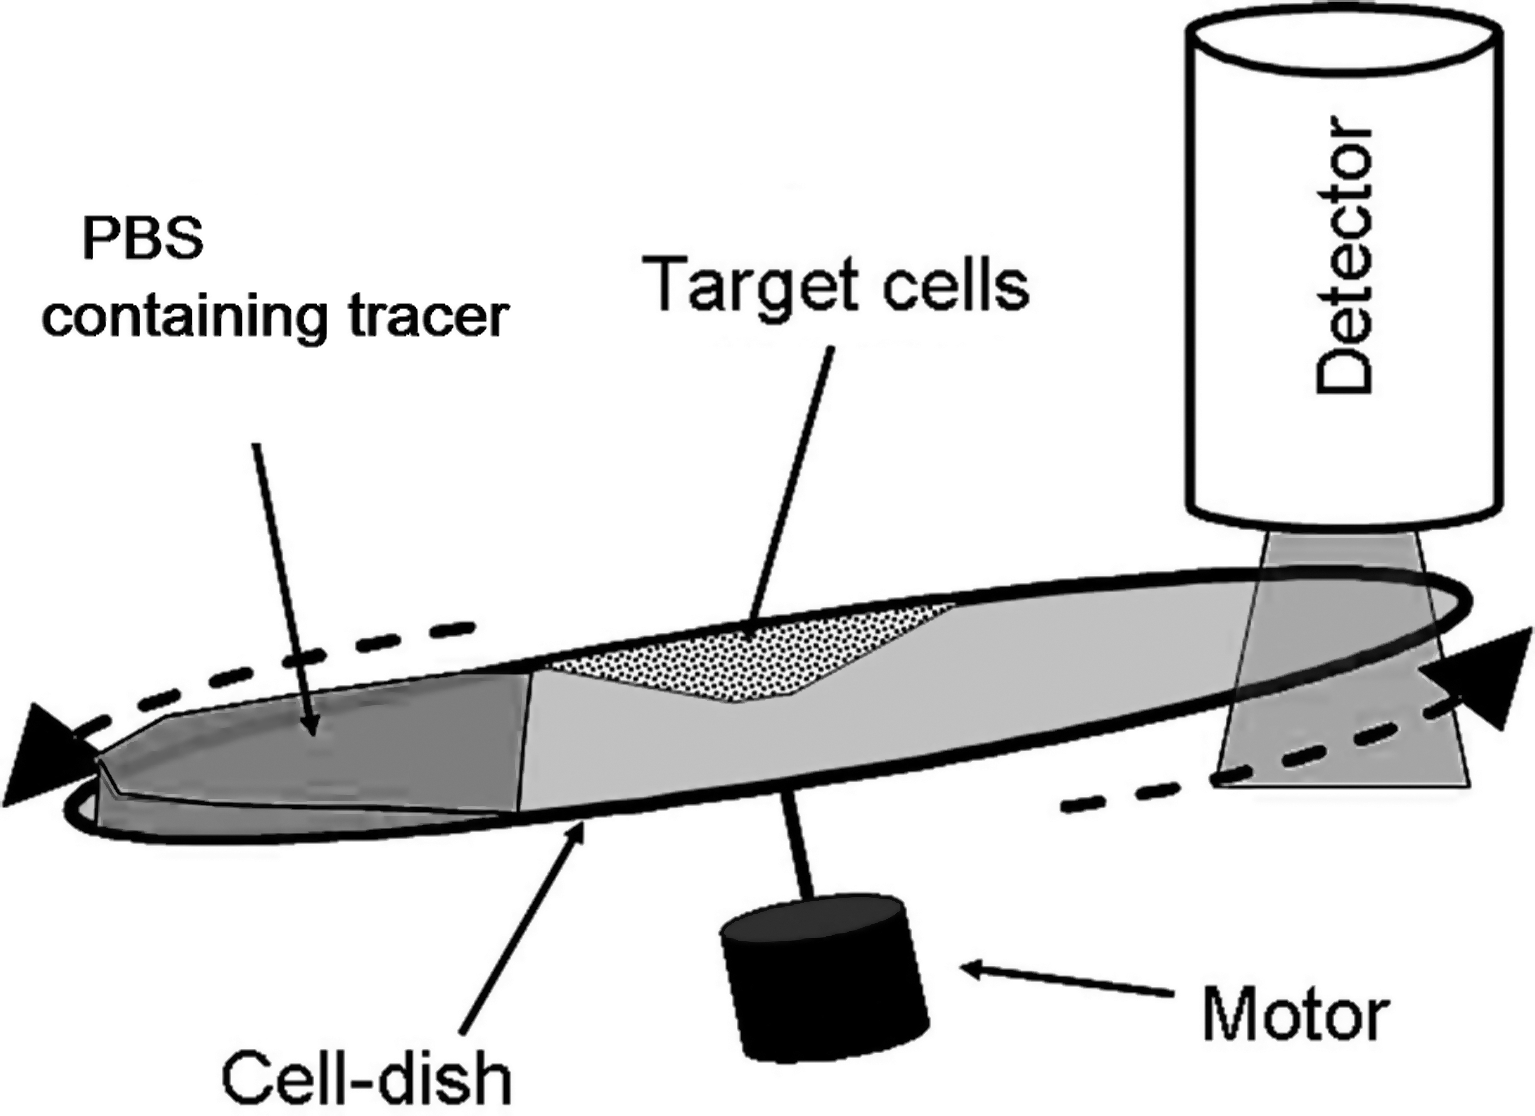
Principle of uptake experiments using LigandTracer device. Tumor cells are specifically grown at one end of the dish. The dish is placed inclined in the device with radioactive tracer present in the incubation medium. When the dish rotates, places with/without tumor cells sequentially pass the detector, measuring uptake of radioactivity in real-time. PBS, phosphate-buffered saline.
For analysis of the influence of tracer activity, incubation medium, and cell density on [18F]FDG-uptake, cells were seeded in 12-well plates (BD, Erembodegem, Belgium). Cells were allowed to grow and attach for at least 48 hours. In experiments evaluating the influence of tracer activity and incubation medium, a constant number of cells were seeded. In experiments evaluating the influence of cell density, different cell concentrations were seeded. When different tracer activities were administered, a standard sample of the incubation solution was measured to calculate the percentage uptake of the administered activity. 1, 10, or 100 μCi of [18F]FDG was diluted in 1 mL of either PBS or cell culture medium and added to each well. After a 60 minutes incubation period at 37°C and 5% CO2, cells were washed three times with ice-cold PBS and lysed in 0.5 mL RIPA-buffer (Thermo Scientific, Rockford, IL). Cell lysates were counted using an automated gamma counter (Cobra II series; Canberra-Packard, Meriden, CT). Protein concentration of each sample was determined using the BCA protein assay kit (Pierce, Rockford, IL) according to the manufacturer's recommendations and bovine serum albumin (BSA) was used as protein standard. Uptake/well was corrected for protein concentration in the experiments investigating cell density.
Immunocytochemical staining
For immunocytochemical staining of glucose transporter 1 (GLUT1) and hexokinase 2 (HK2) cells were seeded in different cell concentrations in wells of Labtek polystyrene slides (BD). After removal of the plastic box, cells were fixated in 4% paraformaldehyde (Klinipath, Olen, Belgium). The endogenous peroxidase activity was blocked for 5 minutes with 0.3% hydrogen peroxide (Dako, Glostrup, Denmark). Slides were incubated with primary antibodies diluted in 1 × PBS with 1% BSA for 1 hour at room temperature (GLUT1 ABCAM ab15309, HK2 Santa-Cruz sc-28889). After washing, the tissue sections were incubated for 30 minutes at room temperature with a labeled polymer-HRP antirabbit secondary antibody (Dako). After washing, the tissue sections were counterstained with Mayer's hematoxylin. An Optronics color digital camera (Olympus Corporation, Tokyo, Japan) and specialized software (Cell D Olympus Imaging Solutions, Münster, Germany) was used to analyze immunocytochemical stainings. Slides were visually analyzed for both intensity and percentage of positive tumor cells in confluent and subconfluent wells.
Statistical analysis
All experiments were performed in triplicate and repeated three times. Because of the descriptive nature of our staining results neither scores nor statistical analysis is provided.
Results
Incubation time
LigandTracer-technology was used to measure [18F]FDG-uptake in real-time to quantify uptake in tumor cells throughout time. We observed an increase in [18F]FDG-uptake over a time period of 120 minutes. Results of these experiments are shown in Figure 2.
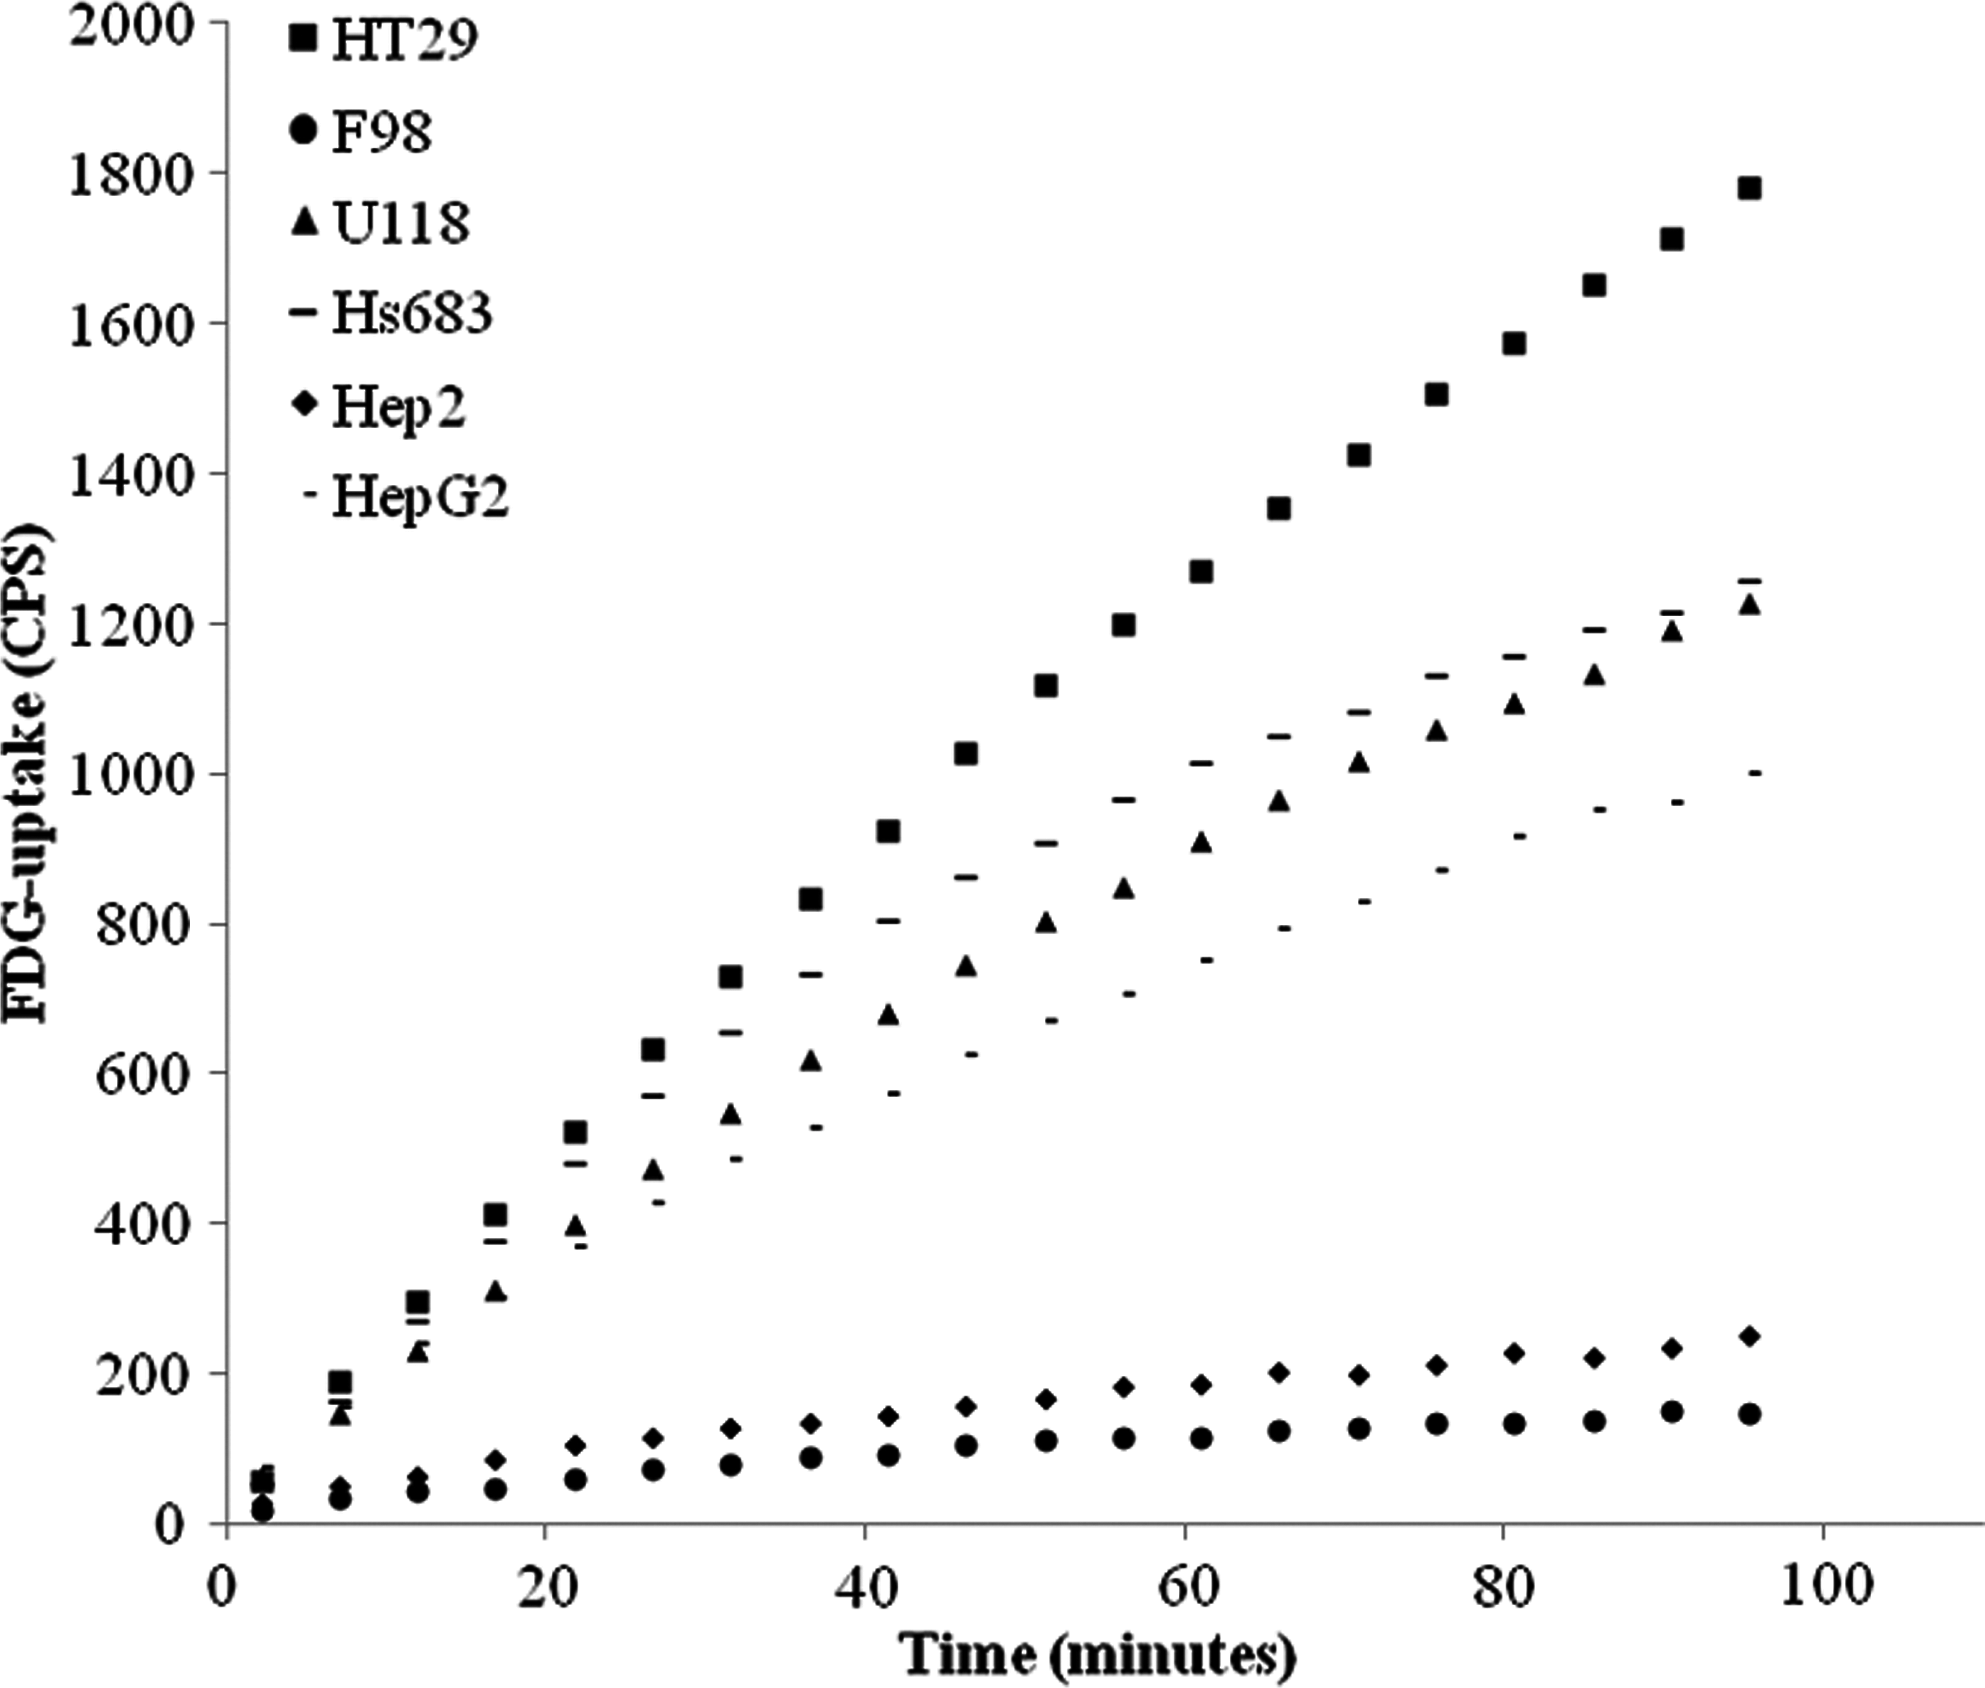
[18F]FDG-uptake over time. [18F]FDG-uptake in CPS is expressed over time in minutes for all six different cells. We observe an increase in all cell cultures. CPS are measured in predefined areas containing cells of the dish and corrected for background activity in areas without cells. [18F]FDG, 2-deoxy-2-[18F]fluoro-D-glucose; CPS, counts per second.
Incubation medium
[18F]FDG-uptake was measured after incubation in both PBS and normal cell culture medium (DMEM and in case of HT-29 cells in McCoy's). The [18F]FDG solution has a glucose level below 20 mg/dL whereas DMEM has around 100 mg/dL and McCoy's 300 mg/dL. [18F]FDG-uptake in cell culture media was lower compared with PBS as incubation medium. This was the case for all cell lines tested (Fig. 3).

[18F]FDG -uptake in different incubation media. Results of [18F]FDG-uptake in different incubation media are shown for all tested cell cultures where cell number and tracer activity are kept constant. In all investigated cell lines the percentage of the administered activity that was retained inside the cells was higher when PBS was used as incubation medium compared with cell culture-specific growth medium.
Tracer activity
Next, we investigated the influence of administration of different tracer activities in in vitro experiments. Therefore, [18F]FDG-uptake was measured after the addition of 1, 10, and 100 μCi of [18F]FDG. In addition, these experiments were conducted in both PBS and cell growth medium. When 100 μCi of [18F]FDG was administered the highest percentage of the administered activity was retained in the cells. We observed a much higher accumulation of [18F]FDG when PBS was used compared with cell medium (Fig. 4). Further, uptake was dependent of the cell line and there's a slightly higher accumulation at higher tracer activities.
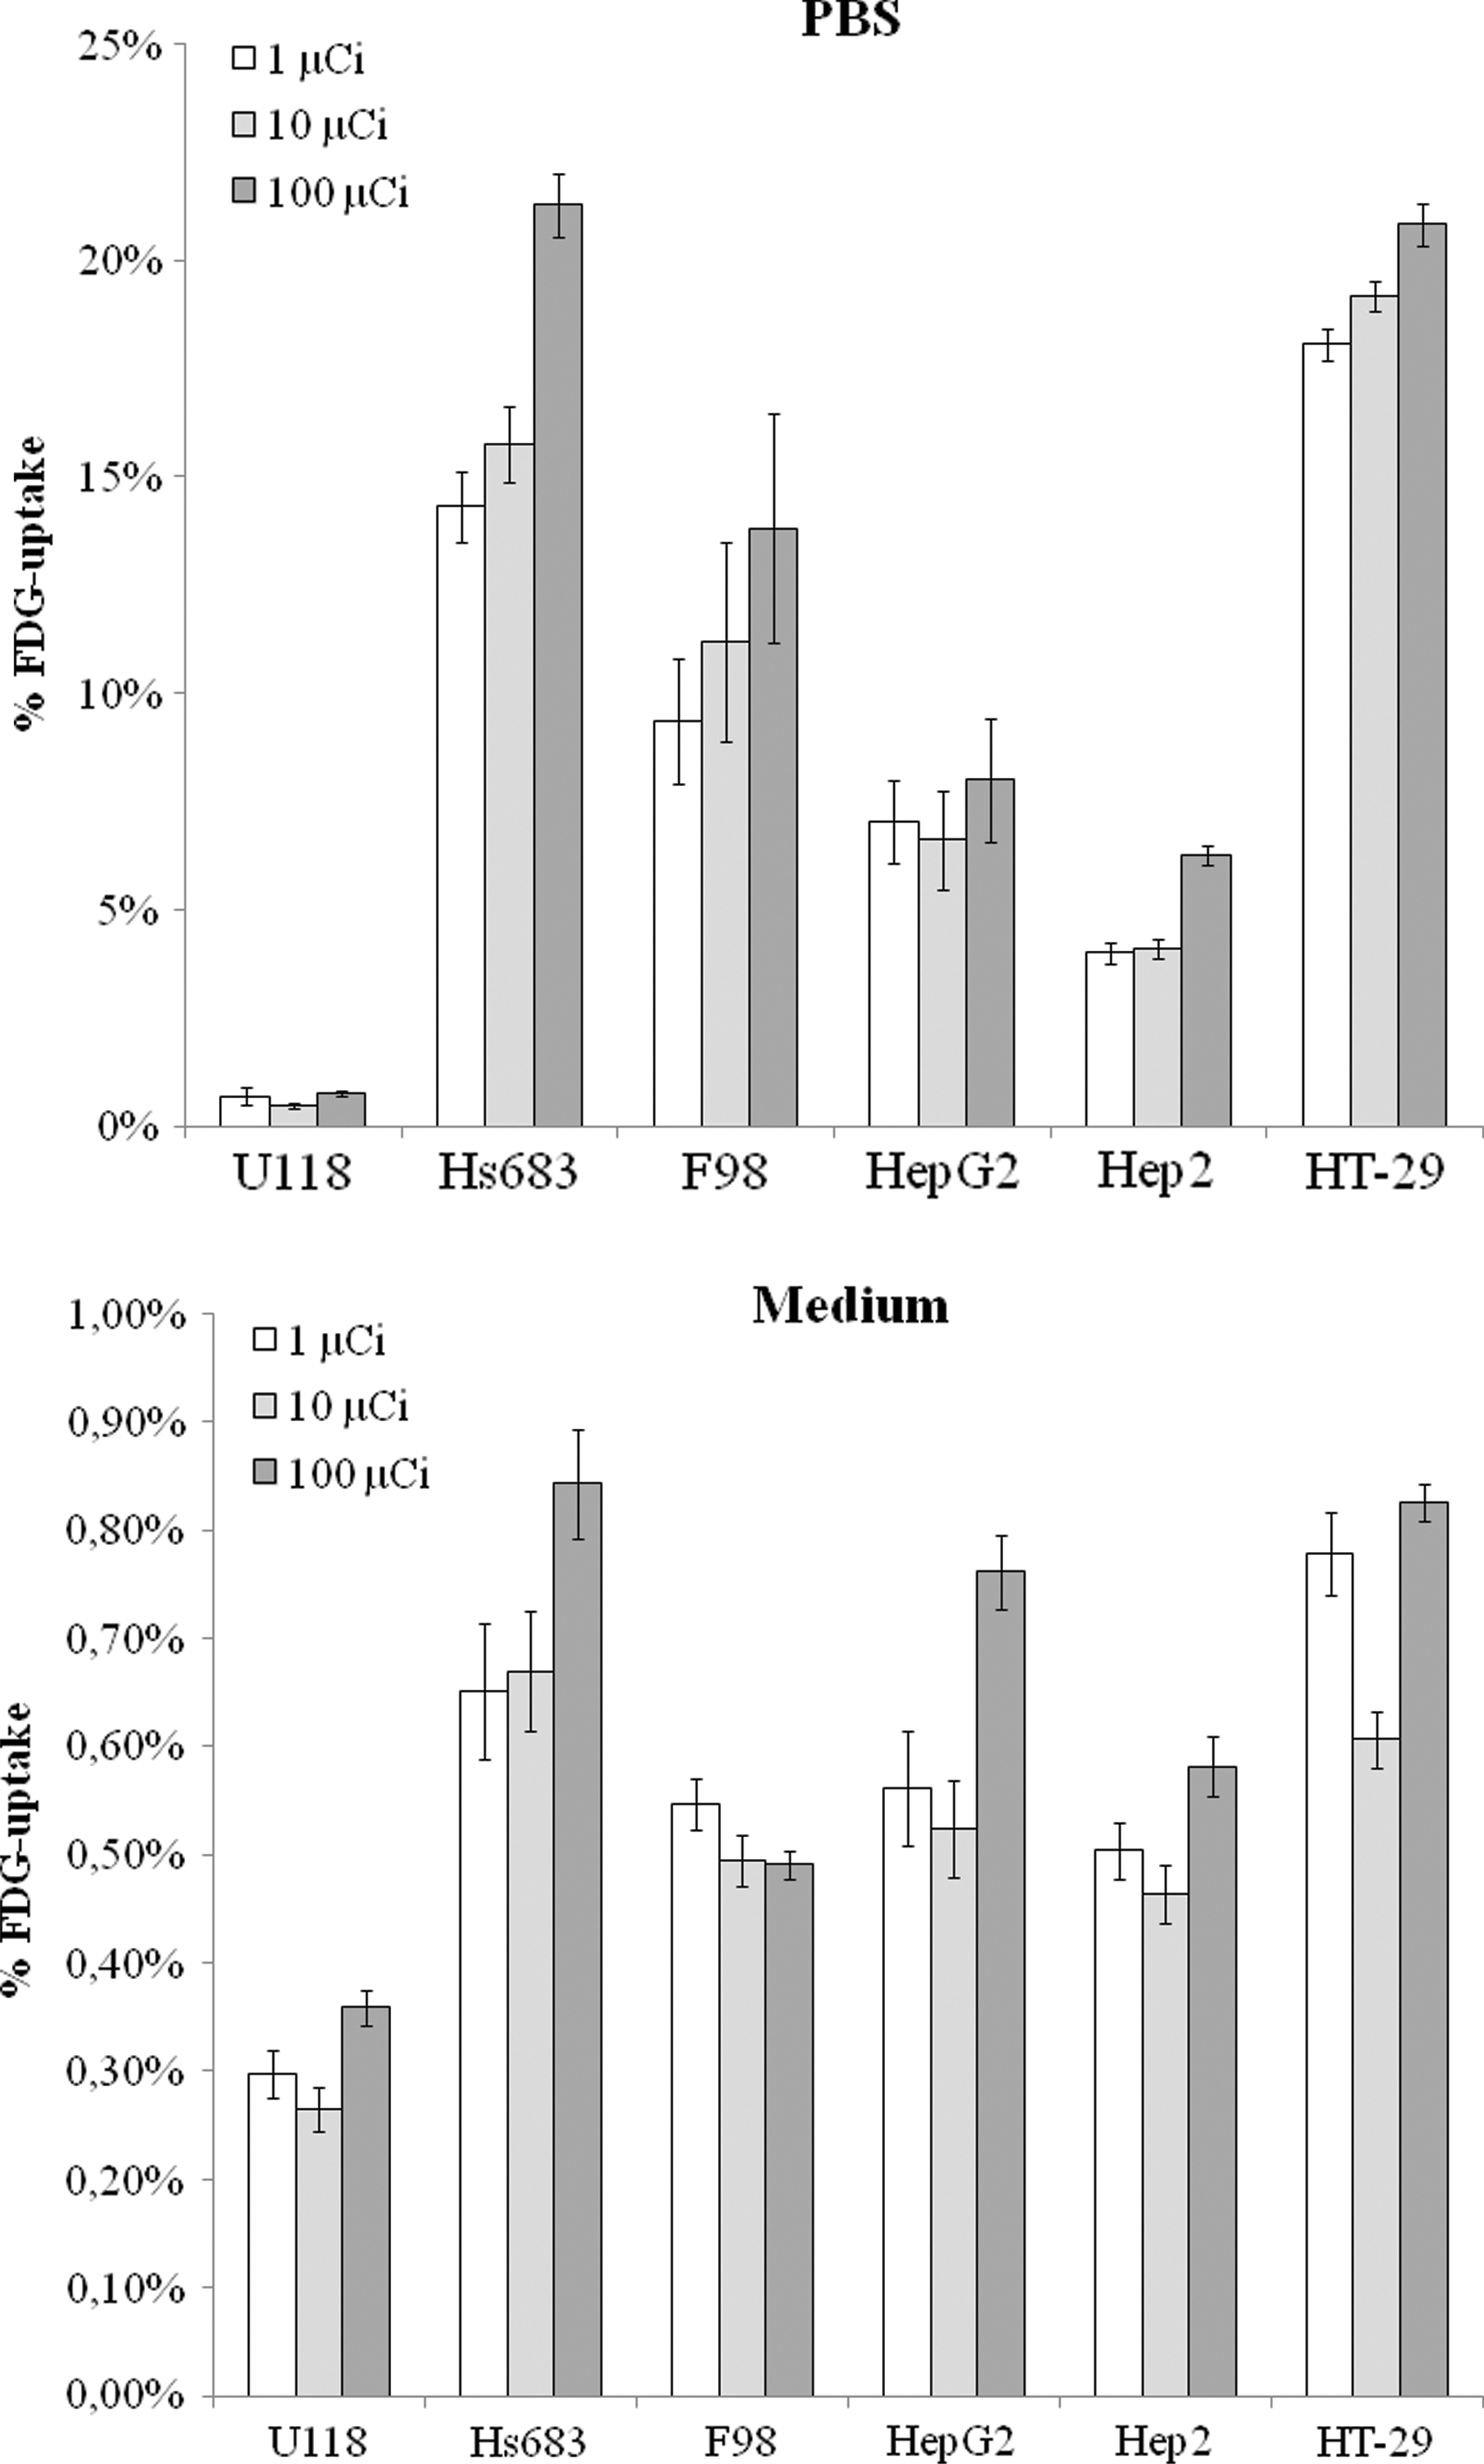
[18F]FDG-uptake in PBS and cell culture medium. Percentage of total administered activity retained in the cells is given for all situations. Results are expressed as the mean of three independent experiments with standard error of the mean.
Cell density
To test the influence of cell number on [18F]FDG-uptake we performed experiments with different cell concentrations and kept incubation time, medium, and activity constant. [18F]FDG-uptake was determined using 10 μCi of tracer in a PBS solution during 60 minutes. Results are summarized in Figure 5. We observed a trend toward lower uptake at higher cell concentrations except in the case of HepG2 cells where the effect was less pronounced. Further, there's a larger spread of uptake at lower cell concentrations (Fig. 5).
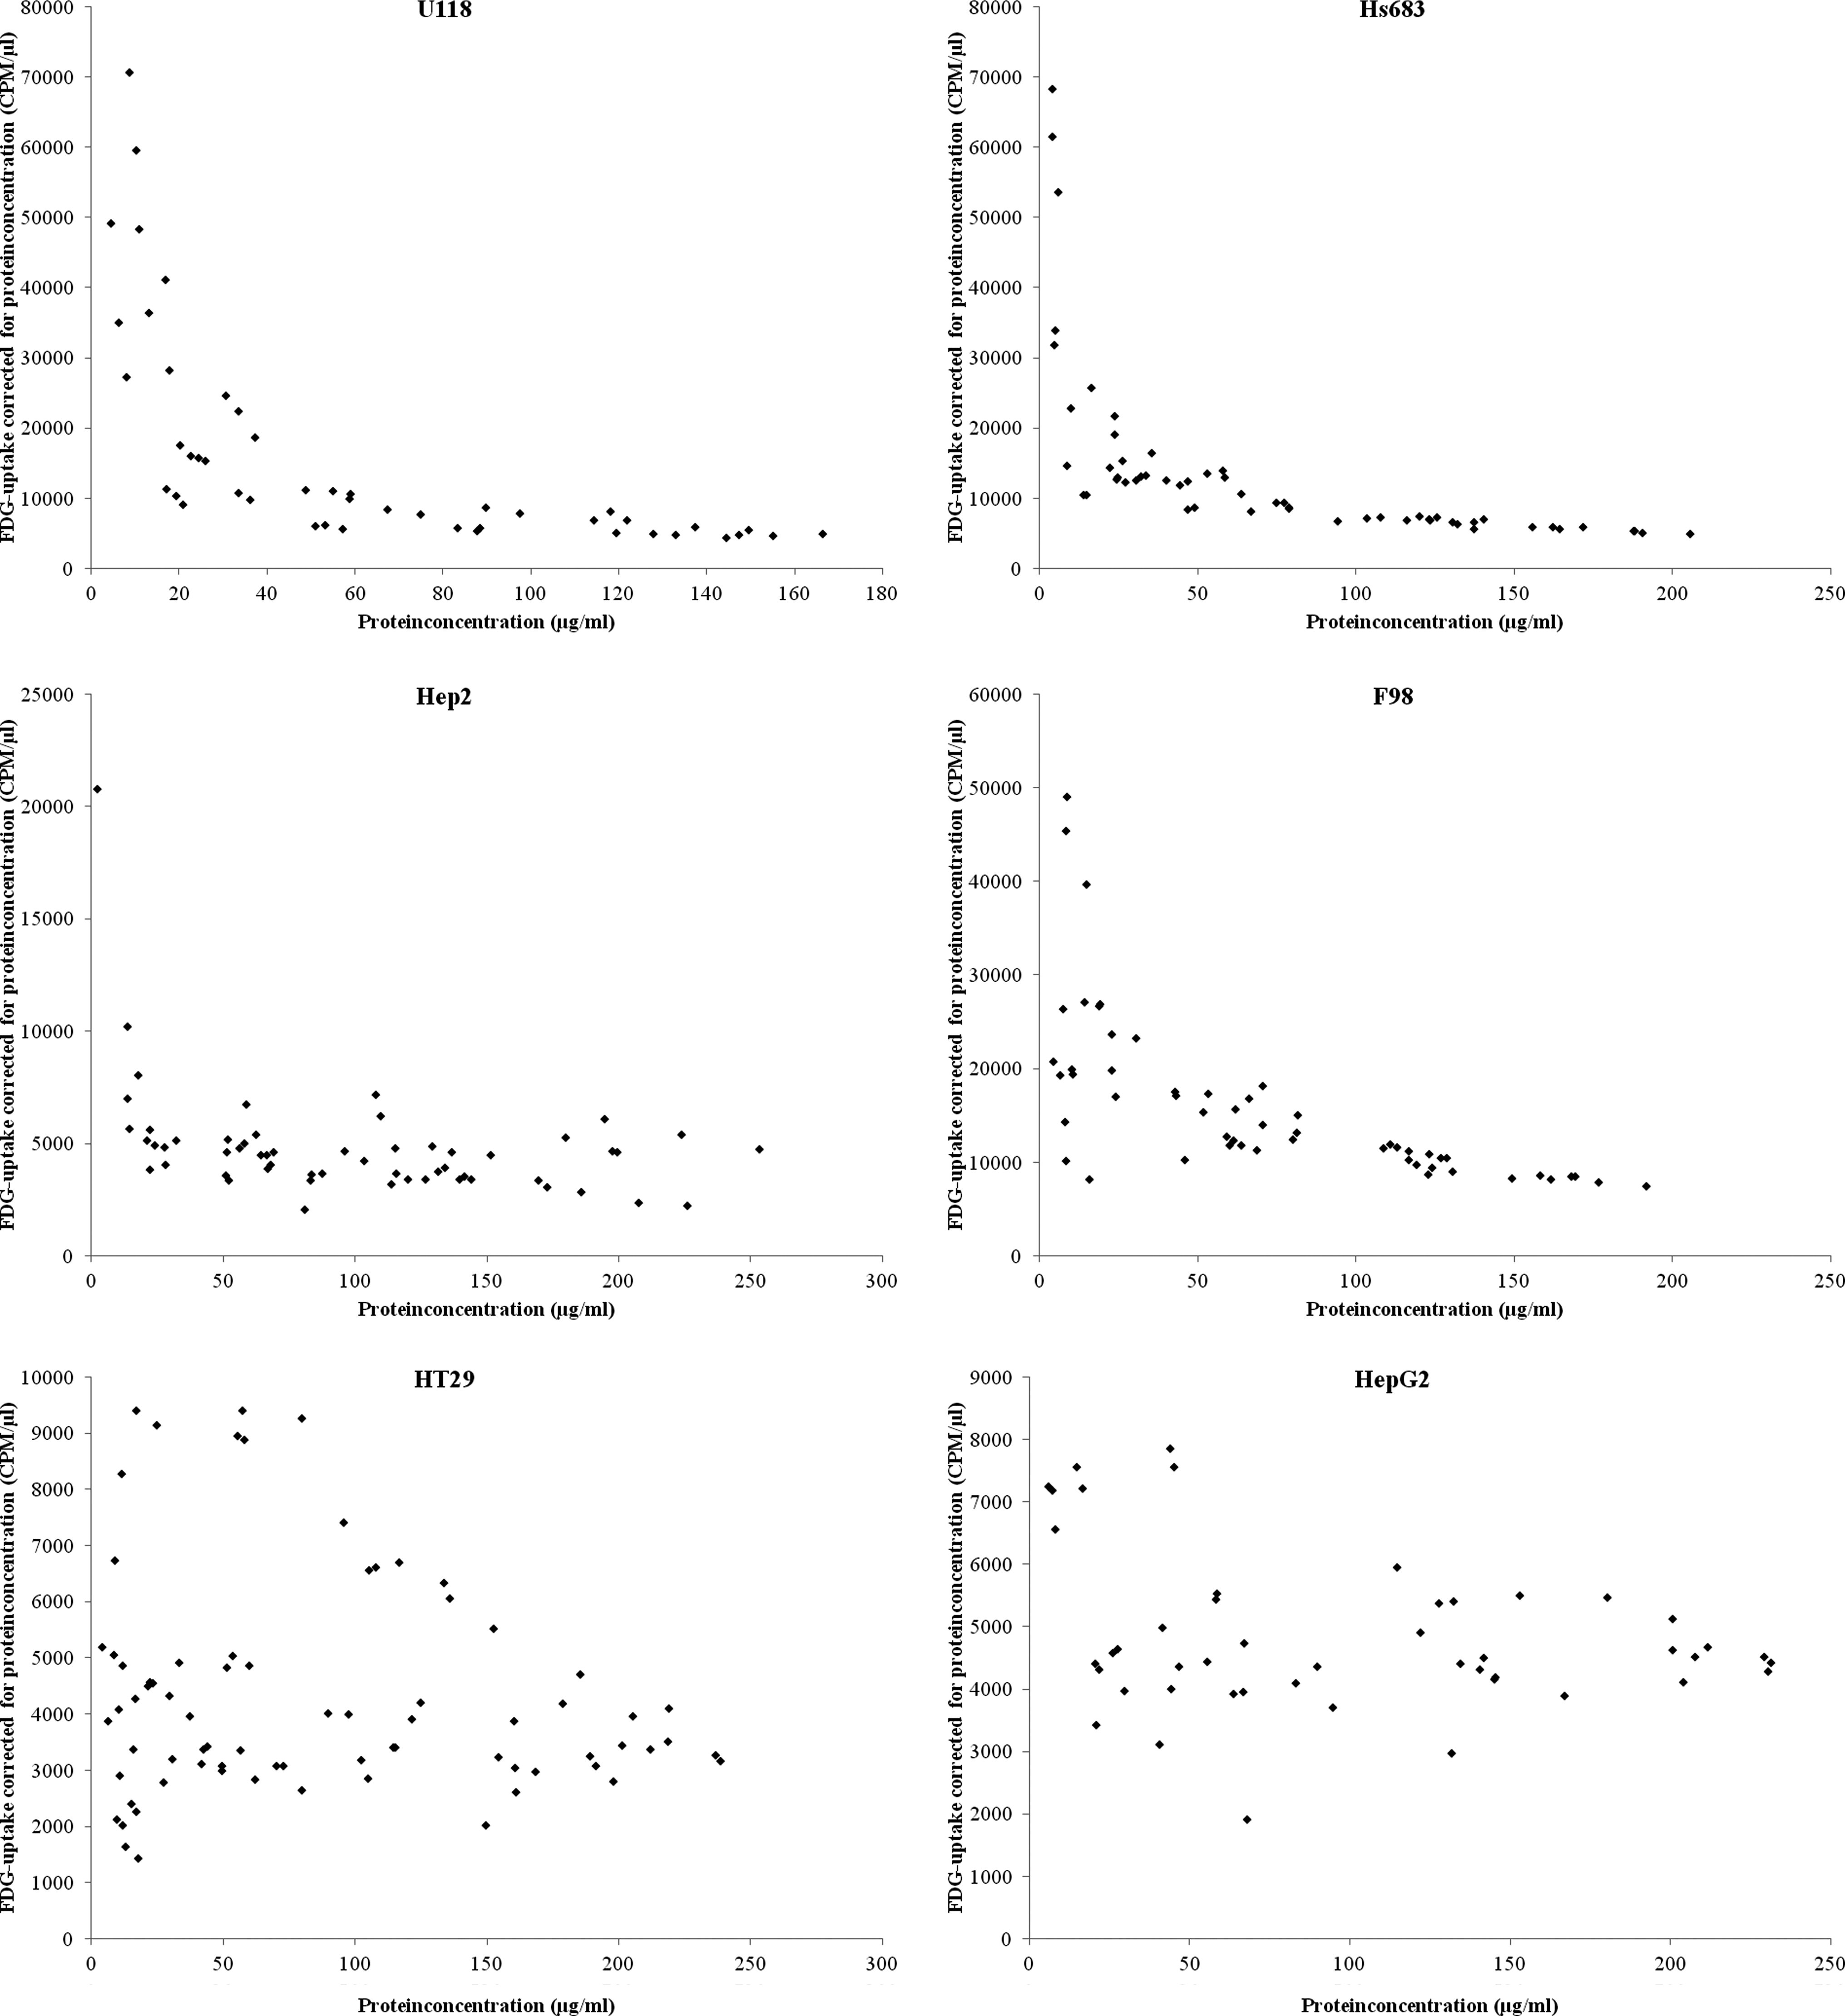
Influence of cell density on [18F]FDG-uptake. [18F]FDG-uptake at different cell concentrations is given. Results are expressed as counts per minute/protein concentration and given in a scatterplot with their corresponding total protein concentration for each well.
Immunocytochemical staining
To define the possible influence of GLUT1- and HKII-expression on [18F]FDG-uptake we stained cells at different cell concentrations (Fig. 6). Cells at higher cell concentrations appear to have less expression of both GLUT1 and HKII-proteins.
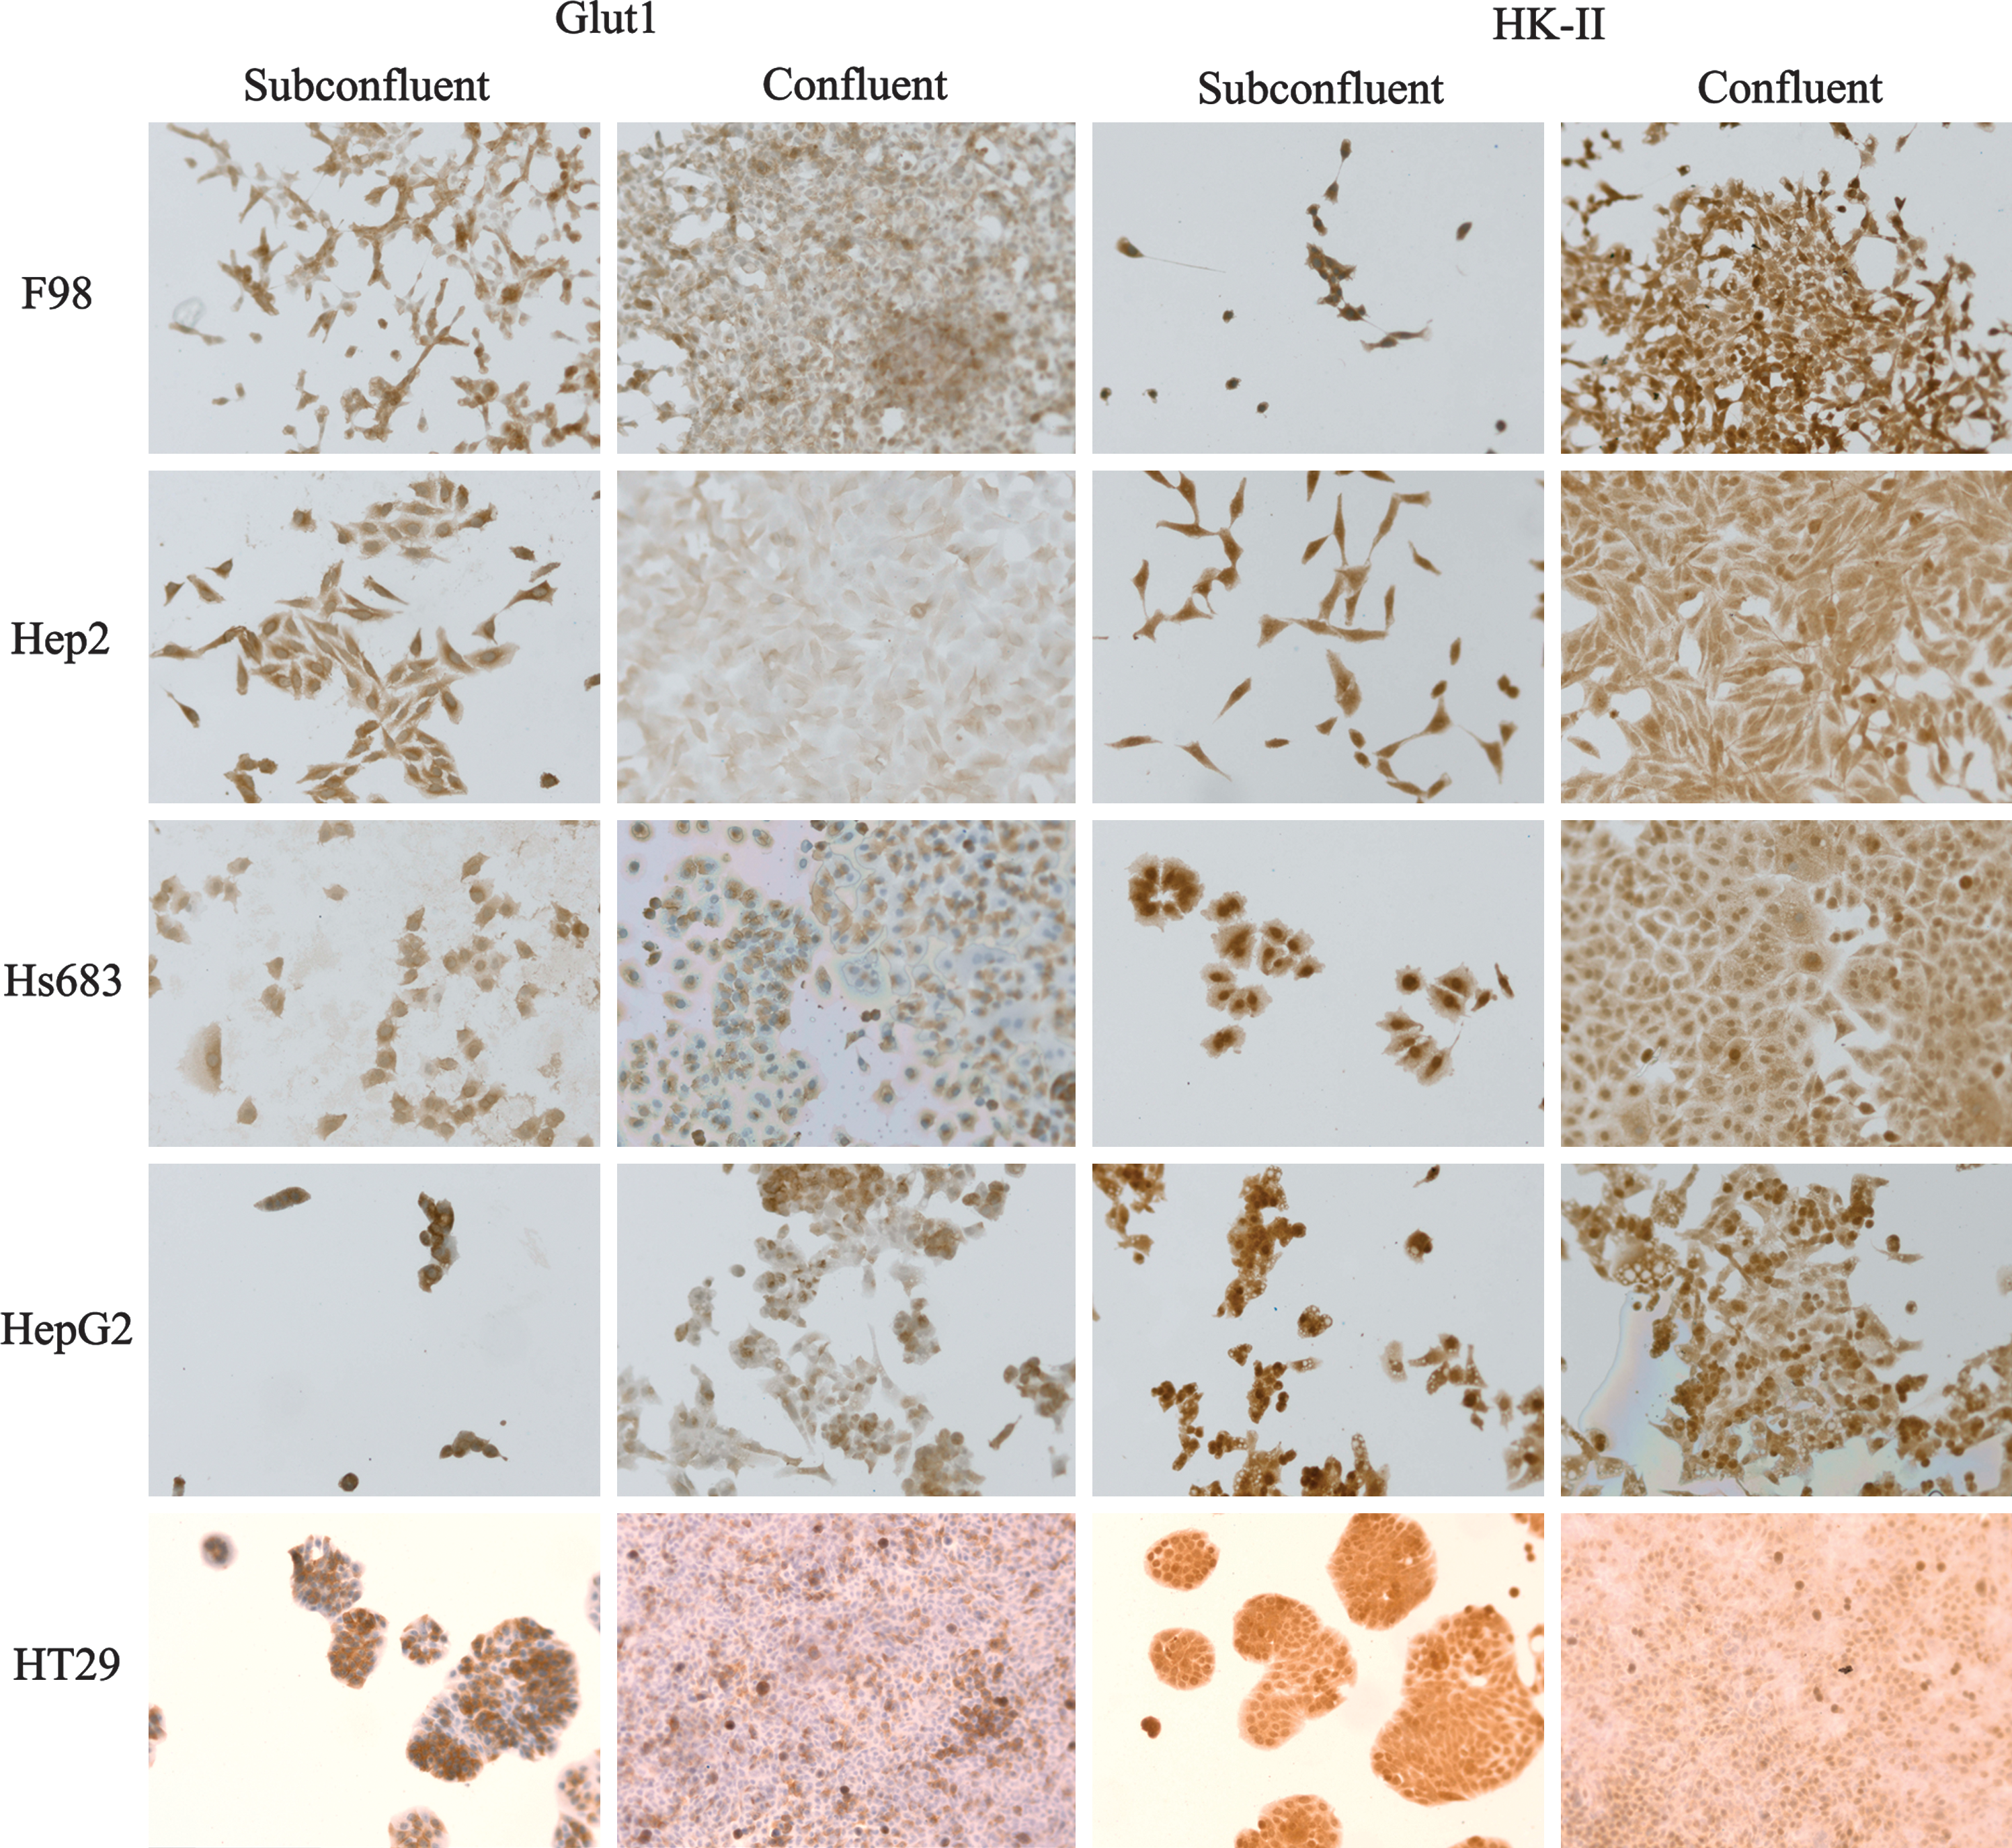
Immunocytochemical staining for Glut1 and HKII. Photographs (200×) of stained slides of five different cell lines (F98, Hep2, HepG2, Hs683, HT29) with confluent and subconfluent regions. Color images available online at
Discussion
This paper aims to describe important parameters which should be monitored and taken into account when conducting in vitro uptake experiments. Experiments were done using [18F]FDG but the concept and ideas can be extrapolated to other metabolic tracers. For example, standard incubation media such as DMEM, McCoy's, and RPMI contain certain amounts of methionine, tyrosine, and choline which are currently being investigated for their feasibility as radiopharmaceuticals.
Our results show that [18F]FDG-uptake increases over time in tumor cells in vitro. It has been previously shown that [18F]FDG linearly increases over time in tumor tissue in vivo. 4 The same pattern was seen in vitro in endothelial cells. 5 This could be explained by a nonsaturable uptake and phosphorylation or trapping mechanism, implying [18F]FDG-uptake increases over time until radioactive tracer is cleared from the blood in vivo or incubation medium in vitro. 6 These results could favor delayed imaging with [18F]FDG in the clinical setting, because of increasing tumor-to-normal ratios over time, assuming a higher increase in tumor cells, compared with normal or inflammatory tissue. 7,8 Further, experiments using dynamic scanning in different pathologies are promising to improve the discrimination between benign and malignant lesions, relying on the different uptake kinetics. 9
The procentual uptake of [18F]FDG was clearly influenced by the presence of glucose in incubation medium during uptake. It is recommended that patient fasts 6h before [18F]FDG administration and blood glucose levels are checked before tracer-injection and do not exceed 120 mg/dL. If we apply these recommendations on the in vitro set up, DMEM (glucose concentration of 100 mg/dL) is probably the most “physiological” culture medium for [18F]FDG uptake experiments.
In another experiment we investigated the influence on [18F]FDG-uptake with variable tracer activities. Both PBS and cell culture medium were used during incubation. We observed that slightly higher percentages of administered activity were retained when higher tracer activities were used. Results with PBS were slightly different from those with cell culture medium. Using cell culture medium, differences between the different tracer activities appear to be smaller. This is probably due to the levels of glucose which are present in the medium.
When [18F]FDG-uptake was quantified in experiments with varying cell concentrations, keeping incubation medium, time, and tracer activity constant, we saw a trend toward more reproducible and lower tracer-uptake at higher cell concentrations. Different uptake characteristics when comparing results obtained in HT29 and HepG2 cells with results obtained in the other cell lines can be explained by the growth characteristics of the HT29 and HepG2 cell lines. Monolayers of these cell cultures tend to grow together in clumps. This creates a heterogenous population of contact-inhibited cells in the center and proliferative, metabolically more active cells in the edges of these clumps. The other cell lines show a more homogeneous growth pattern with individual cells. Therefore it can be important to describe the growth characteristics of the tested cells when performing in vitro uptake experiments. A similar effect of cell density on uptake of labeled thymidine and [18F]FDG was described by Sasajima et al. in glioma cells. 6
To test whether differences in tracer uptake could be related to molecular changes in confluent cells we immunocytochemically stained different cell concentrations for two relevant metabolic proteins. Confluent cells appear to have lower immunocytochemical staining for GLUT and HKII compared with subconfluent cells. It is however very hard to define the exact ratio and rate-limiting step between the two systems involved in [18F]FDG-retention as mentioned in a review by Smith. 6,10 We assume that changes in one of the two investigated proteins can lead to increased/decreased tracer-uptake. Therefore a decreased [18F]FDG-uptake in higher cell concentrations can theoretically be explained by the effect of contact-inhibition with decreased metabolic activity of the cells. It remains however unclear whether this is the only parameter involved in the observed differences. Therefore, care should be taken to avoid very low cell concentrations because the spread of quantitative [18F]FDG-uptake increases toward lower cell concentrations. Further we believe that when one wants to analyze the effect of test substances on tracer uptake, an uptake curve for different cell concentrations should be used as control.
Conclusions
We observed a clear impact of all tested parameters like incubation time and medium, tracer activity, and cell density on the uptake of [18F]FDG. To yield similar results over several days, a constant tracer activity should be administered in either PBS or cell culture medium, although medium appears to be the method of choice. When one wants to analyze the effect of therapy on tracer uptake care should be taken in standardizing environmental conditions such as tracer activity and incubation time and medium. Corrections for cell density should be performed using a standardized uptake curve for different cell concentrations.
Footnotes
Disclosure Statement
The authors declare they have no competing interests.