
Abstract
MicroRNAs are closely linked to tumor metastasis and let-7a may play a role in inhibiting the proliferation, invasion, and metastasis of lung cancer. In vitro, we aim to observe the impact of let-7a on the proliferation and invasion of the nonsmall cell lung cancer cell line 95D by constructing a lentiviral vector that expresses let-7a. Cell proliferation assays and Transwell experiments were used to compare the proliferation and invasion of the 95D cell group with let-7a overexpressed or inhibited. Real-time polymerase chain reaction and immunoblotting analysis were used to compare the expression of K-RAS and HMGA2 at mRNA and the protein level in the above groups. The results showed the cells in the let-7a overexpressed group were significantly less proliferative and invasive than those in the let-7a inhibited group (p<0.05). K-RAS and HMGA2 mRNA levels were significantly higher in the let-7a overexpressed group than those in the let-7a inhibited group (p<0.05). However, the protein levels of K-RAS and HMGA2 were significantly lower in the let-7a overexpressed group than those in the let-7a inhibited group (p<0.05). We suppose that let-7a inhibits the proliferation and invasion of the cell line 95D by regulating the translation of K-RAS and HMGA2 mRNA, not the transcription of the mRNA itself.
Introduction
Invasion and metastasis are the major biological characteristics of malignant tumors. Studies have shown that micrometastases or clinically detectable metastases could be found in approximately 30% to 50% of cancer patients during the discovery of their primary tumors. 1 Tumor invasion and metastasis have been shown to lead to the death of cancer patients. 2 Lung cancer is the leading cause of cancer death both in China and Western counties. 3 Although significant therapeutic improvements have been made in recent years, the prognosis of lung cancer is poor. Because lung cancer can metastasize early during the course of disease, preventing the invasion and metastasis of cancerous cells could help to lower the morbidity and mortality of this disease.
The mechanisms of invasion and metastasis have become a major focus of interest and research in cancer biology, and knowledge of these mechanisms could lead to new targets for the prevention of tumor metastasis. 4,5 Although drug research is ongoing, current therapeutic measures are mainly directed at disrupting a certain step of tumor metastasis. However, tumor invasion and metastasis are multistep processes. Current therapies that target a specific step in metastasis have been demonstrated to be either effective or ineffective in numerous clinical trial results. 4 Since there is still no effective means for controlling tumor cell invasion and metastasis, an in-depth exploration of the regulatory mechanisms involved in tumor metastasis would be conducive to finding more effective ways to control metastasis.
MicroRNAs (miRNAs) are 22-nucleotide-long endogenous single-stranded noncoding RNAs that are transcribed from genome and regulate gene expression by binding to its target mRNA to regulate protein expression at the post-transcriptional level. Studies have increasingly shown that miRNAs are directly involved in the formation of human tumors, such as lung cancer, breast cancer, craniocerebral cancer, liver cancer, colorectal cancer, and lymphoma. MiRNAs play important roles in carcinogenic processes, including proliferation, apoptosis, development, and cellular differentiation by functioning as either tumor suppressors, oncogenes, or both. 6 –9 Recent studies have also found that miRNAs are closely linked to tumor metastasis and are involved in the regulation of tumor cell proliferation, cell adhesion and invasion, distant metastasis, angiogenesis, metastasis-related molecules, and signaling pathways.
Let-7 was the first family of miRNAs discovered and was shown to regulate the expression of the oncogene RAS. 10 At present, a large number of in vivo and in vitro experiments have confirmed that the let-7 family functions to inhibit tumor cell proliferation. 11 In humans, the let-7 family contains 12 miRNAs, including let-7a. Let-7a has been closely linked to the prognosis of lung cancer patients. Low levels of the let-7a miRNA usually indicate a low patient survival rate, 12,13 which suggests that let-7a may play a role in inhibiting lung cancer cell proliferation, invasion, and metastasis. Let-7a target genes include the RAS family, the high-mobility group A (HMGA2), c-Myc, and the cell cycle regulation factors, such as cell division cycle 25A (CDC25A), cyclin-dependent kinase 6 (CDK6), and Cyclin D2. Of these, the RAS family of proteins promotes cell proliferation, and HMGA2 is involved in cell proliferation and differentiation. 14
By performing a miRNA genechip analysis on the highly metastatic nonsmall cell lung cancer cell line 95D, we have previously shown that let-7a is closely linked to lung cancer cell invasion and metastasis. 15 Based on this knowledge, the current study examines the impact of let-7a on the proliferation and invasion of the nonsmall cell lung cancer cell line 95D and discusses its possible mechanisms of action. Our results provide experimental evidence for the inclusion of miRNA-based targeted therapies in the clinical treatment of lung cancer.
Materials and Methods
Construction of lentiviral vectors
Two interference sequences, Hsa-let-7a-mimics (sequence: AGGUAGUAGGUUGUAUAGUU) and Hsa-let-7a-inhibitor (sequence: ACUAUACAACCUACUACCUCA), were designed for the let-7a gene (Sanger miRBase,
Detection on titer of lentivirus
When the 293T cells were at 80%–90% confluence, they were washed with the D-Hank's solution, placed, and pipetted up and down to create a single-cell suspension. The single-cell suspension was counted using a blood cell counting chamber and diluted to 3×10⁵ cells/mL. Cells were plated in 96-well plates at a concentration of 3×10⁴ cells/well, mixed evenly, and then cultured at 37°C with 5% CO2 for 24 hours. The lentiviral solutions were serially diluted with 10% fetal bovine serum (FBS)/Dulbecco's modified Eagle's medium (DMEM) culture solution for 1:10, 1:100, 1:1000, and 1:10000, respectively, and 100 μL diluted lentiviral solution was added to each well after the culture media was discarded. The negative control group was set at the same time. Cells were cultured at 37°C with 5% CO2 for 24 hours. After the virus solution was removed, 150 μL 10% FBS/DMEM culture solution was added to each well and incubated at 37°C with 5% CO2 for an additional 48 or 72 hours. Virus titer was calculated by counting the number of fluorescent cells and correcting for the dilution factor.
Infection test of target cell
When the 95D cells (Cell Bank of Shanghai Institutes for Biological Sciences) were at 80%–90% confluence, they were washed with the D-Hank's solution, placed, blown, and beat into single-cell suspension. The single-cell suspension was counted using a blood cell counting chamber and diluted to 3×10⁵ cells/mL. Cells were plated in 6-well plates at a concentration of 3×10⁵ cells/well and were cultured at 37°C with 5% CO2 for 24 hours. Twenty multiplicity of Infection (MOI) of virus was added to each well after the culture media was discarded. The negative control group was set at the same time. Cells were cultured at 37°C with 5% CO2 for 24 hours. The lentiviral infection results were observed with a fluorescence microscope, and the infection efficiency was determined by a visual comparison of the fluorescent cells and white blood cells.
RNA extraction and real-time polymerase chain reaction
According to the types of lentiviral vector diverted into, 95D cells were divided into the let-7a overexpressed group (diverted into the let-7a-mimics lentiviral vector) and the let-7a inhibited group (diverted into the let-7a-inhibitor lentiviral vector) and the negative control group (diverted into empty vector). RNA was extracted from the infected cells of each group using an RNA extraction kit (Invitrogen) according to the manufacturer's protocol. Reverse primers and DEPC-treated H2O was added to the RNA template, and the mixture was incubated at 70°C for 5 minutes and quickly placed on ice. The reaction was then supplemented with 5× reaction buffer, 10 mM dNTPs and MMLV RTase, RNase H Minus. The reaction was incubated at 42°C for 45 minutes, and then incubated at 85°C for 10 minutes. The primers (GenePharma) used in the polymerase chain reaction (PCR) reaction are as follows: let-7a F primer CGATTCAGTGAGGTAGTAGGTTGT, let-7a R primer TATGGTTGTTCTG CTCTCTGTCTC; K-RAS F primer GTAGTTGGAGCTGGT GGCGTAG, K-RAS R primer TGACCTGCTGTGTCGAGA ATATCC; HMGA2 F primer CTCAAAAGAAAGCAGAAG CCACTG, and HMGA2 R primer TGAGCAGGCTTCTTCTG AACAACT. The PCR reactions were incubated at 95°C for 3 minutes, 95°C for 30 seconds, and 62°C for 40 seconds for 40 cycles. The reaction products were detected by gel electrophoresis with a 2% agarose gel. The amplified let-7a, K-RAS, and HMGA2 fragments were 83, 161, and 91 bp, respectively. The relative expression value of each target gene was calculated using the
Immunoblotting
After the above cells in each group were completely split and lysed, 5 μL 2×sodium dodecyl sulfate–polyacrylamide gel electrophoresis (SDS-PAGE) loading buffer was added. Samples were heated to 100°C for 5 minutes, cooled on ice, and then centrifuged at 12,000 g for 10 minutes. The samples were separated on a 10% SDS-PAGE gel, and the sample volume of each well was 20 μL. After electrophoresis, proteins were transferred using the Semi-Dry Cell system (Junyi) at 30 mA for 60 minutes. After the transfer, blots were stained with 1× Ponceau S solution (Sigma), and the positions of the protein marker were labeled. Blots were incubated with the blocking buffer (1× Tris-buffered saline+0.1% Tween-20+5% w/v nonfat dry milk), and then washed with Tris-buffered saline tween-20 (TBST); a primary antibody, anti-KRAS (1:50, Santa Cruz Biotechnology, sc-30), or anti-HMGA2 (1:80, Cell Signaling Technology, #5269) was added and incubated overnight at 4°C. After being washed, the HRP-conjugated secondary antibody (1:2000; Jingmei Biotech) was added and incubated at room temperature for 2 hours, and the blots were then washed again. Chemiluminescent detection was carried out using the SuperSignal West Pico Chemiluminent Substrates (Pierce), and the blots were exposed to X-ray film (Guanlong photo). The molecular weight of K-RAS is 21kD, and the weight of HMGA2 is 18kD. Following development, the film was captured with a gel imaging analysis system and analyzed with the Gel-Pro Analyzer software.
Cell proliferation assay (CCK8 detection)
The cells were washed with the D-Hank's solution, placed, and pipetted up and down to create a single-cell suspension after overnight culture. The single-cell suspension was counted using a blood cell counting chamber and was diluted to 3×10⁵ cells/mL. Cells were seeded in 96-well plates at a concentration of 5×10⁴ cells/well, and the negative control group was set at the same time. Each group was replicated five times, and the cells were cultured at 37°C with 5% CO2 after being spread evenly. At culture time of 0, 24, 48, 72, or 96 hours, 10 μL CCK8 (DOJINDO) was added to each well and cultured in the dark for 4 hours, respectively. The OD value was determined with an enzyme-linked immunosorbent assay reader at a wavelength of 490 nm.
Cell invasion assay (transwell experiment)
After infection, the 95D cells were seeded onto the Transwell chamber (Corning) whose basement membrane was coated by diluted Matrigel (Becton Dickinson) at a concentration of 5×10³ cells/well. The culture medium containing 20% serum (700 μL) was added to the lower chamber. After growing for 48 hours at 37°C with 5% CO2, the chamber was removed, and then washed with phosphate-buffered saline, fixed in methanol, and washed again. After being inverted and air-dried, the chamber was then placed into a 24-well plate containing 200 μL 0.1% crystal violet. The membrane was submerged and stained for 30 minutes at 37°C. The dried chamber was placed into the well after being washed. Five visual fields were randomly selected and observed under an inverted microscope; the number of cells that passed through the membrane was counted.
Statistical data analysis
After examining the normality of data, the data are expressed as the means±standard deviation (
Results
Comparison of let-7a Expression in Different 95D Cell Groups after Lentiviral Infection
The sequencing results of Hsa-let-7a-mimics and Hsa-let-7a-inhibitor are shown as Table 1. RT-PCR results of the let-7a relative expression in the negative control group, the let-7a inhibited group, and the let-7a overexpressed group are shown in Figure 1A and Figure 2. When compared with the negative control group, let-7a expression was downregulated 0.39-fold in the let-7a inhibited group (range 0.33–0.46), while the expression was upregulated 3.44-fold in the let-7a overexpressed group (range 3.04–3.90); and the difference was significant (p<0.05).

Negative Control Group; ▪ Let-7a Inhibited Group;  Let-7a Overexpressed Group; *Compared with the negative control group, p<0.05; #Compared with the let-7a inhibited group, p<0.05.

The images of let-7a, K-RAS and HMGA2 mRNA and protein expression in each cell group. 1: Negative Control Group; 2: Let-7a Inhibited Group; 3: Let-7a Overexpressed Group.
Impact of let-7a on the Proliferation of 95D Cells
The proliferation of 95D cells was reflected by the OD values at each time point; the larger OD values indicated more active cell proliferation. The results showed that the difference in OD values between the negative control group and the experimental let-7a inhibited or let-7a overexpressed groups was significant at 24, 48, 72, and 96 hours after culture (p<0.05, Fig. 3).
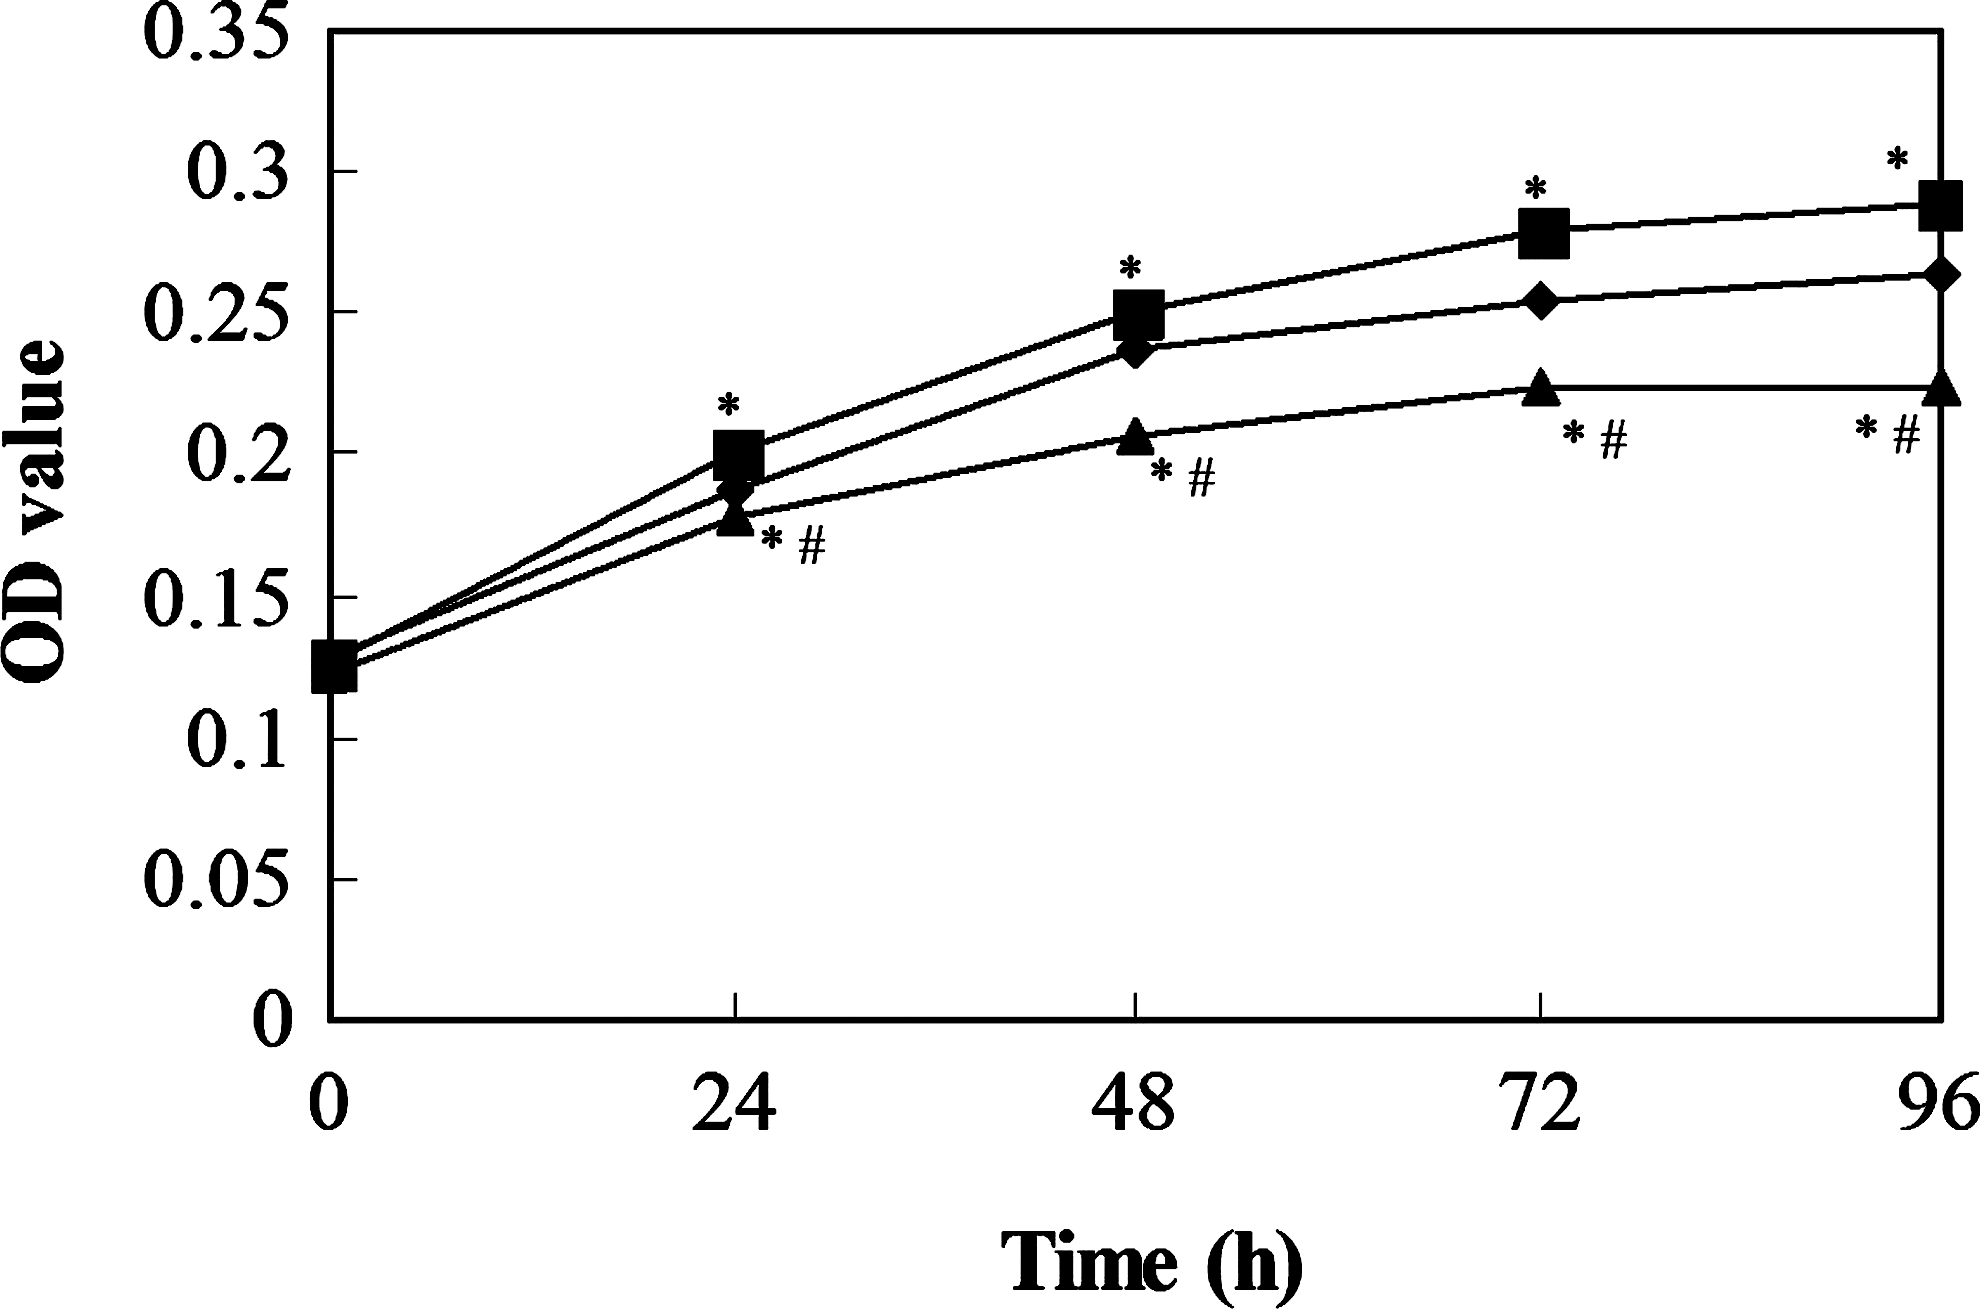
The proliferation curve of cells in each group at different time points.
Impact of let-7a on the invasion of 95D cells
Cell invasion was determined by calculating the number of 95D cells that passed through the Transwell membrane; a higher number of cells that passed through the membrane indicated stronger cell invasiveness. The results suggested that the cells in each group can pass through the upper membrane, but only a small fraction of cells in the let-7a overexpressed group passed through the membrane. Five visual fields of cells from each group were randomly selected, and the number of cells that passed through the membrane was counted. The negative control group showed (84.00±4.95) cells passed through the membrane, whereas the let-7a inhibited group and the let-7a overexpressed group had (123.60±5.82) and (40.40±6.15) cells, respectively. The difference between the groups was significant (p<0.05; Fig. 4).

Comparison of K-RAS and HMGA2 gene expression in different 95D cell groups at the mRNA and protein levels
K-RAS expression
RT-PCR results of the K-RAS relative expression in the negative control group, the let-7a inhibited group, and the let-7a overexpressed group are shown in Figure 1B and Figure 2. When compared with the negative control group, the K-RAS mRNA level in the let-7a inhibited group was downregulated 0.41-fold (range 0.35–0.48), while the K-RAS mRNA level in the let-7a overexpressed group was upregulated 1.09-fold (range 0.92–1.30); and the difference was significant (p<0.05, Fig. 1B and Fig. 2).
K-RAS protein levels were analyzed by immunoblotting and the densitometric analysis showed that relative expression of K-RAS at the protein level in the negative control group, the let-7a inhibited group, and the let-7a overexpressed group was (0.731±0.002), (0.755±0.004), and (0.550±0.019), respectively; and the difference among the groups was significant (p<0.05, Fig. 1B and Fig. 2). The ratio of protein to mRNA for K-RAS showed that let-7a overexpression actually results in decreased protein levels (Fig. 1D).
HMGA2 expression
RT-PCR results of the HMGA2 relative expression in the negative control group, the let-7a inhibited group, and the let-7a overexpressed group are shown in Figure 1C and Figure 2. When compared with the negative control group, the HMGA2 mRNA level in the let-7a inhibited group was downregulated 0.18-fold (range 0.14–0.23), while the HMGA2 mRNA level in the let-7a overexpressed group was upregulated 39.31-fold (range 32.51–47.52); and the difference was significant (p<0.05, Fig. 1C and Fig. 2).
HMGA2 protein levels were analyzed by immunoblotting, and the densitometric analysis showed that the relative expression of HMGA2 at the protein level in the negative control group, the let-7a inhibited group, and the let-7a overexpressed group was (0.812±0.008), (1.059±0.013), and (0.583±0.023), respectively; and the difference among the groups was significant (p<0.05; Fig. 1C and Fig. 2). The ratio of protein to mRNA for HMGA2 showed that let-7a overexpression actually results in decreased protein levels (Fig. 1D).
Discussion
At present, there are two methods commonly used to regulate miRNA expression levels. One method is to design an efficient expression vector, which effectively introduces a large number of miRNAs and stably expresses them in a particular cell. The other method is to design a complementary antisense oligonucleotide to inhibit the function of the miRNA. 16
In this study, we constructed lentiviral vectors that expressed either Hsa-let-7a-mimics or Hsa-let-7a-inhibitor. We confirmed that we could efficiently infect the 95D cell line (∼95%) when the titer of the lentiviral solution was 1×10⁸ TU/mL, which met the test requirements. Additionally, in 95D cells that were infected with lentivirus, the expression of let-7a mRNA was detected by real-time PCR. The results showed that 95D cells expressing Hsa-let-7a-mimics could successfully express high levels of let-7a mRNA, while 95D cells expressing the Hsa-let-7a-inhibitor could significantly inhibit the expression of let-7a. The expression of Hsa-let-7a-mimics was 8.6 times higher compared with the Hsa-let-7a-inhibitor. The results indicated that the construction of the lentiviral vector was successful and could be used as an experimental method for regulating let-7a expression.
To metastasize, primary tumors generally go through several steps, such as metastasis actuation (including tumor cell invasion, bone marrow mobilization, angiogenesis, and epithelium metastasizing to matrix), the progress of metastasis (including vascular remodeling, immune evasion, and cell overflow), and metastasis completion. 1 It has now been confirmed that many genes are involved in tumor metastasis, and miRNAs may regulate tumor metastasis by regulating the expression of various genes.
Previous studies have shown that the inhibited function on tumor proliferation of let-7 family members varies with the cell lines or animal models used 11,12,17 ; this suggests that the different functions of the let-7 family members may relate specially to the target genes they regulate. Therefore, the highly metastatic nonsmall cell lung cancer cell line 95D was used as the research object in our study, and the results of the CCK8 detection and Transwell experiments showed that high levels of let-7a could effectively inhibit 95D cell proliferation and invasion in vitro.
Among the numerous target genes of the let-7 family members, K-RAS and HMGA2 are the two important ones. The let-7 family inhibits the expression of RAS and HMGA2. 10,14,18,19 Johnson et al. 10 found that the three prime untranslated regions (3' UTRs) of the three RAS genes in humans have multiple putative binding loci (LCSs) complementary to let-7. These LCSs are similar to the LCS of C. elegans, and these LCSs are conservative in rodents, aquatic animals, and fish, suggesting that they are related to the function of the RAS genes. Inhibiting let-7 expression in HeLa cells may increase the expression of RAS; this observation led to the discovery that RAS mRNA is the functional target of the let-7 family and that RAS expression is negatively regulated by let-7 miRNA. The inhibitory effects of let-7 on cell proliferation and metastasis may result from the miRNA binding to the LCS to inhibit translation of the RAS protein. 10 To explore the possible molecular mechanisms by which the let-7a miRNA impacts 95D cell proliferation and invasion, K-RAS and HMGA2 mRNA and protein levels were analyzed at the same time. The results showed that high levels of let-7a could significantly inhibit K-RAS protein translation in addition to their inhibition on cell proliferation and invasion of the 95D cell line. This finding suggests that the inhibition of cell proliferation and invasion from expression of let-7a may be partly achieved through RAS signaling.
As a protein of high mobility, HMGA2, which codes for a high-mobility group of proteins was found to represent a major prooncogenic target of let-7 18,19 and is closely related to carcinogenesis. HMGA2 is overexpressed in lung cancer, but is expressed in very low levels in normal tissues. 20 Lee et al. found that there are multiple let-7 binding loci in the 3′ UTR of HMGA2 and that HMGA2 may escape let-7-mediated regulation if its 3′ UTR is lost. 14 The binding of let-7 to the 3′ UTR of HMGA2 was also shown by Mayr et al. 18 Our results show that high levels of let-7a could inhibit HMGA2 expression at the protein level, similar to its effects on K-RAS expression. This finding suggests that HMGA2 also plays an important role in the mechanism of let-7a inhibition.
Interestingly, our results also showed that K-RAS and HMGA2 mRNA levels were high, while the protein levels were low with let-7a overexpression; and mRNA levels for these two genes were low, while protein levels demonstrated relative elevation with let-7a inhibition. In consideration of the significantly higher K-RAS and HMGA2 mRNA levels following let-7a overexpression, let-7a overexpression actually results in decreased protein levels, which has been clearly revealed by the ratio of protein to mRNA for K-RAS and HMGA2. As post-transcriptional regulators of protein synthesis, miRNAs can regulate mRNA translation or stability in the cytoplasm. 21 Several molecular mechanisms, including deadenylation, repression of initiation of translation, inhibition of elongation or mRNA cleavage, have been evocated for miRNA-mediated post-transcriptional gene repression. In some cases, miRNA can also relocalize target mRNA to cytoplasmic foci called P-bodies for storage or degradation. 22 In addition to miRNA target sites that the HMGA2 gene contained, there are 10 AUUUA sequence motifs of AU-rich element (ARE) in the 3’UTR of HMGA2 that have been assumed to play a role in the destabilization of HMGA2 mRNA regulated by let-7. 23 Previous study has shown that RAS protein levels correlated poorly with RAS mRNA levels, but very well with let-7 levels, suggesting that the expression of the RAS is significantly influenced at the level of translation. 10 Our results of the inconsistencies between the mRNA and protein levels for K-RAS and HMGA2 indicate that let-7a regulates the two genes at a post-transcriptional level, which is consistent with the mechanism of miRNAs. On the other hand, the absence of mRNA–protein correlation for a subset of investigated genes suggests that the relation between mRNA and a protein is not strictly linear, but has a more intrinsic and complex dependence, deviating from the classical view referred to as the molecular dogma. 24 The quantitative relationship between a mRNA and its encoded protein is far from entirely known. 24 Even with the best available techniques, the discrepancy between mRNA and protein abundances still remains profound. 25 It has been proposed that translational regulation, differences in protein in vivo half-lives, and the systematic measurement errors, including differences with respect to the experimental conditions have been proposed to be the three potential reasons for the lack of a strong correlation between mRNA and protein expression levels. 26,27 Different regulation mechanisms (such as synthesis and degradation rates), acting on both the synthesized mRNA and the synthesized protein, affect the amount of the two molecules differentially. 28
Our findings highlighted the potential utility of miRNA let-7a as a promising therapeutic target to treat lung cancer. In addition to the first in vivo study performed on several mice models of lung cancer which demonstrated a significant reduction in lung tumors after let-7 overexpression using a lentiviral vector, 11 Trang et al. 29 also showed the efficacy in reducing tumor burden by systemically delivering let-7a mimics using a neutral lipid emulsion to mice with lung cancer. However, the development of miRNA-based therapeutics remains complicated as there are several challenges, including tissue-specific delivery, efficient cellular uptake and minimization of systemic toxicity and off-target effects. 30 Further in vivo miRNA-based delivery studies are required to evaluate long-term local and systemic toxicity and target gene effects before clinical application.
This study has some limitations, which need to be improved in further research. First, the difference of miRNA let-7a expression associated with different lung cancer classification was not analyzed. Recently, a large set of miRNAs, including Let-7 family members, was observed differentially expressed between lung adenocarcinoma and squamous carcinoma. 31 These miRNAs hold great potential as targets for histology-specific lung cancer treatment. Second, only a single cell line 95D with high metastatic potential was used for the experiments to observe the impact of let-7a on cancer proliferation and invasion. It would be more comprehensive to compare the difference of let-7a as well as its genes expression among a panel of cell lines with different molecular characteristics.
Conclusions
Let-7a inhibited the proliferation and invasion of the 95D cell line by inhibiting K-RAS and HMGA2 protein expression.
Footnotes
Acknowledgments
This work was supported by Fudan University Youth Research Fund (Kebu 339).
Disclosure Statement
The authors declare that they have no financial conflicts of interests.