
Abstract
Intraperitoneal (IP) injection is frequently reported to be as effective as intravenous (IV) injection. Because it allows administering a larger volume with more radioactivity, we have investigated this route and the possibility of using it to circumvent the volume constraint we earlier experienced with pretargeting radiotherapy. Using 99mTc as the label, the pharmacokinetics (PK) of the cMORF effector (a DNA analogue) was evaluated after IP or IV injection in normal mice by necropsy and SPECT/CT imaging. In another experiment, nude mice bearing tumors were used and they received MORF-CC49 pretargeting antibody IV 2 days earlier than labeled cMORF IV or IP. Tumor accumulations of cMORF were measured at 6 hours after its injections. The absorbed radiation doses for 188Re or 90Y pretargeting were estimated using the 99mTc data and a self-absorbed model. Although the absorbed radiation doses to other organs were comparable, the dose to intestines after IP injection was 30-fold higher than IV injection due to the slow entry into the circulation. It had reached such a level as high as the dose to the kidneys that cleared the radioactivity and usually were at the highest level. Nevertheless, the slow entry did not reduce the tumor accumulation. In conclusion, using IP in place of IV led to an unacceptably high absorbed radiation dose to the intestines although the tumor accumulation was not compromised. This effect may be applicable to other radiotherapeutic agents as well.
Introduction
Intravenous (IV) and intraperitoneal (IP) injections were two most widely used administration routes. IP was often considered to be an effective route for tumor therapy 1 –5 , although it was not as commonly used as IV. Some studies even concluded IP was slightly preferable, 6,7 although it was occasionally thought to be inferior. 8 During our previous investigations on tumor therapy by MORF/cMORF pretargeting (a pretargeting strategy using a recognition pair of DNA analogues, MORF/cMORF), the dose escalation of radiolabeled cMORF was constrained by its injection volume. 9,10 If IP were as effective as IV, this volume constraint could be easily lifted, because IP injection (i.e., the IV+IP combination in Fig. 1) could allow a much larger volume. Thus, in a pilot study, we tested a high radioactivity dose of 188Re-cMORF by IP injection but observed intestinal radiotoxicity, including diarrhea, partial mortality in the group, and the appearance of loose intestinal walls after dissection of the remaining euthanized sick animals (data not presented).
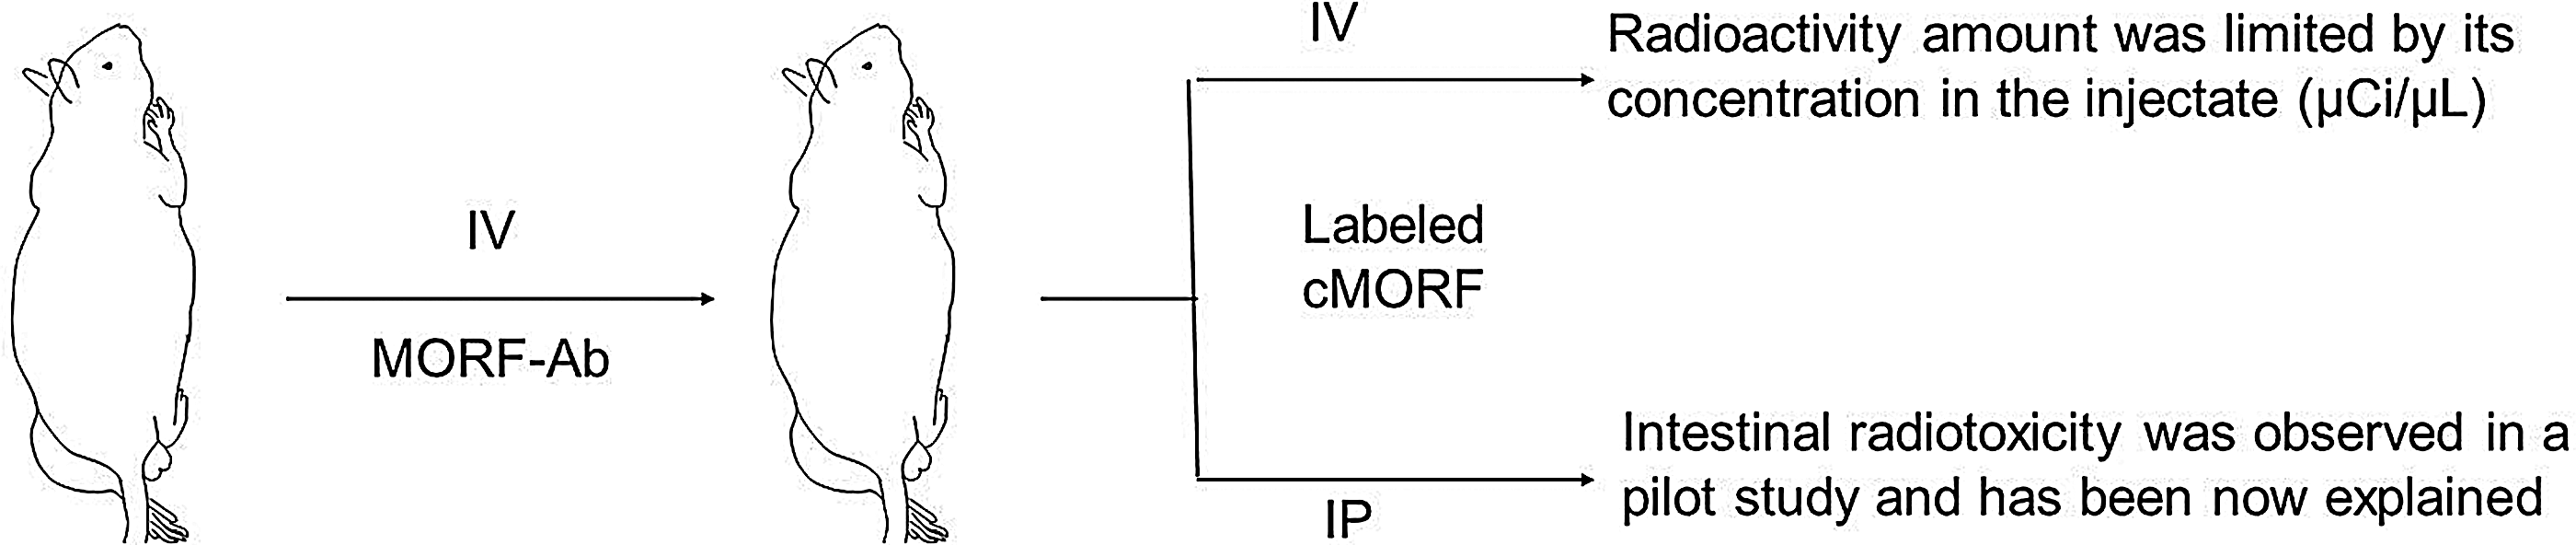
Two combinations of the injection routes (intravenous [IV]+IV and IV+Intraperitoneal [IP]) for pretargeting radiotherapy. MORF is a phosphorodiamidate morpholino oligomer (a DNA analogue).
Suspecting that the radiotoxicity involved long duration of radioactivity in the peritoneal cavity after IP injection, we designed this investigation to examine the kinetic difference and the absorbed radiation doses to organs after IP and IV. Most IP studies in the literature considered bioavailability and therapeutic effect. 1 –8 When radiotoxicity to organs was considered, intestines were rarely included, probably due to the lack of a method to accurately measure the radioactivity in the peritoneal cavity. In this investigation, we have designed such a method, applied to our MORF/cMORF pretargeting, and compared the absorbed radiation doses to organs including the intestines between IP and IV. The 99mTc was used as the label in place of 188Re or 90Y to measure the pharmacokinetics (PK) of the labeled cMORFs, because previous observation indicated that PK was essentially independent of the labels. 11
Experimental Section
The base sequences of MORF and cMORF were the same as previously reported 12 and they were from Gene-Tools (Philomath, OR). The cMORF was conjugated with NHS-MAG3 for 99mTc labeling. 13 The anti-TAG-72 CC49 antibody was custom produced by Strategic Biosolutions (Ramona, CA) from the CC49 hybridoma (a gift from Dr. Jeff Schlom, Center for Cancer Research, NCI, NIH). It was conjugated with MORF using a commercial Hydralink approach. 14,15 The 99Mo-99mTc generator was from Perkin Elmer Life Science, Inc. (Boston, MA). All other chemicals were reagent grade and used without purification.
The concentrations of MORF, cMORF, and antibody were determined by UV spectrophotometry. Size exclusion high performance liquid chromatography (HPLC) was used for their analysis. The HPLC system was equipped with a Superdex™ 75 column (optimal range: 3–70 kDa) or a Superose-12 column (optimal range: 1–300 kDa) from Amersham Pharmacia Biotech (Piscataway, NJ), an in-line UV detector, and an in-line radioactivity detector. The eluant was a 0.10 M phosphate buffer at pH 7.2 running at a flow rate of 0.60 mL/minute. Radioactivity recovery was routinely measured and was always greater than 90%.
All animal use was in accordance with the guidelines of the Animal Care and Use Committee of the University of Massachusetts Medical School and conformed to the recommendations in the Guide for the Care and Use of Laboratory Animals (Institute of Laboratory Animal Resources, National Research Council, National Academy of Sciences, 1996). The normal CD-1 mice were from Charles River (Wilmington, MA) and the NIH Swiss nude mice were from Taconic Farms (Germantown, NY).
Peritoneal adsorption and PK of labeled cMORF
As cMORF entered the circulation more slowly by IP than by IV, the study was designed to be different. For IV, after the normal mice in the six groups (n=3) each received 0.10 mL of radiolabeled cMORF (1 μg, 100 μCi), they were euthanized at six time points of 2, 10, 30 minutes, 1, 2, and 3 hours by chest opening and heart puncture under isoflurane anesthesia. Organs were harvested and routinely counted along with the injectate as standard. For IP, the observation period was longer and seven groups of mice were euthanized at 2, 30 minutes, 1, 2, 3, 4, and 6 hours. The injection volume of the labeled cMORF was 10-fold larger (1.0 mL) although the injected mass and radioactivity were the same.
A procedure was performed to measure both the radioactivity (X) and fluid volume (V) in the peritoneal cavity after IP injection before organ collection. Specifically, an aliquot (Y1=2 mL) of isotonic phosphate buffered saline solution containing 0.05% human serum albumin (diluting buffer) was injected into the cavity. Following gentle palpitations of the abdominal region to effect uniform dilution of the radioactivity in the cavity, a small volume (S1= 0.2 mL) was sampled. Then, a second set of buffer injection (Y2
) and sampling (S2
) was applied. Finally, the solution in cavity was all withdrawn and the cavity was opened. The organs in cavity were washed with the diluting buffer after excision and the liquid samples (S1
and S2
) were counted together with the solid organs to provide the radioactivity concentrations (C1
and C2
in μCi/mL). From the principle of conservation of radioactivity (decay corrected)
the following equations were derived to calculate the cavity radioactivity and fluid volume:
The distribution of radioactivity over the body was visualized by imaging with a small animal SPECT/CT camera (Bioscan, Washington, DC). Higher specific radioactivity (1 μg, 370±10 μCi) was injected to each of the mice in two groups (n=4) to facilitate imaging. Because the biodistribution was changing rapidly, especially after IV injection, the imaging was performed after euthanasia. The euthanization times were 2 minutes, 0.5, 1.0, and 1.5 hours and the imaging conditions were identical (24 projections at 60s/projection). In the end, the radioactivity left in the whole body was measured using a dose calibrator.
Tumor accumulations in pretargeted nude mice
For tumor accumulation, under the condition that the binding sites were not saturated, we had previously provided an expression (named MPTA)
16,17
:
where F was the cardiac output; f was the fraction of the cardiac output reaching tumor; W was the tumor weight; E was the tumor trapping fraction of effector. Based on this expression, as F, f, W, and E were the same for IP and IV in this investigation, the ratio of the MPTA by IP over IV should be the ratio of the
The blood radioactivity–time curve should essentially be the same with and without pretargeting. Therefore, the
To confirm this prediction, the MPTAs were measured using 8 Swiss NIH nude mice. Each was inoculated in the left thigh with 106 LS174T colon tumor cells. After 12 days when tumors were about 0.2 g, 15 μg of MORF-CC49 (MORFs/antibody=1.5) was injected IV. Two days later, 2 μg (80 μCi) of 99mTc-cMORF in 0.1 mL was injected IV to each of the four in one group, while the same amount of labeled cMORF in 1 mL was injected IP to each of the other four. All the mice were euthanized for biodistribution at 6 hours, a time point when the radioactivity had cleared from circulation even for IP injection. Organs and tumor were routinely collected for the radioactivity counting as previously described. 12
Absorbed radiation doses to blood, kidney, and intestines
Because of the minimal influence of radiolabel and pretargeting antibody on the normal organ accumulations of cMORFs 11 , biodistribution data for the 99mTc-cMORF in normal mice was used to estimate the absorbed radiation doses (Rad) to organs of interest for the pretargeting therapy using 188Re- or 90Y-cMORFs. To calculate the absorbed radiation dose to the intestines, the sum of the radioactivity in cavity fluid and the intestinal radioactivity (total cavity radioactivity) was used. For an injection dose of 100 μCi, the areas under the radioactivity curves (AUCs) were calculated after converting the %ID- or %ID/g-time curves to the decay corrected μCi-time curves (17.0 hours for 188Re and 64.0 hours for 90Y). As before, the self-absorbed model was utilized for the dosimetry using the formula of 2.143* Eβ*AUC (μCi*h)/W(g) or 2.143* Eβ*AUC (μCi/g*h), 9,10 where 2.143 was a unit conversion factor, Eβ was the average electron energy (MeV), and W was the organ weight (for intestines, the content was also included).
Results
Peritoneal adsorption and PK of labeled cMORF
Table 1 lists the radioactivity amount and fluid volume in the peritoneal cavity after IP injection along with the radioactivity accumulations in normal organs after both IP and IV injections. The peritoneal fluid sampling method in this report has been confirmed to provide the same radioactivity value as that by rinsing out the radioactivity completely (data not presented) but with an advantage to provide the fluid volume in addition.
IP, intraperitoneal; IV, intravenous.
(b)
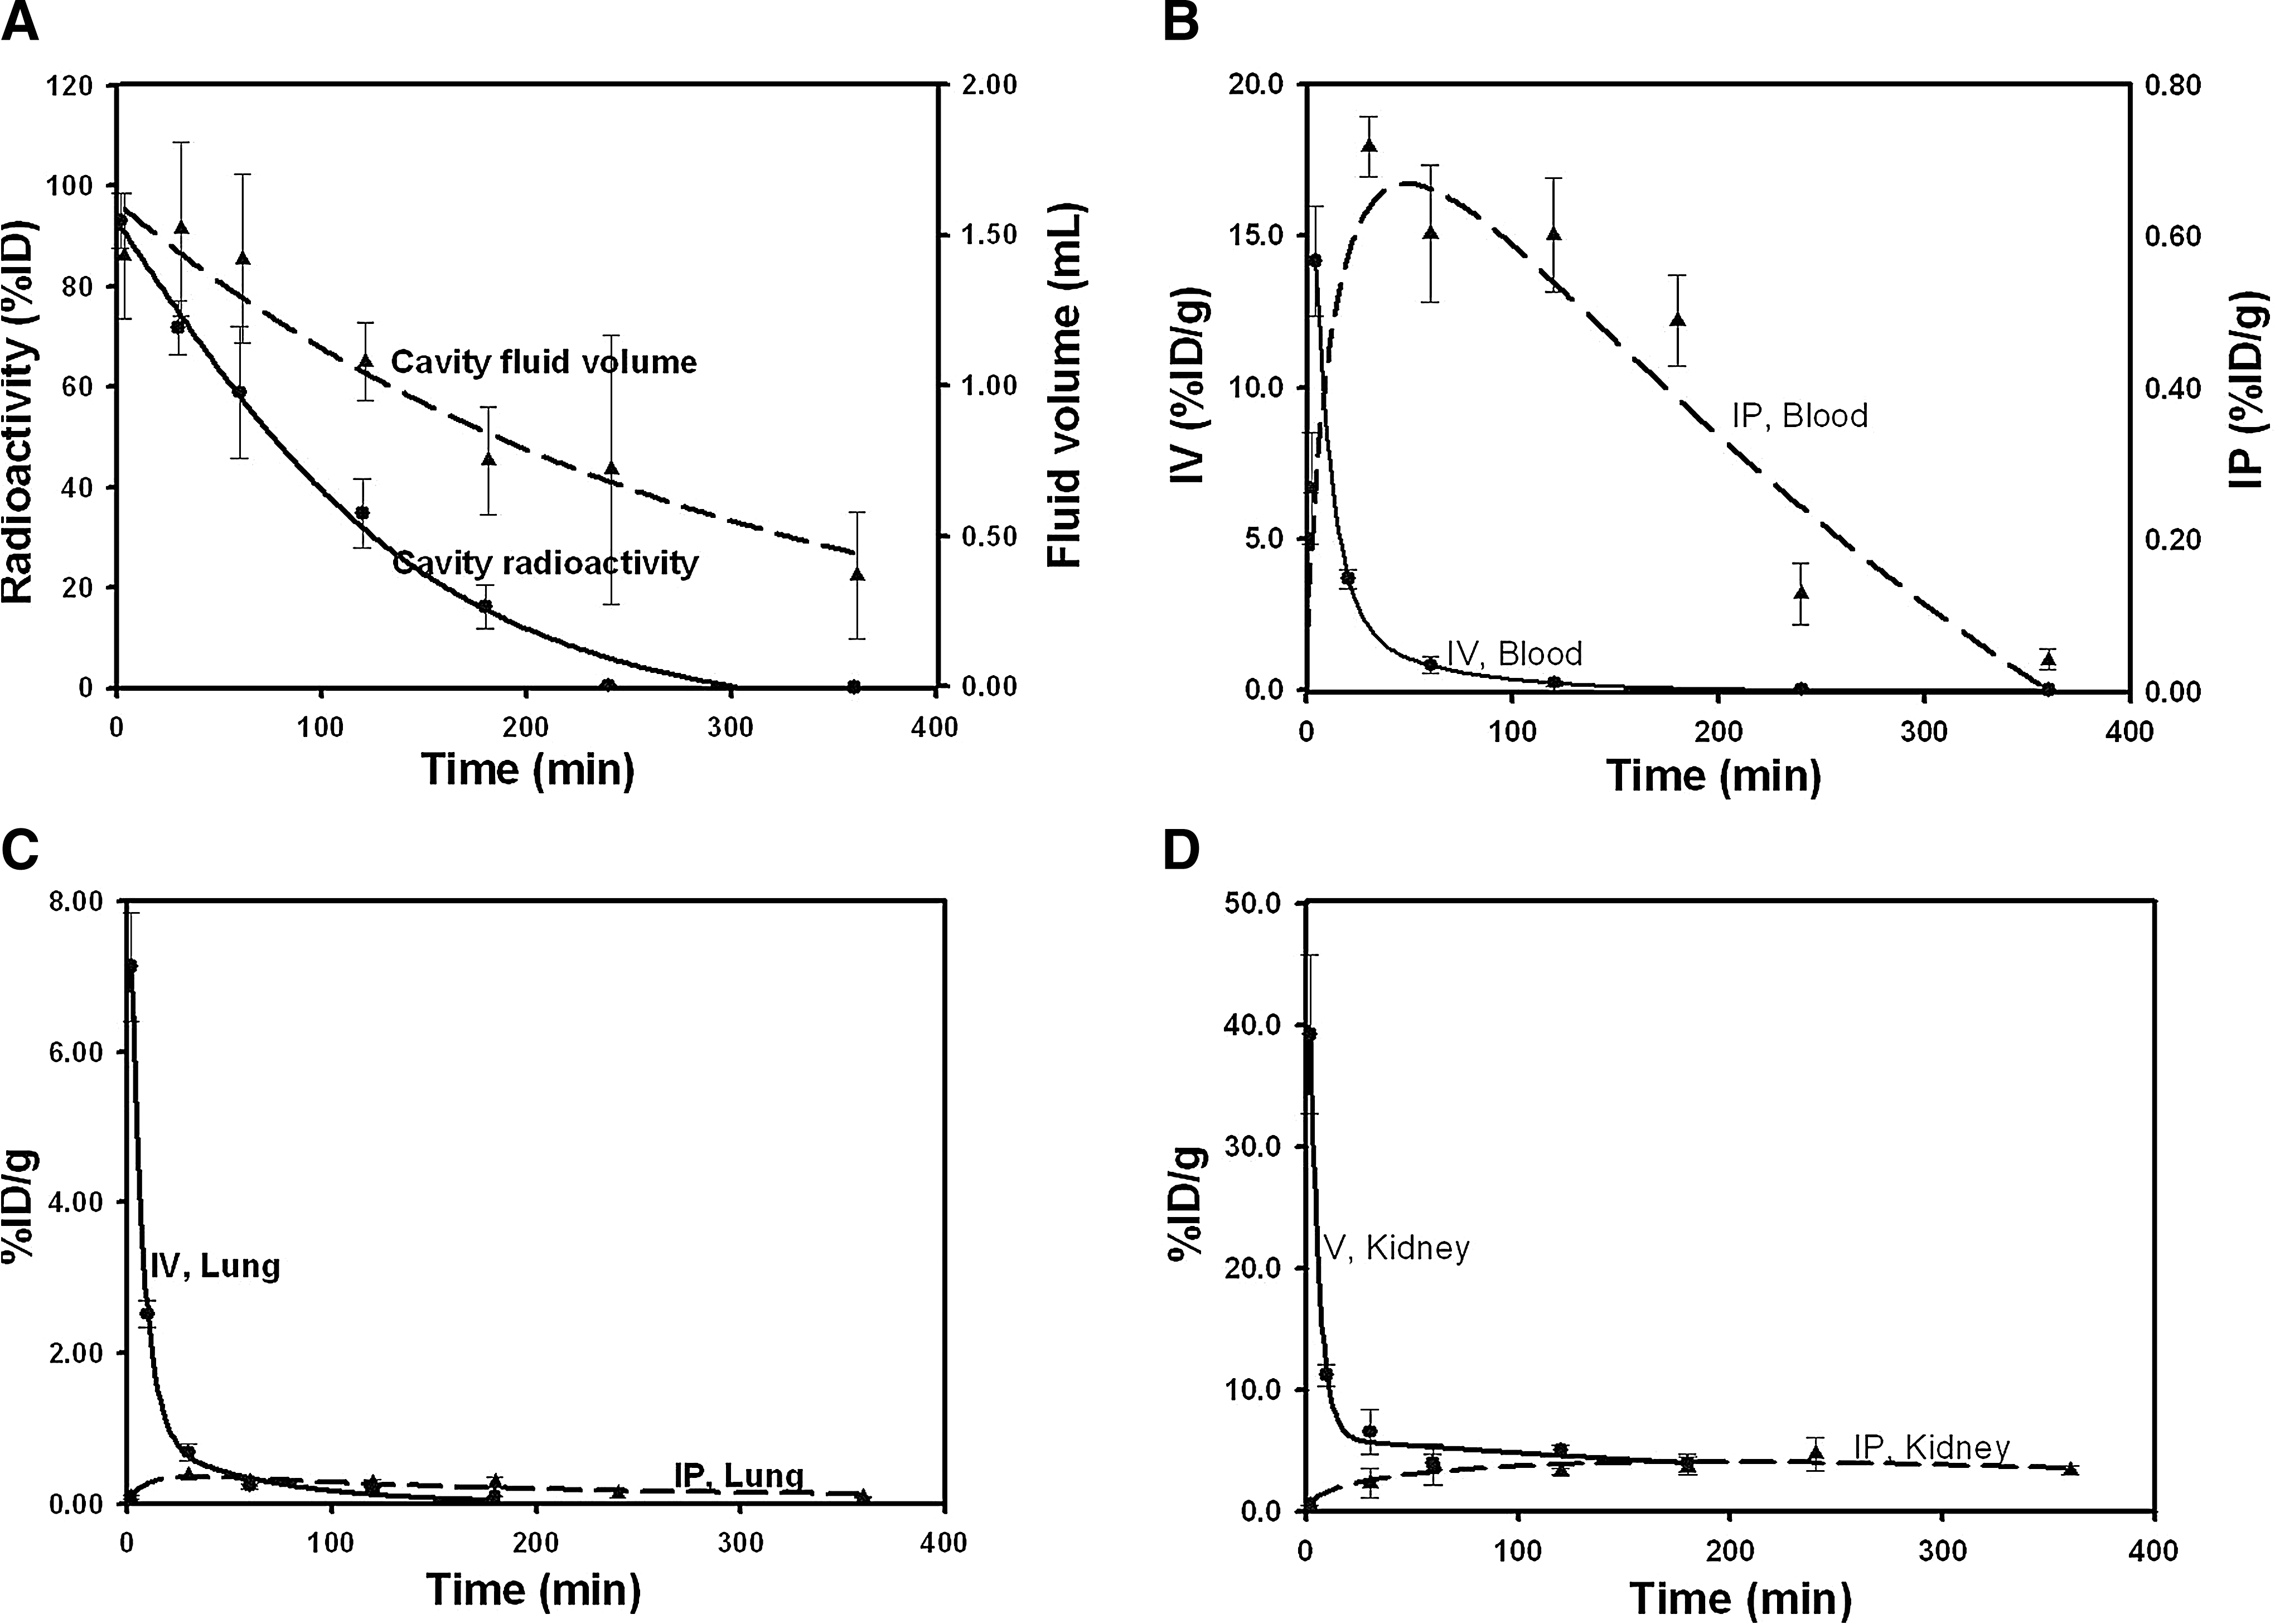
The radioactivity curves for the organs of interest are reproduced in Figure 2. Interestingly, the labeled cMORF enters into the circulation more rapidly than its host buffer (Fig. 2A). In addition, the 2-minute fluid volume is 1.6 mL, that is, by about 0.6 mL larger than the originally injected 1.0 mL likely due to the hypertonicity of the labeling buffer (the total concentration of monocations is about 0.27 M, i.e., 1.7-fold of that in the isotonic saline). Figure 2B shows that after IP injection the labeled cMORF enters into blood and clears within 4–6 hours as compared with 1–2 hours after IV injection. As an example of normal organs, the curve for the lung is shown in Figure 2C. After IP injection, the accumulation slowly increases, gets over a peak of much lower height, and slowly clears in parallel with the blood level. Figure 2D demonstrates the radioactivity accumulations in the kidney, with a feature that the two lines merge at a level of about 4%ID/g instead of at the bottom.
Radioactivity levels over time in cavity by IP
The slower entry of the labeled cMORF into the circulation after IP injection can be visually appreciated by consulting the SPECT/CT images (Fig. 3). Within the first 1.5 hours after IP injection, consistent to the necropsy data in Table 1 and Figure 2A, the radioactivity in the peritoneal cavity dominates the image. Radioactivity in bladder becomes visible at 30 minutes and increases with time. Radioactivity in other organs including kidneys is relatively low as compared with that in the cavity, such that the signals are overwhelmed. For IV, the clearance essentially completes within 30 minutes as shown in the lower row. Apart from the bladder, only kidneys are visible thereafter.
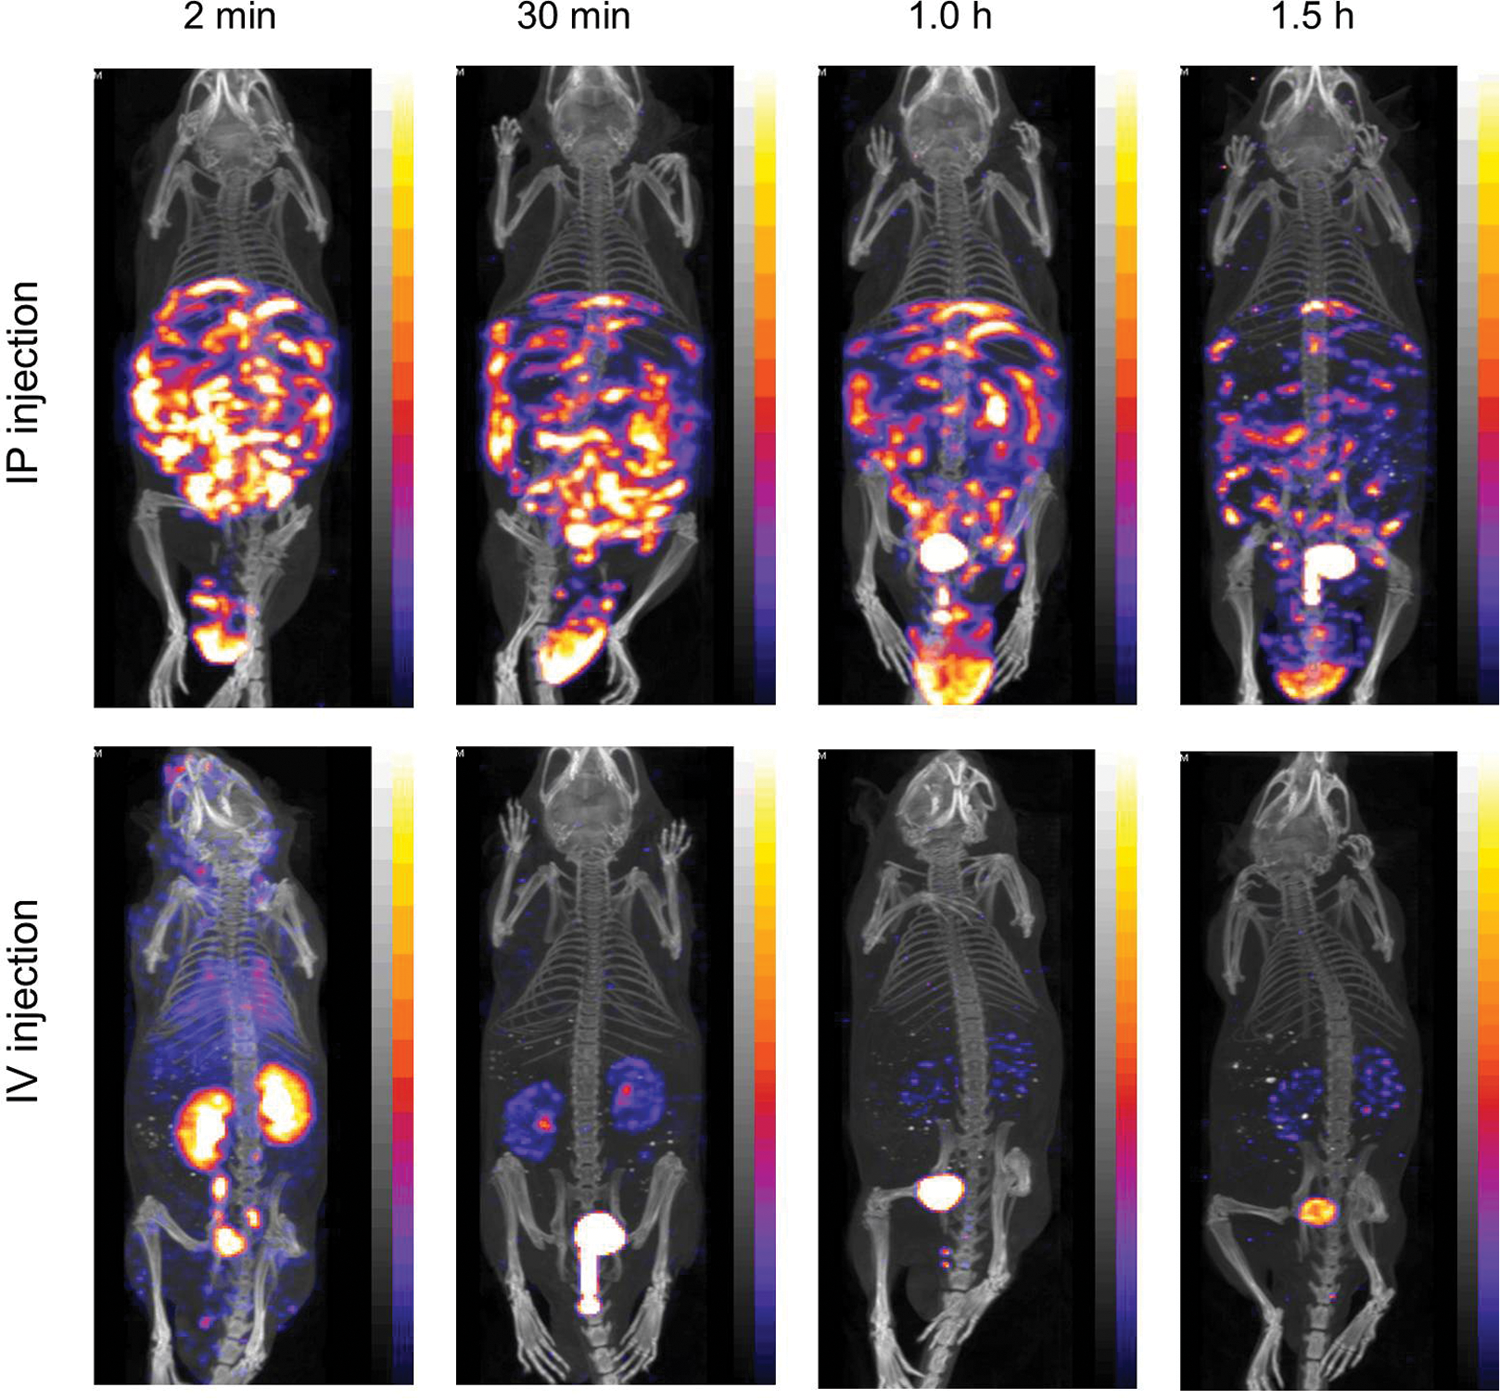
Whole body images of normal mice after IP or IV injection of 99mTc-cMORF. The maximum voxel brightness for each is set such that after decay correction it is at the same value. Color images available online at
Tumor accumulations in pretargeted nude mice
The bioavailability of 99mTc-cMORF (i.e., the ratio of IP to IV blood
(b)
Absorbed radiation doses to blood, kidney, and intestines
Three normal organs are of most interest for dosimetric consideration 20 –24 : blood, because bone marrow is very radiosensitive; intestines, because they are also radiosensitive and IP imposes much stronger radiation burden to them than IV; and kidneys, because the radioactivity clears through this organ exclusively. Tumor is the target, but the doses are not listed (Table 2b) because they are essentially the same due to the same accumulations between IV and IP.
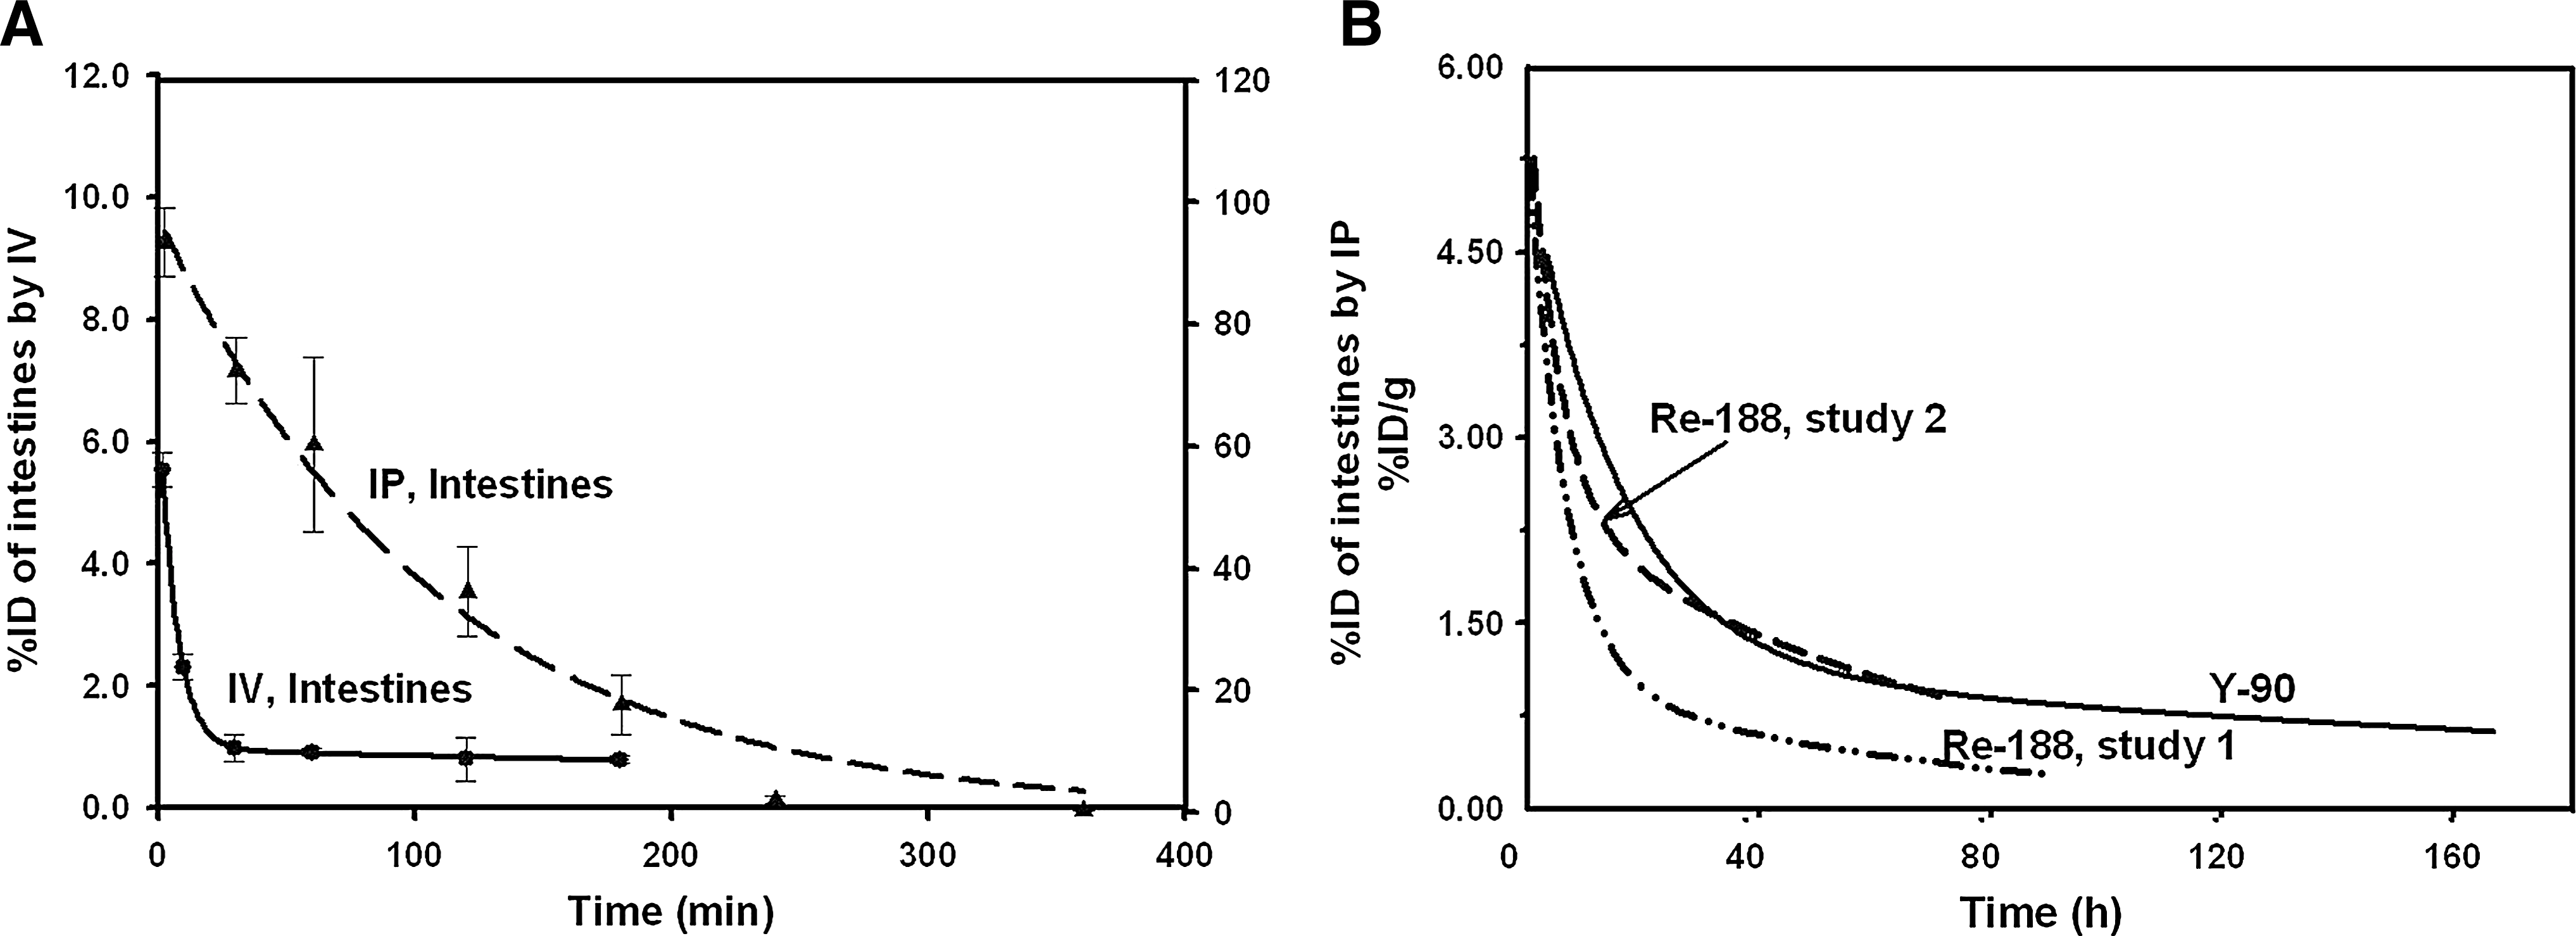
The absorbed radiation doses listed in Table 2b are for an injection of 100 μCi of 188Re or 90Y. Due to the 96% bioavailability and therefore the essentially identical blood AUC, the absorbed radiation doses to bone marrow by IP and IV should be similar. For the intestines, the absorbed radiation dose by IP calculated from the fits in Fig. 4A is over 30-fold higher than that by IV. For kidneys, dosimetric consideration requires the data of longer observation than that from the normal mouse study of this investigation. As such, the required radioactivity data after 3 hours for IV and 6 hours for IP are derived from previous pretargeting studies (Fig. 4B). 9 –11 To err on the safe side, the 90Y curve was used. Due to the long retention, the doses are high and the difference between IV and IP is small. Remarkably, the absorbed radiation dose to intestines by IP has reached the dose level for this organ.
The total radioactivity for intestines by IV or IP
Discussion
In this report we clearly demonstrate that switching from IV to IP can dramatically increase the absorbed radiation dose to the intestines (actually the viscera in the cavity). Under the conditions of this study, the calculated absorbed radiation dose to the intestine has increased to a level comparable to that for the kidneys. Even this is likely to be an underestimate, because the radioactivity is not evenly distributed within the peritoneal cavity but concentrates between the viscera and immediately contacts with the intestinal walls. Therefore, the radiotoxicity observed in our pilot study may be explained. In addition, although IP can change the kinetics and dramatically increase the absorbed radiation does in the cavity, as predicted, it does not reduce the tumor accumulation if the bioavailability is not compromised. 16,17
The dosimetric estimation is based on the clearance kinetics of free radiolabeled cMORF in mice. Therefore, similar results should be expected for other directly radiolabeled agents, if these agents leave the cavity similarly. At this point, although no IP data by our method are available and measuring them is beyond this investigation, the IP blood curves in the literature should serve as a clue to whether these agents leave the cavity similarly. The clearance rate of a labeled agent from the blood can be very different but an agent should lie in between two extremes: retaining in the blood and rapid clearing from blood as schematically shown in the Figure 5. The plateauing time in the first case and the peak time in the latter are related to the cavity absorption rate.
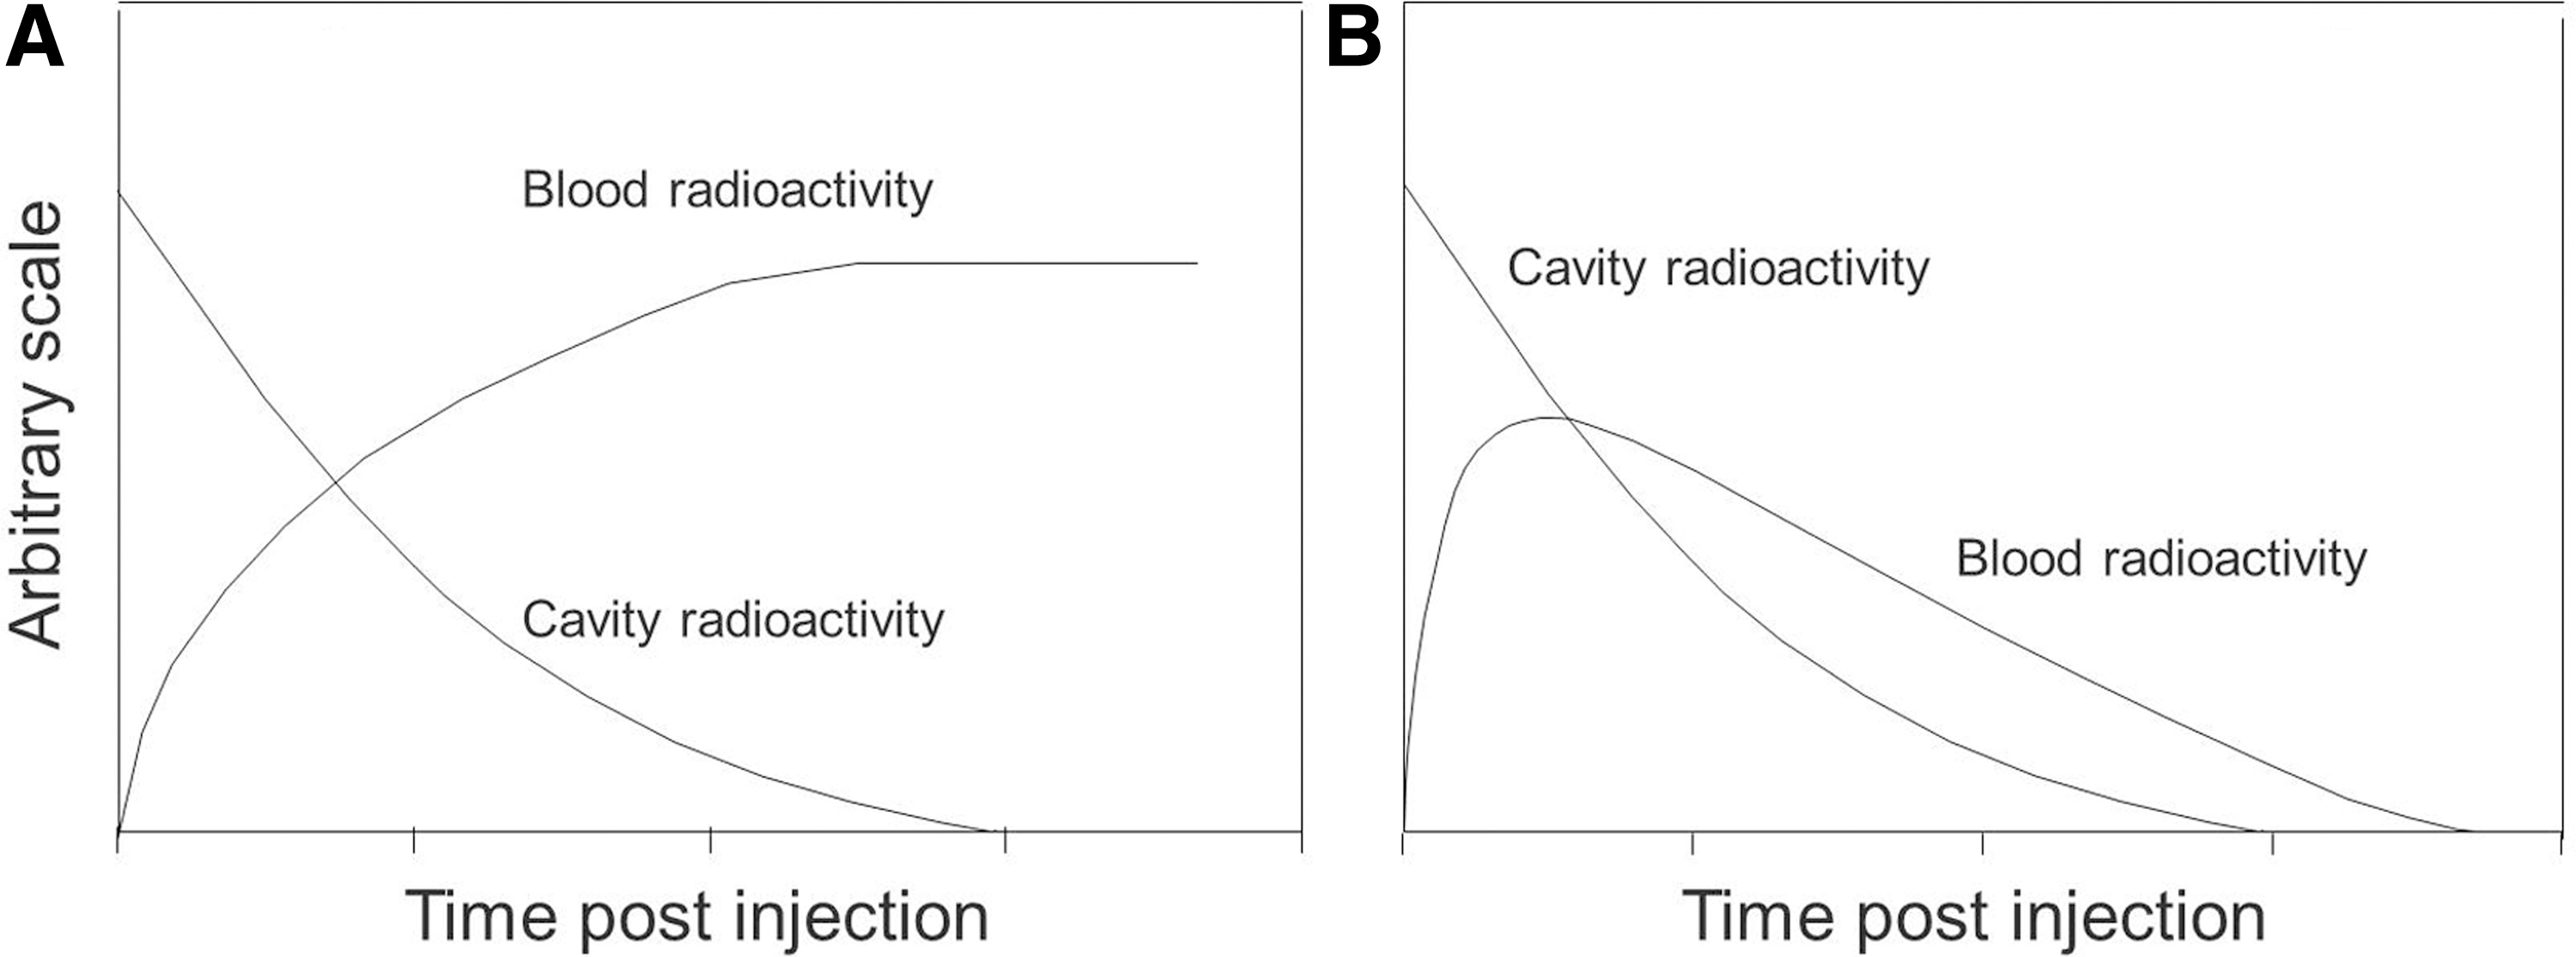
A schematic showing the cavity and blood levels after IP. injection of rapid
Most large molecules such as the radiolabeled antibodies slowly clear from blood as shown in Figure 5A. The plateauing time roughly represents the completion time of the peritoneal absorption. For example, Costantini et al. 3 reported a plateauing time of 6.9 hours for a labeled antibody. Compared with the labeled cMORF (about 4–6 hours, Fig. 2B), antibodies seem to leave the cavity a little more slowly. Small labeled molecules rapidly clear from blood unless they bind to blood proteins. Their blood levels in mice peak at about 20–50 minutes, for examples: ∼20 minutes for the 18 F-2-Fluoro-2-Deoxy Glucose ( 18 F-FDG), 4 ∼40 minutes for the 51Cr-ethylenediamine tetraacetic acid (51Cr-EDTA), 25 and the ∼50 minutes for the radiolabeled cMORF in this investigation. The completion of the cavity absorption may take longer than the peak time, judged by the labeled cMORF (4–6 hours vs. ∼50 minutes).
Based on the limited information above, we speculate that any radiotherapeutic agent after IP injection would impose an absorbed radiation dose to the intestines (actually cavity organs) at a level similar to that for the IP injection of the labeled cMORF. If an agent itself has high normal organ backgrounds, the increase of the cavity dose by IP compared to that by IV may not seem dramatic. For example, many labeled agents clear through liver into the intestines either rapidly via the hepatobiliary path or slowly after taking up by hepatocytes. The presence of radioactivity within the intestines following both IP and IV would make the ratio of IP cavity dose to IV cavity dose smaller, but that would not reduce the cavity dose induced by IP and the dose from the radioactivity within the viscera would add its damaging effect. Another factor is the possibility of compromised bioavailability following IP injection, as the 70% reported for a labeled antibody. 3 Apparently, any radioactivity left in the cavity would also add its damage to the viscera in addition to reducing tumor accumulation. The unanswered question is whether the radiotoxicity induced by IP is dose-limiting. For example, a recently published study with IP injection reported the lethal dose of a 211At-labeled antibody induced minimal damage to the intestinal histopathological structure, suggesting that the death might be due to unknown toxicity. 25 At least, bone marrow toxicity has been known for a long time to be an issue with radiolabeled antibodies.
In this investigation, we directly applied the kinetics of cMORF to estimate the dosimetry for MORF/cMORF pretargeting, because the radiolabels 11 and the pretargeting antibody only minimally influenced the kinetics of free cMORF. The low backgrounds and rapid renal clearance characteristic of any qualified effector for pretargeting are likely to suggest a very similar scenario with regard to the dramatically increased absorbed radiation dose to the intestines following IP injection. However, a direct extrapolation is not possible due to the lack of IP data by our method at this point.
Conclusion
Switching from IV injection to IP injection of labeled cMORF dramatically increased the absorbed radiation dose to intestines, although the bioavailability and tumor accumulation was not compromised. This dramatic effect may apply not only to pretargeting radiotherapy but also to direct-targeting radiotherapy in common, especially for a radiolabeled agent that rapidly clears from the circulation.
Footnotes
Acknowledgments
This work was supported by the grants of DK82894, CA94994, and DK 94199 from the National Institutes of Health. We thank Dr. Donald J Hnatowich from the Department of Radiology, University of Massachusetts Medical School, Worcester, MA, for his help in the discussion of this research.
Disclosure Statement
No financial conflicts of interest exist.