
Abstract
Objective:
We examined the whole genome expression profile in advanced colorectal cancer (ACC) patients who had received FOLFOX4 chemotherapy to establish a genetic biomarker model predicting chemotherapy sensitivity.
Methods:
Eligible ACC patients were divided into two groups, based on postchemotherapy evaluation results: specifically, the sensitive group (experimental group) and the resistant group (control group). The genome expression profiles of colorectal cancer tissues were examined using DNA microarray analysis, and differential gene expression was identified using a significance analysis of the microarray. The probe signal log ratios were used to produce the area-under-the-curve, sensitivity, and specificity for candidate genes. Genes exhibiting differential expression and significant predictive power were used to simulate a genetic model for estimating chemotherapy sensitivity.
Results:
Totally, 30 ACC patients were eligible for the study, 13 assigned to the experimental group and 17 to the control group. In total, 30 genes showing significant differential expression were identified. Seven candidate genes (NKX2-3, FXYD6, TGFB1I1, ACTG2, ANPEP, HOXB8, and KLK11), which exhibited positive or negative correlations, were incorporated into a genetic model, with an overall accurate predication rate of 93.3%.
Conclusions:
The predictive model involving the seven genes listed had high accuracy in estimating chemotherapy sensitivity to the FOLFOX4 regimen.
Introduction
Colorectal cancer patients show high individual variation in efficacy and tolerance even when being medicated with an identical regimen and dose. Thus, a patient- or tumor-based genotyping model is needed to predict sensitivity to and toxicity of chemotherapy. Many studies have attempted to identify factors that can predict chemotherapy sensitivity, although the predictive power of most individual factors remains debatable.
In this study, we examined gene expression profiles of advanced colorectal cancer (ACC) patients, who previously received the FOLFOX4 chemotherapy regimen, using DNA microarray analysis, and identified candidate genes that enabled the prediction of chemotherapy sensitivity. A genetic model that could predict the chemotherapy sensitivity of ACC patients to the FOLFOX4 regimen was subsequently established to direct the individualized treatment of ACC patients.
Materials and Methods
Subjects
In total, 30 ACC patients with synchronous liver metastases were enrolled between January 2009 and December 2010. All patients voluntarily provided informed consent in writing and received the neoadjuvant FOLFOX4 chemotherapy regimen. The chemotherapy protocol was as follows: oxaliplatin, 85 mg/m2 body surface area (BSA), day 1, was infused intravenously with calcium folinate, 200 mg/m2 BSA, days 1 and 2, over 2 hours. Next an intravenous bolus injection of 400-mg/m2 BSA fluorouracil was given sequentially, followed by a continuous 22-hours intravenous infusion on days 1 and 2. A cycle of treatment last 2 weeks, and all patients received six cycles of treatment. The Response Evaluation Criteria in Solid Tumors (RECIST) were used to evaluate the patients' response following completion of the six cycles of chemotherapy. 1,2 No patient achieved a complete response (CR); 13 patients achieved partial responses and were included in the experimental group, six patients achieved stable disease, and 11 patients had disease progression (PD) and were included in the control group (see Table 1).
PR, partial response; PD, disease progression; SD, stable disease.
Collection of surgical specimens
All eligible patients underwent R0 resection of primary colorectal tumors, which was documented pathologically, following the completion of neoadjuvant chemotherapy. Partial surgical specimens were harvested and cryopreserved in liquid nitrogen for further experiments.
Features of DNA microarrays
DNA microarrays (CyanoCHIP version 0.8) were provided by TaKaRa. On this microarray, polymerase chain reaction (PCR) fragments of the C-terminal 1-kb coding regions of 3079 open reading frames (ORFs) were fixed, which covered all ORFs in the genome of Synechocystis sp PCC 6803 except some genes that encode transposase. In cases of genes smaller than 1 kb, the full length of the ORF was amplified and fixed. Approximately 90% of the PCR products fulfilled the requirement for concentration of 0.1 mg mL−1 and sufficient purity. In addition to the ORFs mentioned above, there were four spots each of 16S rRNA, 23S rRNA, λ phage DNA (as an internal control), and human transferrin receptor gene (as a negative control) and 44 spots of diluted solution of rRNAs used as positional markers. These spots (approximately 150 μm in diameter) were aligned in an area of 18.0×18.0 mm. 3,4 Duplicate sets of DNA spots were fixed on the upper and lower parts of the DNA microarray to verify the reproducibility of experiments.
Statistical analyses
Fisher's exact probability test and Wilcoxon's signed-rank test were used to test the statistical significance of differences in clinicopathological characteristics between the experimental and control groups for categorical and continuous variables, respectively. Significance analysis of microarrays (SAM) was used to identify differentially expressed genes between the two groups. The area-under-the-curve (AUC) was determined to evaluate the performance and accuracy of the predictive model output.
Results
Cluster analysis
The Affymetrix GeneChip HG-U133 Plus 2.0 Array was used to examine gene expression profiles in primary tumor cells. A supervised hierarchical cluster analysis of gene expression profiling data showed that the two groups had a clustering trend (Fig. 1).
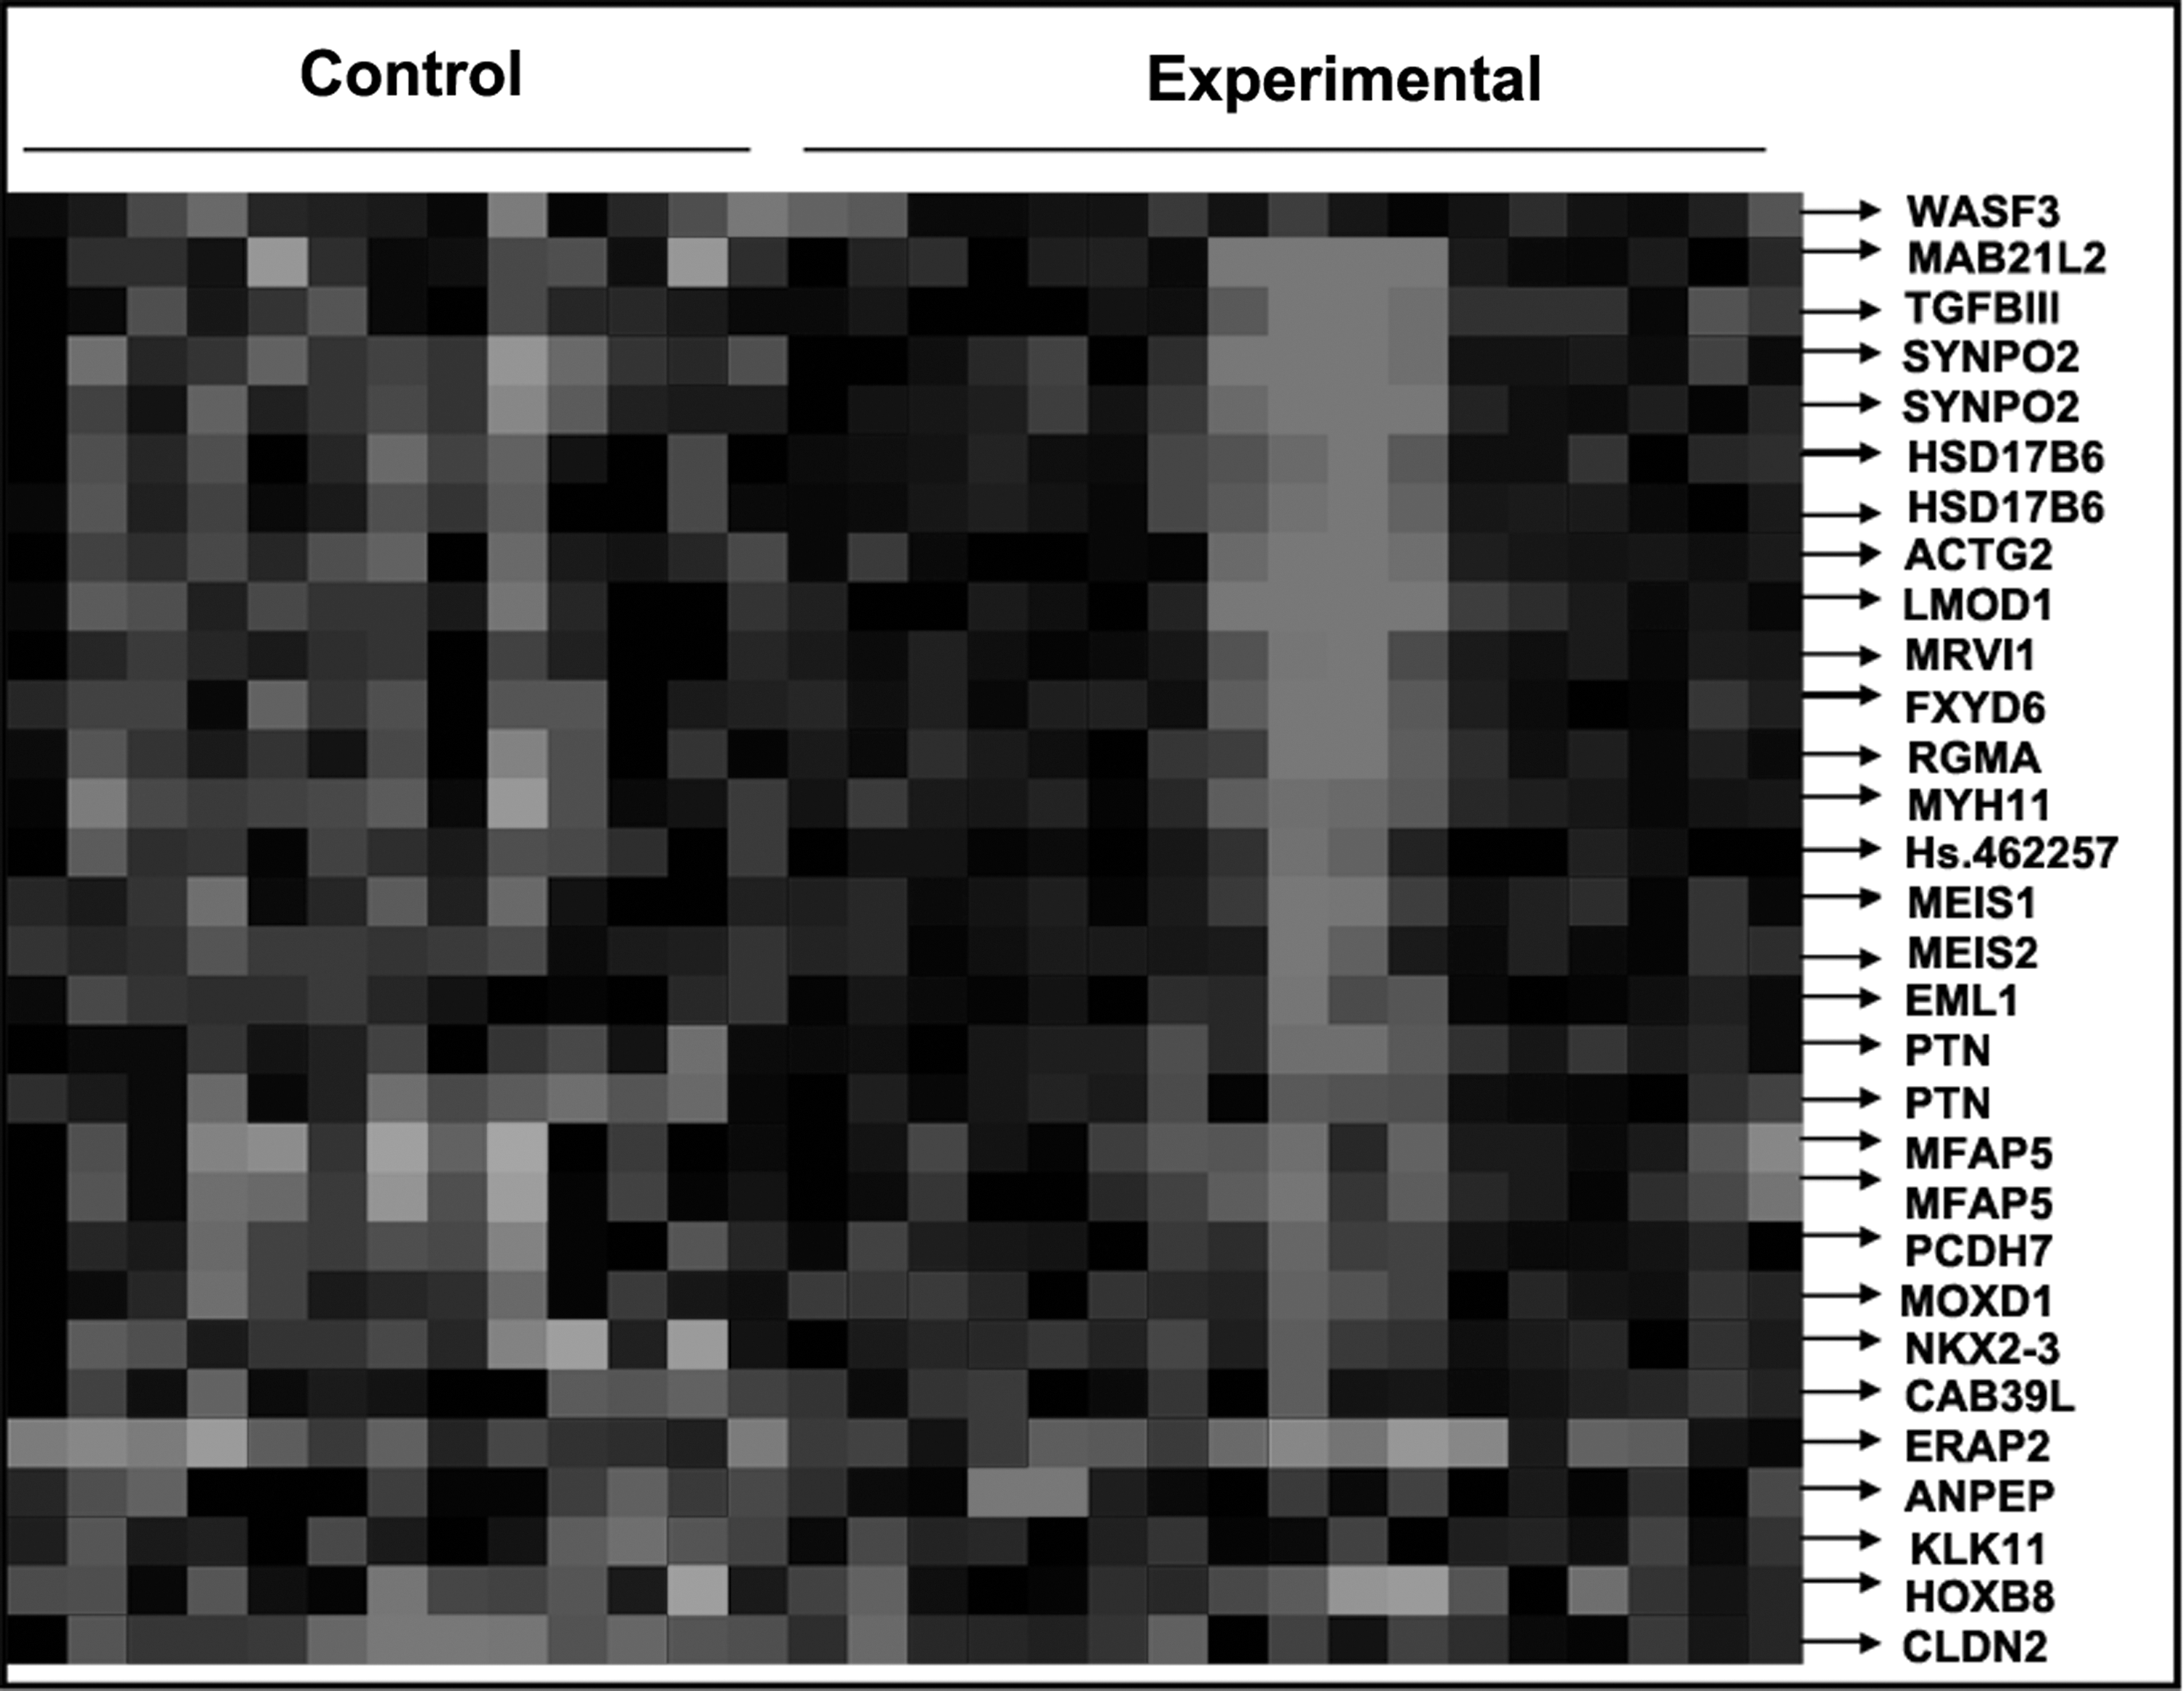
Supervised hierarchical cluster analysis results.
SAM data
The SAM for differentially expressed genes revealed that the two groups significantly differed in tumor cell biology: expression was upregulated in 9,359 genes and downregulated in 11,104 genes. At a differentially expressed gene ratio of |Score(d)| ≥2, in total, 30 genes had a fold change ≥2 or ≤0.5. SAM differentially expressed gene probe signal values were converted to logarithmic ratios using the Biweight approach (Fig. 2).
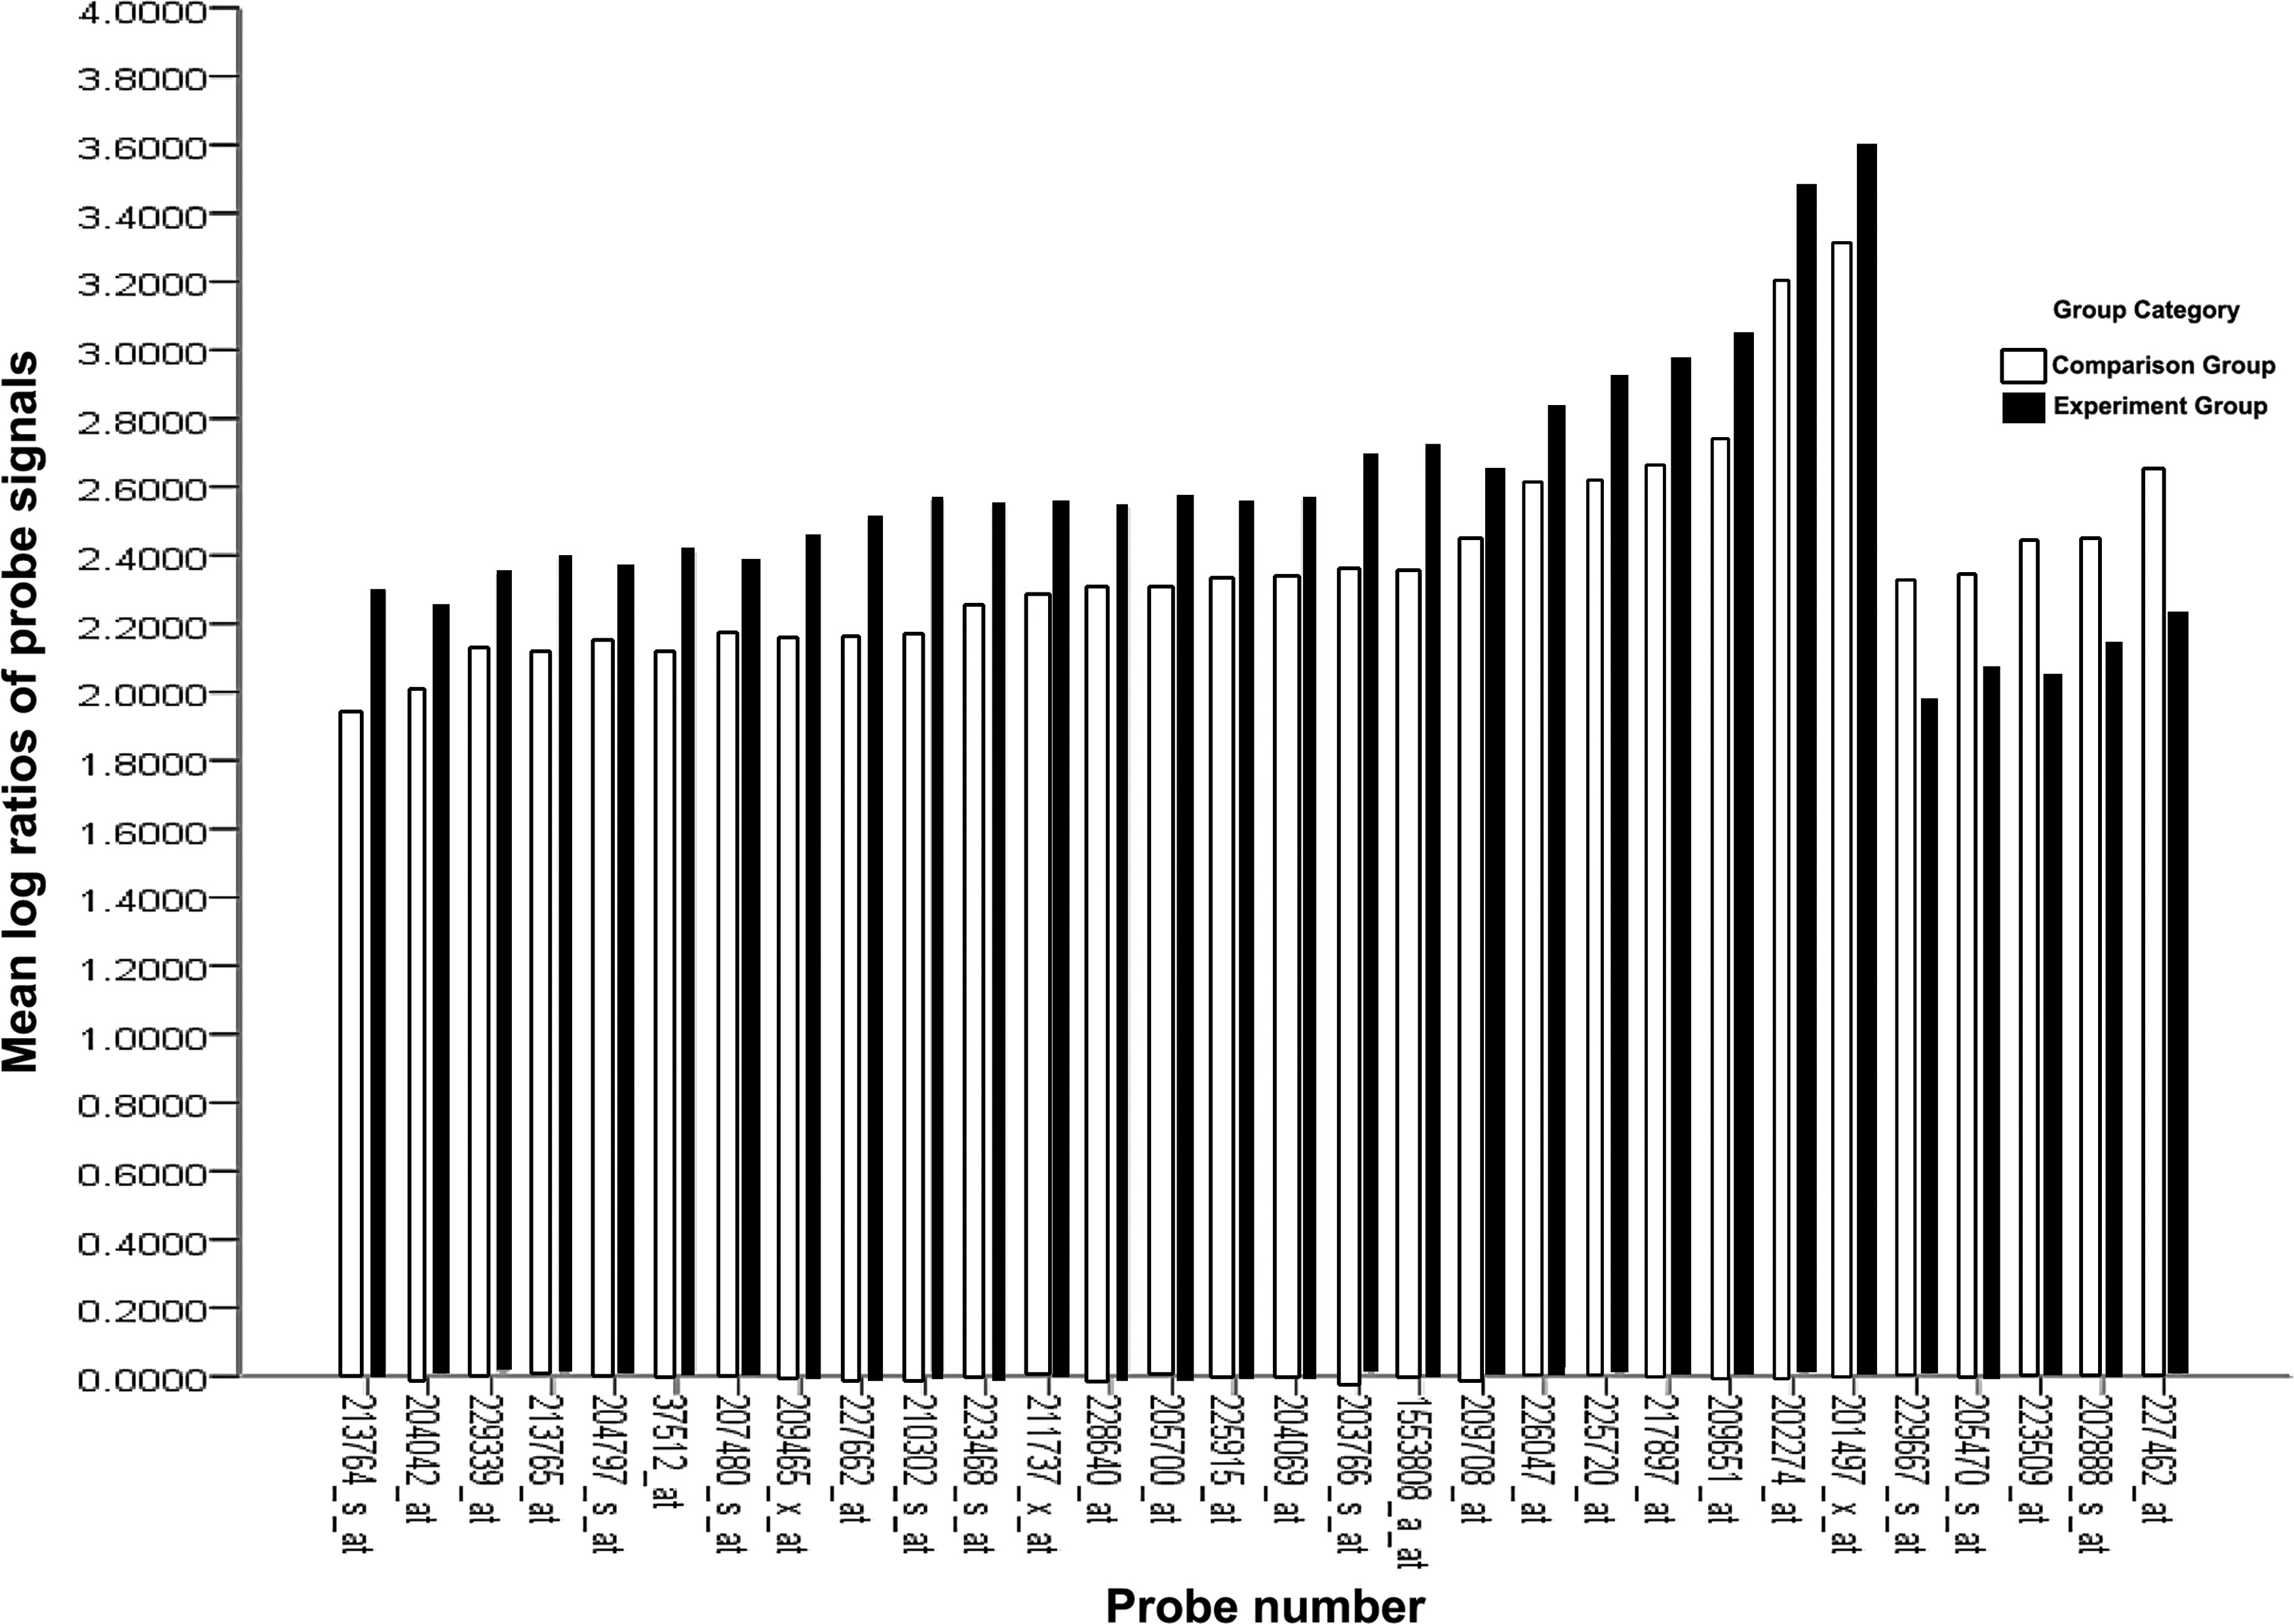
Mean log ratios of probe signals for differential expression gene profiles.
Establishment of a predictive chemotherapy sensitivity-associated genetic model
AUC, cutoff value, sensitivity, specificity, and Youden's index were generated for individual genes to identify the three most powerfully predictive genes. NKX2-3, FXYD6, and TGFB1I1 and ACTG2 (tied in the third place) were determined to be positively correlated with chemotherapy sensitivity, while ANPEP, KLK11, and HOXB8 showed a negative correlation (see Table 2, Fig. 3).
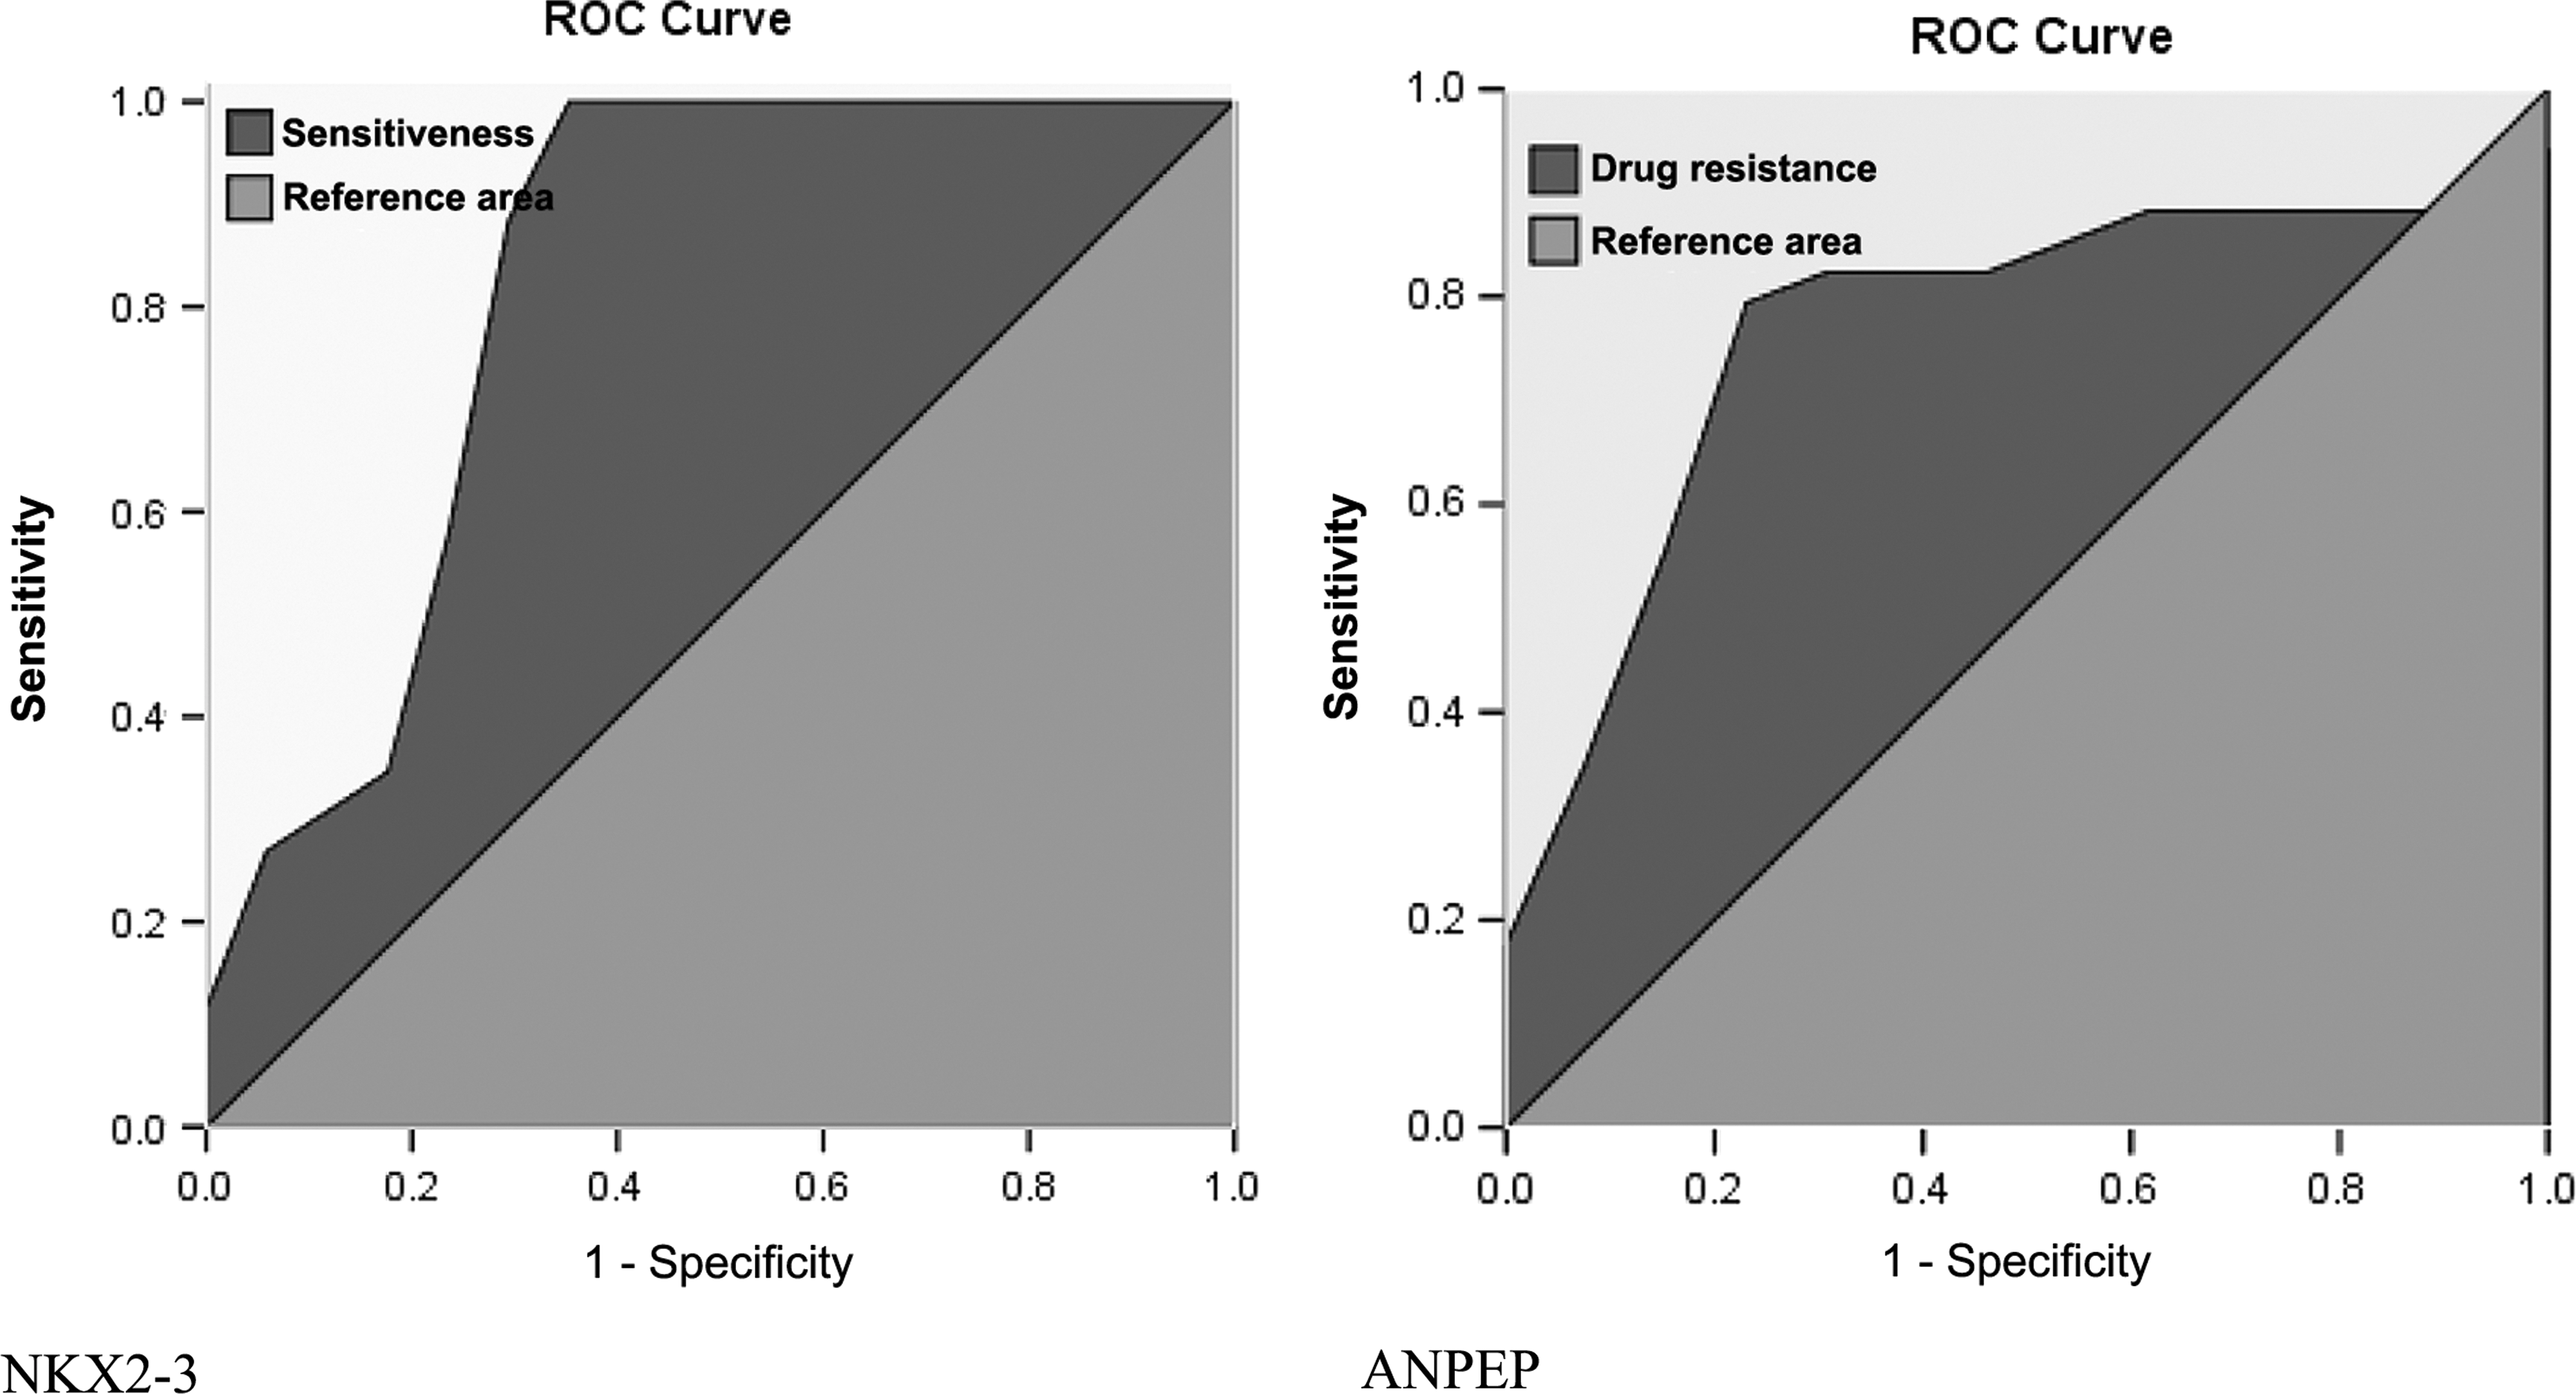
Receiver operating characteristic curves of NKX2-3 and ANPEP.
These first seven most powerfully predictive genes exhibiting positive or negative correlations, namely, NKX2-3, FXYD6, TGFB1I1, ACTG2, ANPEP, KLK11, and HOXB8, were incorporated into a predictive model. The 30 ACC patients were evaluated using the product method: a patient with a negative product was classified as being resistant, while a patient with a positive product was classified as being sensitive. Comparisons with actual chemotherapy sensitivity results showed that only two patients were misevaluated and the predictive model had an accuracy of 93.3% (see Table 3).
Discussion
Colorectal cancer is one of the most common malignancies, in fourth place in terms of cancer-associated mortality. 5 Approximately 30%–40% of colorectal cancer patients suffer from advanced disease or distant metastases at the time of diagnosis, and are not curable if treated with surgery alone. Treatment with oxaliplatin and newly emerging monoclonal antibodies is believed to be a major breakthrough in the treatment of ACC. 6 The FOLFOX4 chemotherapy regimen results in an objective remission rate of nearly 50% 7 ; however, approximately half of all patients are resistant to this combined chemotherapy regimen.
Colorectal cancer patients show high individual variation in treatment response even when being medicated with an identical regimen and dose. This individual variation is not normally attributable to age, comorbidities, concomitant medications, hepatorenal function, or other single factors. Rather, it is due to variation in genetic factors associated with drug metabolism and/or receptor expression. Thus, a patient- or tumor-based genotyping model is needed to predict chemotherapy sensitivity for the purpose of individualized treatment. 8 Identification of the patient subgroup(s) who will potentially benefit from adjuvant chemotherapy is a major challenge in clinical practice.
Predictive factors for fluorouracil and oxaliplatin-based adjuvant chemotherapy include TS, 2 DPD, 9 MSI, 1 p53, 10 ERCC1, 11 and GSTP1. 12 However, two systematic reviews showed that the great majority of these single factors had poor predictive power or even gave rise to contradictory results. 13,14 Colorectal cancer involves multistep inactivation of multiple tumor suppressor genes and concomitant activation of a series of oncogenes. Thus, only a combined assay of multiple gene expression profiles would be expected to accurately predict the chemotherapy sensitivity of colorectal cancer for the purpose of individualized treatment. Colorectal cancer gene expression profiles are rarely reported in current literature, not least because many reports are of in vitro or animal studies. 15,16
In the present predictive model, the first seven most powerfully predictive genes exhibiting positive or negative correlations were NKX2-3, FXYD6, TGFB1I1, ACTG2, ANPEP, KLK11, and HOXB8. Li et al. 17 screened tumor suppressor genes in sporadic rectal cancer patients and identified the downregulated expression of NKX1-3, which was thought to be a possible tumor suppressor gene for rectal cancer. FXYD6 has been reported to be highly expressed in schizophrenic patients, 18 but whether FXYD6 is associated with tumor occurrence remains unknown. TGFB1I1 is involved in the differentiation of prostate cancer cells, and it upregulated in response to chronic stimulation with tumor necrosis factor, which can augment sensitivity to anti-androgen therapy. 19 Conversely, downregulated TGFB1I1 expression can promote prostate cancer cell proliferation and invasion; thus, TGFB1I1 is believed to a predictive factor for prostate cancer. 20 TGFB1I1 is thought to be a possible tumor suppressor gene for colorectal cancer. 21 Real-time PCR analysis in breast cancer cell line MCF-7CR showed that ACTG2 expression downregulation was associated with resistance to platinum-based chemotherapy, but ACTG2 expression upregulation might sensitize to platinum-based chemotherapy. 22 A study regarding a predictive biomarker model for advanced prostate cancer showed ANPEP was closely associated with prostate cancer metastasis, as a major oncogene involved in tumor cell metastasis. 23 HOXB8 expression is significantly downregulated in all colon cancer cell lines; and HOXB8 is believed to be associated with the occurrence of colon cancer. 24 KLK11 shows a negative correlation with prostate cancer staging and prognosis, 25 whereas highly KLK11-expressing ovarian cancer patients are more likely to have early-stage disease. KLK11 may be a sensitive marker for evaluating the prognosis. 26
DNA microarray analyses play a critical role in the identification of predictive genes. It offers rapid, high-output, high-efficiency analysis and processing of tumor biology data, and it can achieve rapid, automated, large-scale identification of target genes. 27 DNA microarray analyses of tumor cells exhibiting individually variable sensitivity to chemotherapy can detect differentially expressed genes at the genomic level, and it can identify candidate gene expression profiles that may be able to predict chemotherapy response with a combination of multiple factors. The HG-U133 Plus 2.0 Array is an in situ-synthesized oligonucleotide probe array for whole human genome, which contains EST probes for more than 54,000 target genes and 47,000 transcripts involving 3,850 characteristic human genes. The gene chip has high reliability and enabled the simultaneous identification of the seven predictive genes mentioned here. Our results show that the predictive model had an accuracy of 93.3%, with high predictive power and sensitivity. Our model avoids the uncertainty over single-factor prediction, and may be a useful tool in decisions regarding the individualized treatment of ACC.
Acknowledgments
We sincerely thank William Brown for reviewing our article and are highly appreciative of all the authors. Thank you all. This article is supported by the grant to Pan Chi from the National Natural Science Foundation of China (NSFC); Project Approval No. 30872479; Grant No. 300,000 RMB and the grant to Xingrong Lu from the Natural Science Foundation of Fujian Province; Project Approval No. 2011J01172; Grant No. 100,000 RMB.
Footnotes
Disclosure Statement
All authors declare that there is no financial or other conflict of interest.