
Abstract
The purpose of this study was to explore the role of neuropeptide Y (NPY) on molecular and histological changes in human pituitary adenomas. The localization of NPY and its expression at the protein, messenger RNA (mRNA), and receptor levels were investigated here in different subcategories of pituitary adenomas. Immunohistochemical staining was performed in all cases to assess expression of NPY. Reverse transcription–polymerase chain reaction (RT-PCR) was used to study the mRNA expression of NPY. NPY subcellular localization was observed using immunoelectron microscopy in cytoplasm, rough endoplasmic reticulum, and cell matrix in four of the six cases of pituitary adenoma. NPY protein expression was observed in 59.6% of 57 cases of pituitary adenoma and in 2 cases of pituitary hyperplasia. mRNA expression of NPY was observed in all 57 cases of pituitary adenoma and in 2 cases of pituitary hyperplasia. Significantly different levels of expression were observed across different subcategories of pituitary adenoma. mRNA expression of Y1R and Y2R was observed across all subcategories of pituitary adenomas, and a positive correlation was observed between NPY and Y2R. In conclusion, evidence is provided here for the expression of NPY and its receptors, Y1R and Y2R, in human pituitary adenoma, and the levels of expression were found to differ across different subcategories. Differences in expression of Y2R in human pituitary adenomas were found to have remarkable statistical significance.
Introduction
Neuropeptide Y (NPY) was first discovered in pig brain tissue by Tatemoto et al. in 1982. 1 Since then, researchers around the world have carried out extensive studies to further investigate the expression and function of NPY. It is now widely accepted that NPY is a neuromodulator and that it has both the transmission function of a neurotransmitter and the regulatory function of an endocrine hormone, participating in the coordination of physiological functions. 2 However, it remains unknown whether NPY takes part in certain specific diseases, most notably tumors of the neuroendocrine system, such as pituitary adenomas, what roles it plays in the development and growth of these pituitary adenomas, and its interactions with other endocrine changes.
To answer these questions, it is necessary to determine the localization of NPY in human pituitary adenoma cells. This provides a morphological basis for NPY in human pituitary adenomas. Determining levels of expression of NPY and its receptors, Y1R and Y2R, in human pituitary adenomas and the levels of expression of NPY across different subcategories may help delineate its roles in the pathogenesis. Clinical materials, immunohistochemical staining, and reverse transcription–polymerase chain reaction (RT-PCR) were used to investigate the expression of NPY in pituitary adenomas at the protein and messenger RNA (mRNA) levels and to find any correlation between immunohistochemical and molecular biological features. Nested PCR (N-PCR) was used to determine the role of NPY in human pituitary adenomas with respect to its two receptors (Y1R and Y2R).
The purpose of this study was to clarify the role of NPY in the histological changes and molecular biology of human pituitary adenomas and to characterize their relationships with different subcategories of pituitary adenomas.
Materials and Methods
Clinical materials
Specimens were collected from 57 patients with pituitary adenomas and 2 patients with pituitary hyperplasia. All were clinically, surgically, and pathologically diagnosed at the Department of Neurosurgery of Tianjin First Central Hospital and Department of Neurosurgery of General Hospital of Tianjin. Paraffin sections of the specimens, 5 μm thick, were prepared for use in tissue pathological and immunohistochemical staining. Six samples of fresh pituitary adenomas were collected for immunoelectron microscopy tests. After the specimens were collected from the patients, they were immediately trimmed into small blocks with a volume of 1 × 1 × 1 mm, placed in electron microscope fixation liquid, and stored in a refrigerator at 4°C until testing. After the fresh specimens were collected from the patients during surgery, they were immediately placed in liquid nitrogen and stored for genetic testing for NPY. Tumor invasiveness was determined mainly by imaging and visual examination and observation during surgery according to the classification schemes developed by Hardy and modified by Wilson. 3 Grades III and IV and stages C, D, and E were considered here as aggressive pituitary adenomas. 2
Main reagents
Immunohistochemistry kits and primary antibodies used in this study included an NPY RIA Kit (Beijing Dongya Institute of Biotechnology), PRL RIA Kit (Tianjin Depu Diagnostic Products Corporation), rabbit polyclonal prolactin (Signet Corporation), rabbit antimouse NPY (Wuhan Boster Bio-Engineering Co., Ltd.), rabbit antimouse NPY (Wuhan Boster Bio-Engineering Co., Ltd.), NPY1R mRNA in situ hybridization (ISH; Tianjin Haoyang Biological Manufacture Co., Ltd.), and NPY2R mRNA ISH (Tianjin Haoyang Biological Manufacture Co., Ltd.). Second and third antibodies were from a ready-to-use SABC Reagent Kit—SA1022 (rabbit IgG). Reagents used in RNA extraction and RT-PCR and N-PCR experiments included guanidine thiocyanate (Amasco, separately packed), sarkosyl (Sigma), chloroform/isoamyl alcohol (Nanjing Shengxing Biotechnology Co., Ltd.), isopropyl alcohol (North China Special Reagents Development Center), dNTP (Shanghai Sangon Biotech Co., Ltd.), DTT (Sigma, separately packed), reverse transcriptase MMLV (Promega Corporation), Oligo(dt)18 (Shanghai Sangon Biotech Co., Ltd.), Taq enzyme (Shanghai Shenergy Biocolor Bioscience and Technology Company), DL2000 [TaKaRa Biotechnology (Dalian) Co., Ltd.], RNasin (Promega Corporation), and NPY and β-actin PCR primers synthesized by Shanghai Sangon Biotech Co., Ltd.
Immunohistochemical staining
Immunohistochemical staining and immunoelectron microscopy were performed to assess the expression of NPY in pituitary adenomas at the protein level and its localization on the ultrastructure of pituitary adenomas. Rabbit antihuman NPY polyclonal antibody was purchased from Boster Corporation. Phosphate-buffered saline replaced the first antibody and so served as a negative control. The specific procedure of operation is not included here. Determination of immunohistochemical staining results was performed as follows: cells whose cytoplasm and nuclei contained brown particles with a staining intensity higher than that of the background nonspecific staining were considered positive. The assessment was made from the following two perspectives by using the method reported by Mattern 4 : (1) staining intensity: no staining (score 0), weak staining (score 1), moderate staining (score 2), and high staining (score 3); (2) relative number of positive cells: no staining (score 0), <25% cells stained (score 1), 25%–50% cells stained (score 2), and >50% cells stained (score 3). Counting method was as follows: for each case, 10 different high-power lens fields (×400) were randomly selected for determination of the number of positive and negative cells. The relative number of positive cells was then calculated and the average determined. The proliferation index of pituitary adenomas was measured by Ki-67 immunohistochemical staining. Ki-67 monoclonal antibody MIB-1 was purchased from Dako Company. Staining results were calculated as the relative number of positive cells among the total number of tumor cells.
Immunoelectron microscopy
The low-temperature embedding technique was adopted for immunoelectron microscopy testing. The specific procedure was as follows. After the specimens were collected from the patients, they were cut into small tissue blocks with a volume of about 1 mm3 and fixed for 2 hours in immune microscopy fixing solution at 4°C. The process of embedding in LR white resin was carried out at 4°C. The specimens were dehydrated twice using gradient ethanol (60% ethanol 30 minutes, 80% ethanol 30 minutes, and 95% ethanol 30 minutes). They were then suspended in a mixture of LR white resin and 95% ethanol (2:1) for 1 hour. The specimens were then embedded in pure LR white resin at 4°C for 72 hours. Specimens were immunolabeled at 4°C. The ultrathin sections were placed on nickel screens covered in Formvar film. The first antibody was rabbit antimouse NPY antibody. The second antibody used in immunoelectron microscopy tests was colloidal gold-conjugated goat antirabbit IgG, with a diameter of 10 nm. A JEM-100CXII transmission electron microscope was used for observation of low-temperature embedding specimens.
Polymerase chain reaction
Expression of NPY and its receptors, Y1R and Y2R, was measured with RT-PCR and N-PCR. N-PCR was simply regular PCR conducted in two successive runs. The first run used a set of primers to amplify a large fragment and the second run used the previous PCR product as a template with a new set of primers to amplify a shorter fragment within the large fragment. This strategy was used here to increase specificity because nonspecific amplification cannot be performed during a second run. PCR primers were designed for Y1R, Y2R, and β-actin, respectively, in accordance with the mRNA sequences as found in the GenBank (Supplementary Tables S1 and S2; Supplementary Data are available online at
Statistical analysis
The Statistical Package for the Social Sciences (SPSS) version 11.5 was used to process the experimental data. Two groups of data were first processed for the homogeneity test of variance. The t-test and t′-test were used for this purpose. Variance analysis was used to compare multiple groups of data, and the Newman–Keuls test (q test) was used for paired comparison of multiple groups of data. Linear correlation analysis was used for two groups of numerical variables. A p-value of <0.05 was considered statistically significant.
Results
Clinical and pathological characteristics
The patients ranged in age from 16 to 72 years with an average age of 45 years. There were 30 male patients and 29 female patients, with a male-to-female ratio of ∼1:1. In addition to routine hematoxylin and eosin (H&E) staining, special stains for the six pituitary markers (growth hormone [GH], prolactin hormone [PRL], adrenocortical hormone [ACTH], thyroid-stimulating hormone [TSH], follicle-stimulating hormone [FSH], and luteotropic hormone [LH]) were also performed. The adenomas ranged in length from 0.8 to 7 cm with an average of 2.97 cm. Among them, there were three small adenomas (1 cm), accounting for 5.3% of the total 57 cases of pituitary adenomas; 38 moderately sized adenomas (1–3.9 cm), accounting for 66.7% of the total cases; and 16 very large adenomas (≥4 cm), accounting for 28.1% of the total. There were 27 of 57 invasive cases, accounting for 47.4% of the total, and 30 of 57 noninvasive cases, accounting for 52.6% of the total. Pituitary adenomas were studied by a combination of methods, including observation of patients' clinical symptoms, endocrine tests, pathological analysis, and immunohistochemical tests. Table 1 shows the general clinicopathologic characteristics of the patients in this study.
GH, growth hormone; PRL, prolactin hormone; ACTH, adrenocortical hormone; FSH, follicle-stimulating hormone; LH, luteotropic hormone; TSH, thyroid-stimulating hormone.
Localization of NPY at the subcellular level
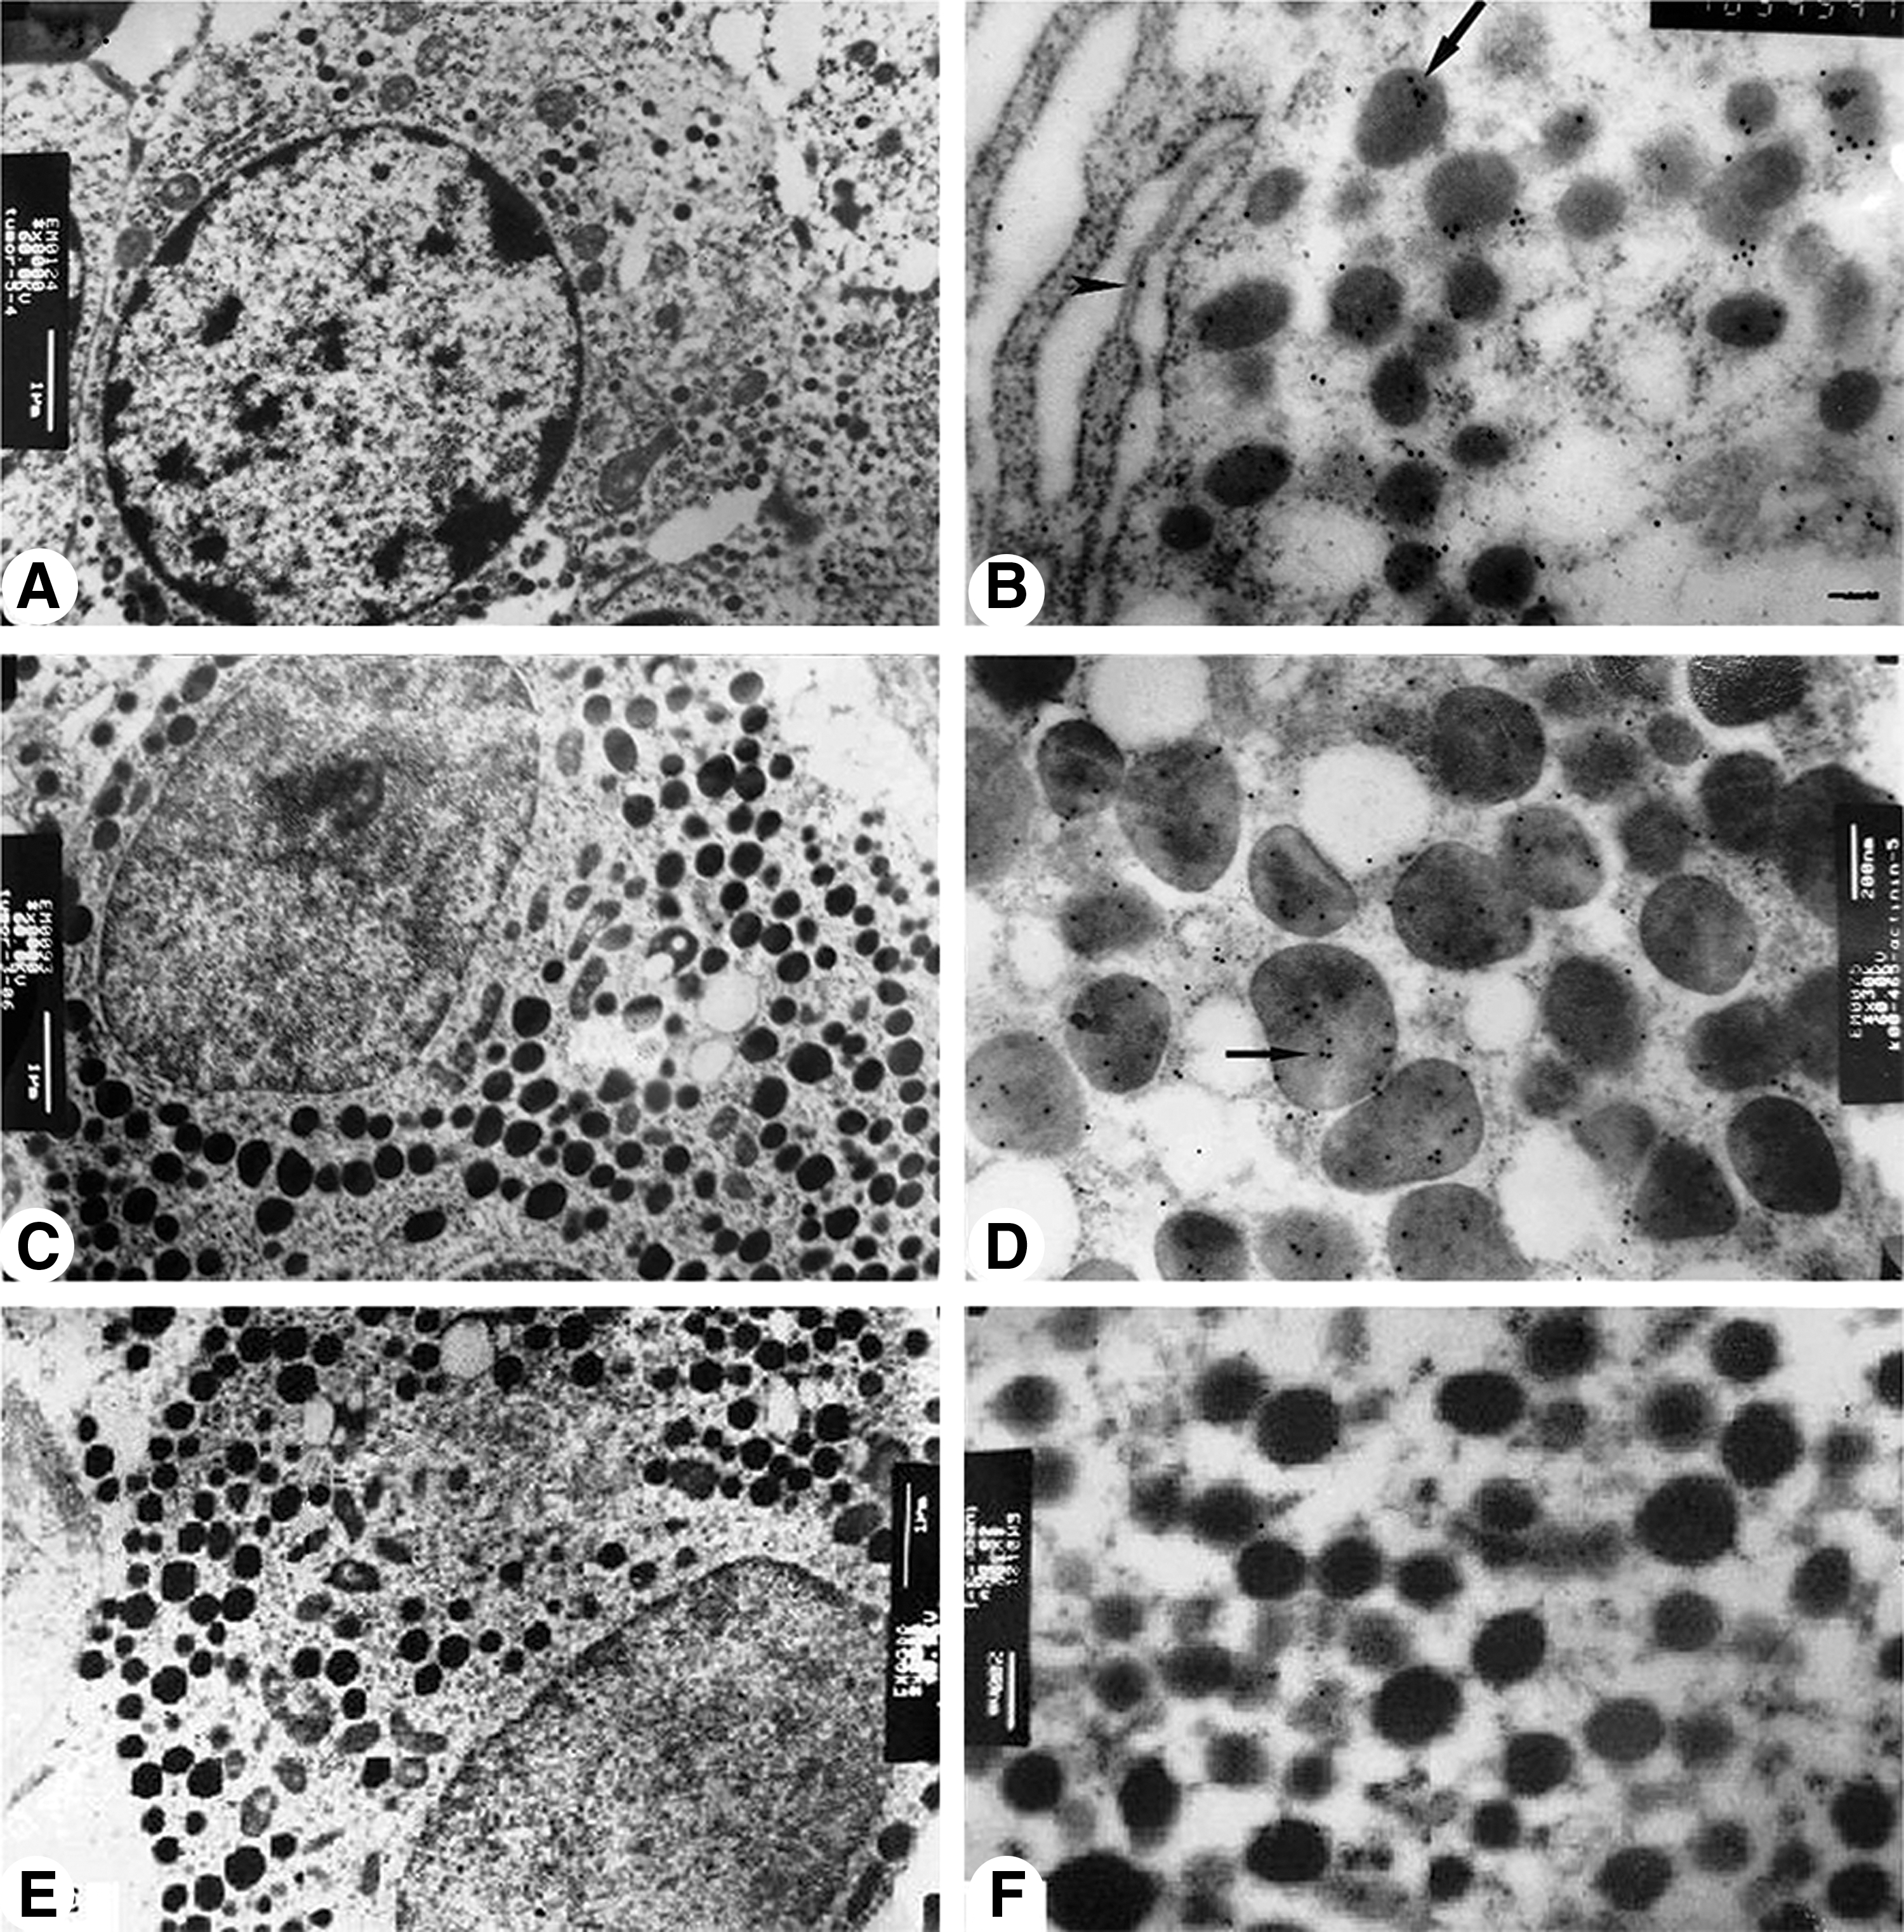
Specimens from six cases of pituitary adenoma (including two cases of GH adenomas, one case of GH-PRL mixed adenoma, two cases of prolactinoma, and one case of gonadotrophic cell adenoma) were studied using immunoelectron microscopy. From these six cases, four showed positive results for NPY. These included two cases of GH adenomas, one case of GH-PRL mixed adenoma, and one case of gonadotrophic cell adenoma. They also included colloidal gold particles that were scattered in small patches, mainly in the secretory granules of the cytoplasm (Fig. 1A–D). Colloidal gold particles were also occasionally observed in the rough endoplasmic reticulum and cell matrix, but nonspecifically absorbed colloidal gold particles were only rarely observed in other organelles. Positive NPY particles were occasionally observed in the two cases of prolactinoma (Fig. 1E, F).
Expression of NPY at the protein level
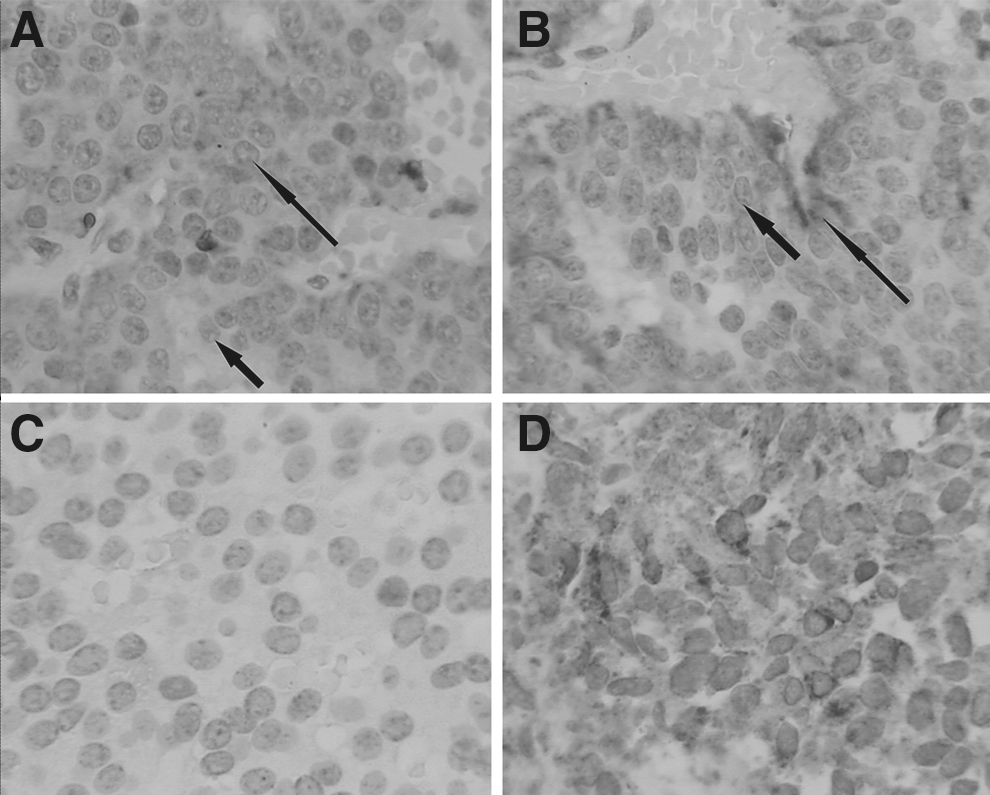
NPY expression was positive in 34 of the 57 cases of pituitary adenomas, with a positive rate of 59.6%. Immunohistochemical staining tests showed tumor cells having interfusing, sinusoidal, papillary, and mixed arrangements. NPY staining was observed mainly in the cytoplasm, and positive adenomas had a nest-shaped, strip-shaped, cord-shaped, or dispersive distribution (Fig. 2A). Staining of some vascular endothelial cells was also observed, and tumor cells around the vessels showed strong staining (Fig. 2B). In cases negative for NPY expression, neither the cytoplasm nor the nucleus was stained (Fig. 2C). In invasive pituitary adenomas, tumor cells positive for NPY staining showed no regular arrangement (Fig. 2D).
The relationship between NPY expression and pathological classification of pituitary adenomas was evaluated. Pituitary adenomas were classified into six subcategories according to the results of immunohistochemical testing, that is, prolactinoma, GH adenoma, ACTH adenoma, FSH adenoma, LH adenoma, and TSH adenoma. In this study, the regular patterns of NPY expression are discussed with respect to different subcategories of pituitary adenoma (Fig. 3). The rate of NPY expression was the highest for gonadotrophic adenoma at 91.7%, followed by GH adenoma and ACTH adenoma, which were both 66.7%. The rates of NPY expression were 50% for both null cell adenoma and mixed adenomas (tumors containing two or more types of cells). The rate of NPY expression was the lowest for prolactinoma at 25%. Rates were compared using the row using χ2 analysis; results showed that the differences in NPY expression across the various subcategories of adenomas were statistically significant (χ2 = 11.64, p = 0.04) and that the rates of expression in gonadotrophic adenoma and GH adenoma were significantly higher than in prolactinoma (p < 0.05).
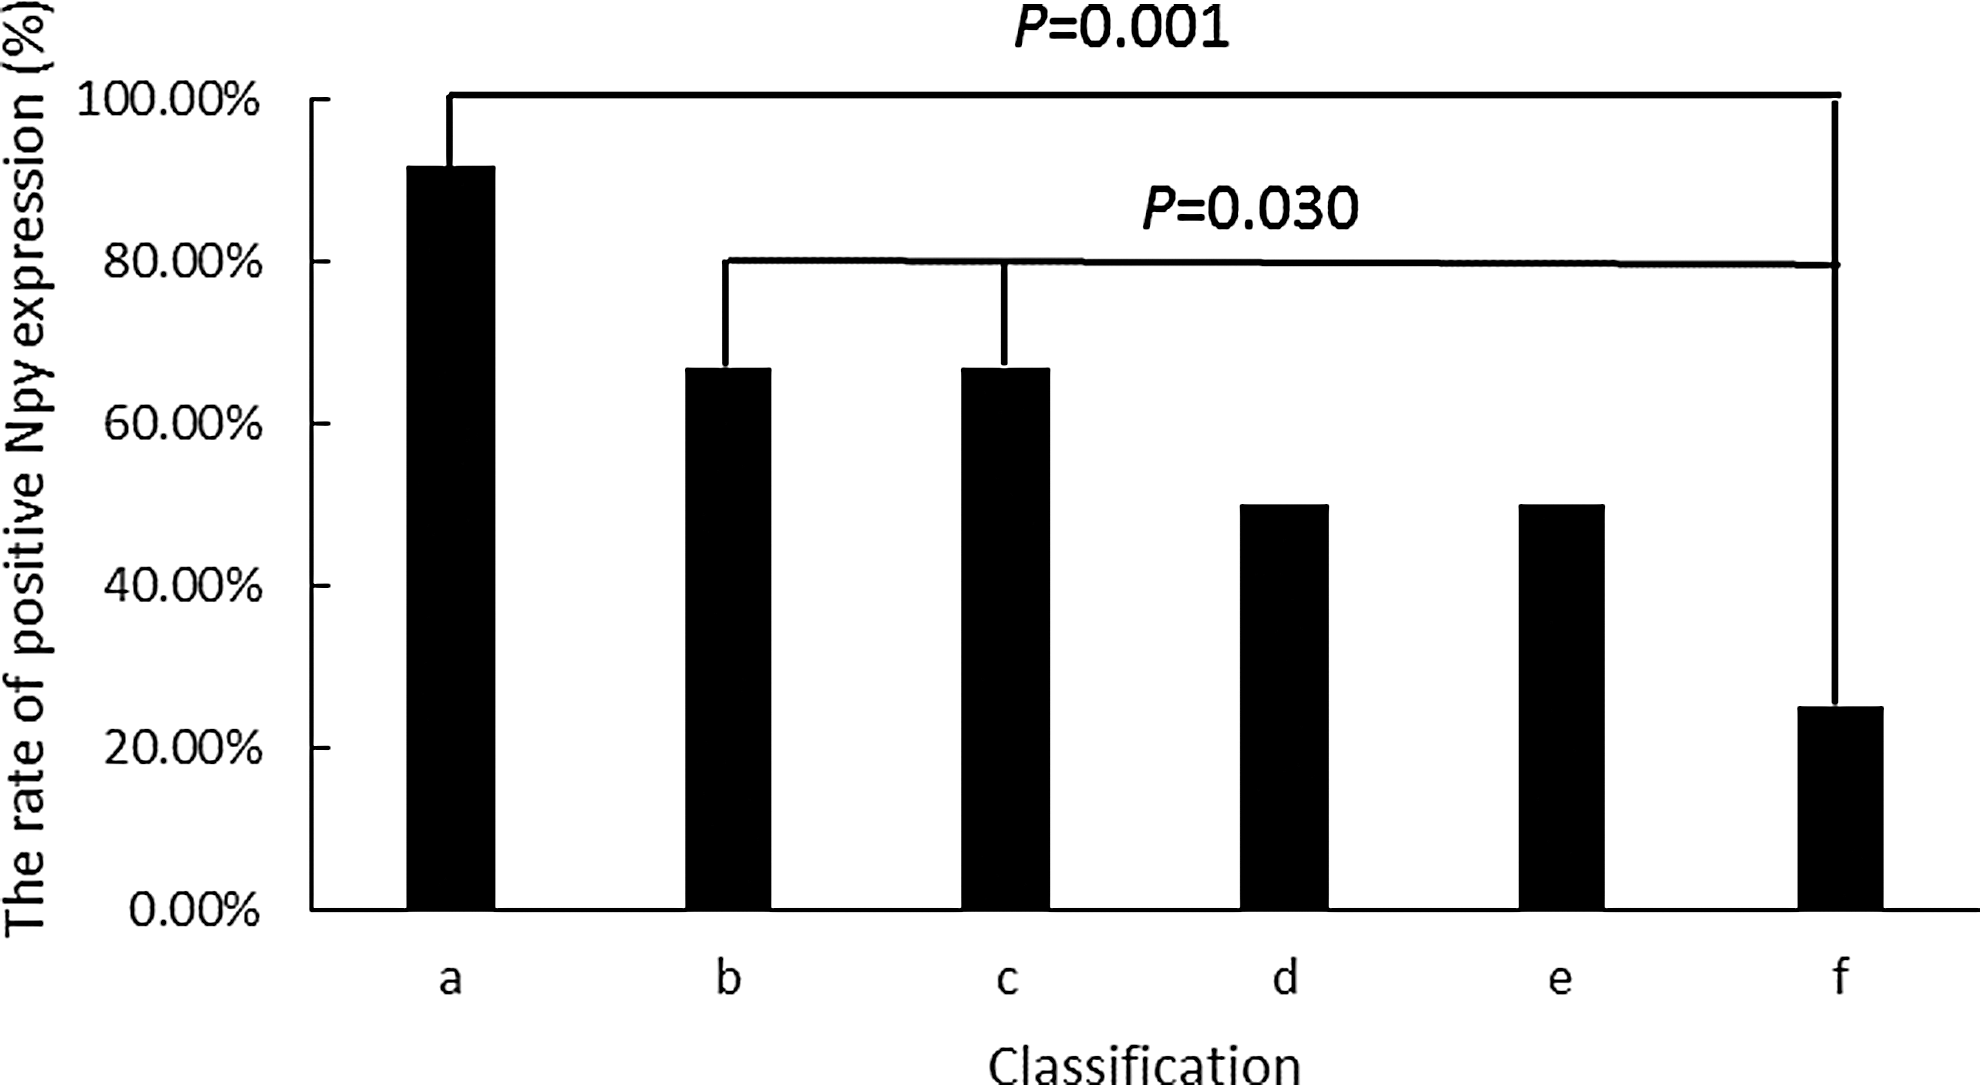
Relationship between NPY expression and pathological classification of pituitary adenomas. Pathological classification of pituitary adenomas: (a) FSH/LH adenoma, (b) GH adenoma, (c) ACTH adenoma, (d) null cell adenoma, (e) mixed adenoma (adenoma with two or more types of positive hormones), and (f) prolactinoma. ACTH, adrenocortical hormone. FSH, follicle-stimulating hormone; LH, luteotropic hormone.
The relationship between NPY expression and clinical classification of pituitary adenomas was also evaluated. The cases in this study were divided into nonfunctioning adenoma, GH adenoma, prolactinoma, and gonadotrophic adenoma based on their clinical symptoms, endocrine tests, and immunohistochemical tests. In these ways, the levels of NPY expression and their regular patterns were examined across various subcategories of tumors (Fig. 4). Except for the two cases of prolactinoma-GH mixed adenoma, which were both positive for NPY expression, the levels of NPY expression for nonfunctioning adenomas and GH adenoma were similar, 80% and 73%, respectively. The level of NPY expression for PRL was only 14.3%, which was significantly lower than for other subcategories of adenomas. χ2 analysis indicated that differences in the levels of NPY expression across the various subcategories of adenomas were statistically significant (χ2 = 10.29, p = 0.006), and the rate of NPY expression for prolactinoma was significantly lower than for the three other subcategories of adenomas (p < 0.05).

Relationship between NPY expression and clinical classification of pituitary adenomas: (a) nonfunctioning adenoma, (b) GH adenoma, (c) prolactinoma, and (d) gonadotrophic adenoma.
The relationship between the level of NPY expression and invasiveness of pituitary adenomas was evaluated as follows: pituitary adenomas were classified here as either invasive or noninvasive according to the classification scheme developed by Hardy and modified by Wilson. 3 In this study, there were 27 invasive cases and 30 noninvasive cases. The rate of positive NPY expression for invasive pituitary adenomas was 59.26%, which was lower than the 63.33% recorded for nonaggressive pituitary adenomas, but the difference was not statistically significant (χ2 = 0.076, p > 0.05) (Table 2).
Comparison of the positive expression rates for aggressive and nonaggressive pituitary adenomas showed χ 2 = 0.076, p = 0.783 > 0.05.
NPY, neuropeptide Y.
NPY mRNA expression
NPY mRNA expression was found across all 57 cases of pituitary adenomas and both cases of pituitary hyperplasia. Semiquantitative evaluation of mRNA expression of NPY was undertaken using β-actin as the internal control, and the results are shown in Table 3. Statistical analysis suggested that there was no correlation between the level of genetic expression of NPY and patient age (r = −0.131, p > 0.05). The differences between male and female participants were also not statistically significant (p > 0.05). However, differences in the genetic expression of NPY across different subcategories of pituitary adenomas were statistically significant (F = 4.21, p < 0.01) (Fig. 5). According to the Q test used in paired comparison of different subcategories, gonadotroph cell adenoma had the highest level of mRNA expression of NPY (7.00 ± 8.32), which was 9.3 times that of prolactinoma (0.75 ± 0.11) (q = 5.2616, p < 0.01), 2.7 times that of GH adenoma (2.59 ± 3.06) (q = 4.07, p < 0.05), and 5.8 times that of nonfunctioning adenomas (2.59 ± 3.06) (q = 5.2616, p < 0.01). The differences across other subcategories were not statistically significant (p > 0.05). The tumor cell proliferation index (Ki-67) was used to indicate the proliferation activity of tumor cells. 2 Statistical analysis showed different subcategories of pituitary adenomas to differ from each other in terms of the proliferative index (F = 3.07, p < 0.05). Q test results suggested that Ki-67 for prolactinoma was 1.8 times greater than that for gonadotrophic cell adenoma and that the difference was statistically significant (q = 4.71, p < 0.05), but the differences across the other subcategories were not statistically significant (p > 0.05). Correlation analysis was also performed on the data. No correlation was observed between the mRNA expression of NPY and tumor length (r = −0.112, p > 0.05), serum prolactin level (r = 0.055, p > 0.05), or GH level (r = 0.012, p > 0.05). However, for GH adenoma, there was a positive correlation between the mRNA expression of NPY and the level of serum GH (r = 0.562, p < 0.05). No correlation was observed between Ki-67 and tumor size (r = 0.056, p > 0.0) or the expression of NPY mRNA (r = 0.129, p > 0.05). However, study of the different subcategories of pituitary adenomas showed a negative correlation between the level of mRNA expression of NPY and Ki-67 across different subcategories of pituitary adenomas (r = −0.781, p < 0.05). The mRNA expression of NPY and Ki-67 across different subcategories of pituitary adenomas is shown in Figure 6.
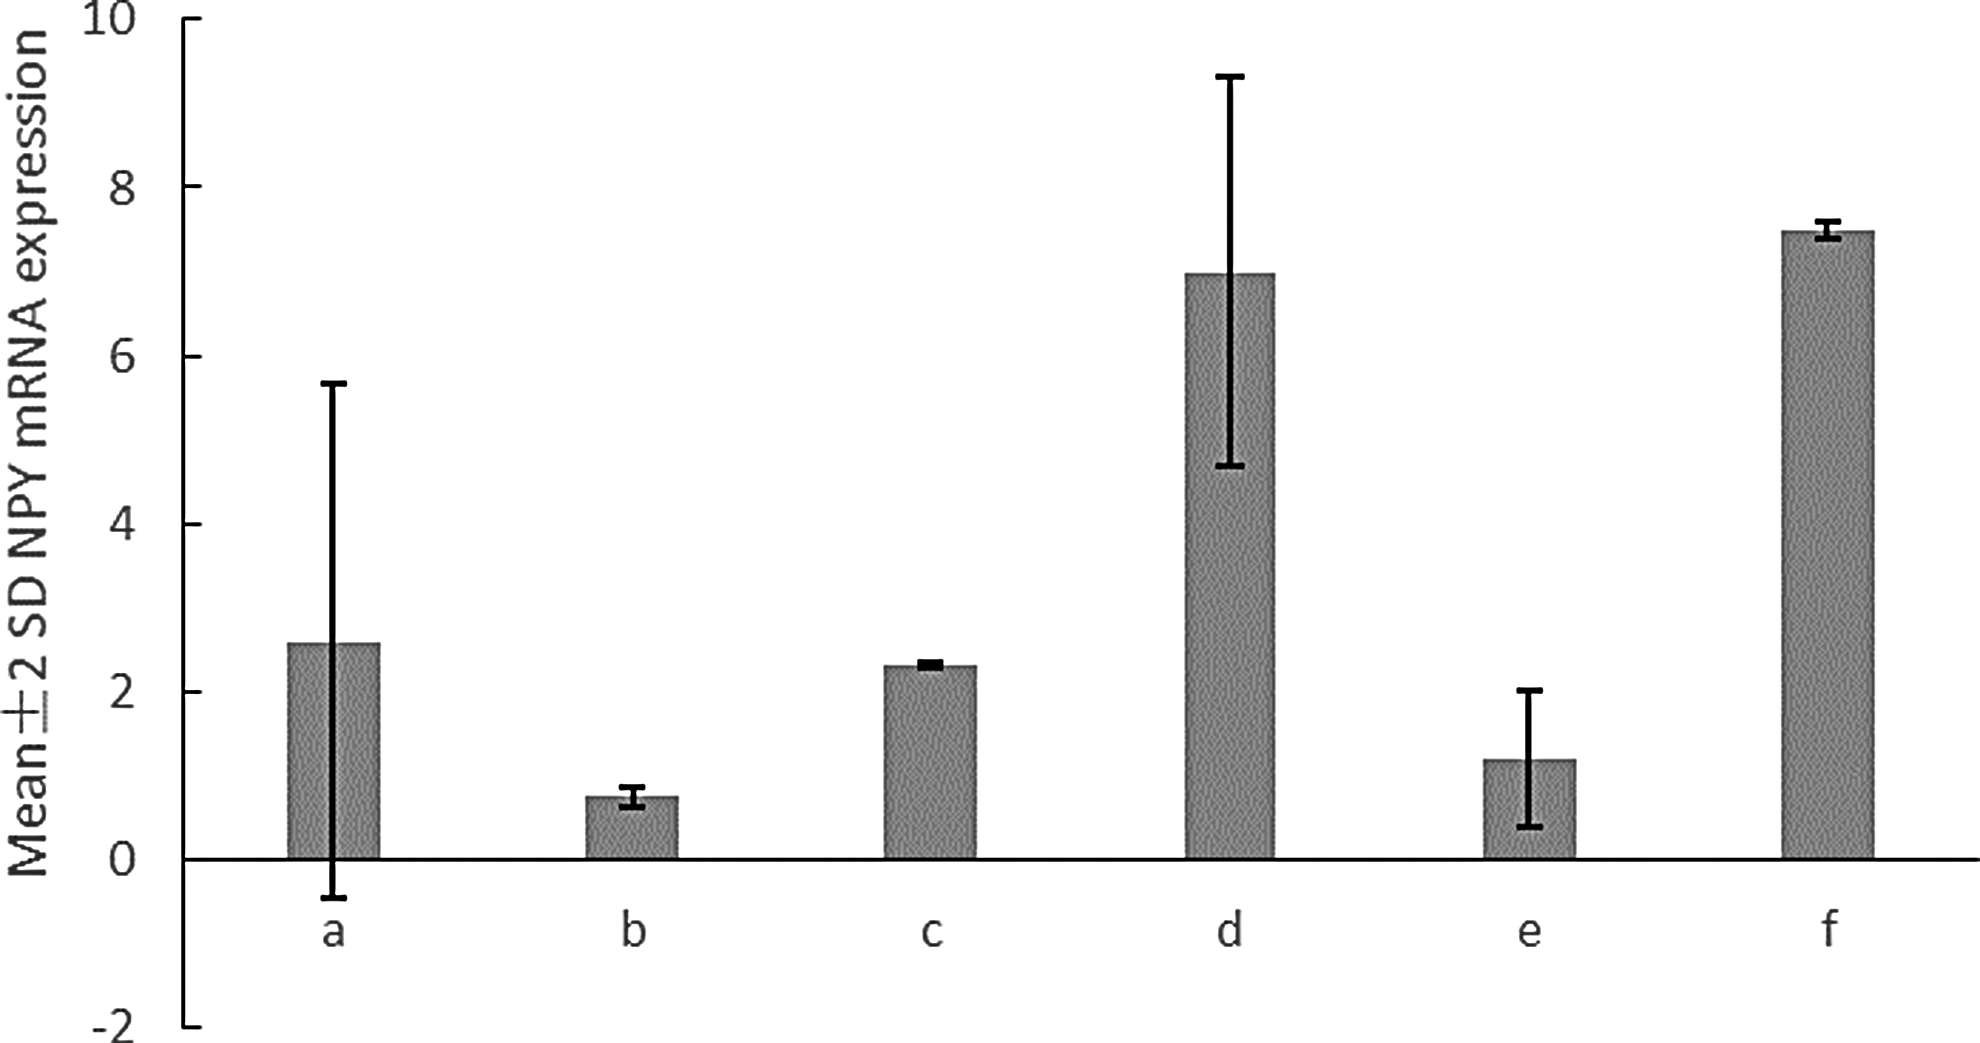
NPY mRNA expression across different subcategories of pituitary adenomas and pituitary hyperplasia (p < 0.01). (a) GH adenoma, (b) PRL prolactinoma, (c) ACTH adenoma, (d) gonadotrophic cell adenoma, (e) nonfunctional adenoma, and (f) pituitary hyperplasia. mRNA, messenger RNA; PRL, prolactin hormone.
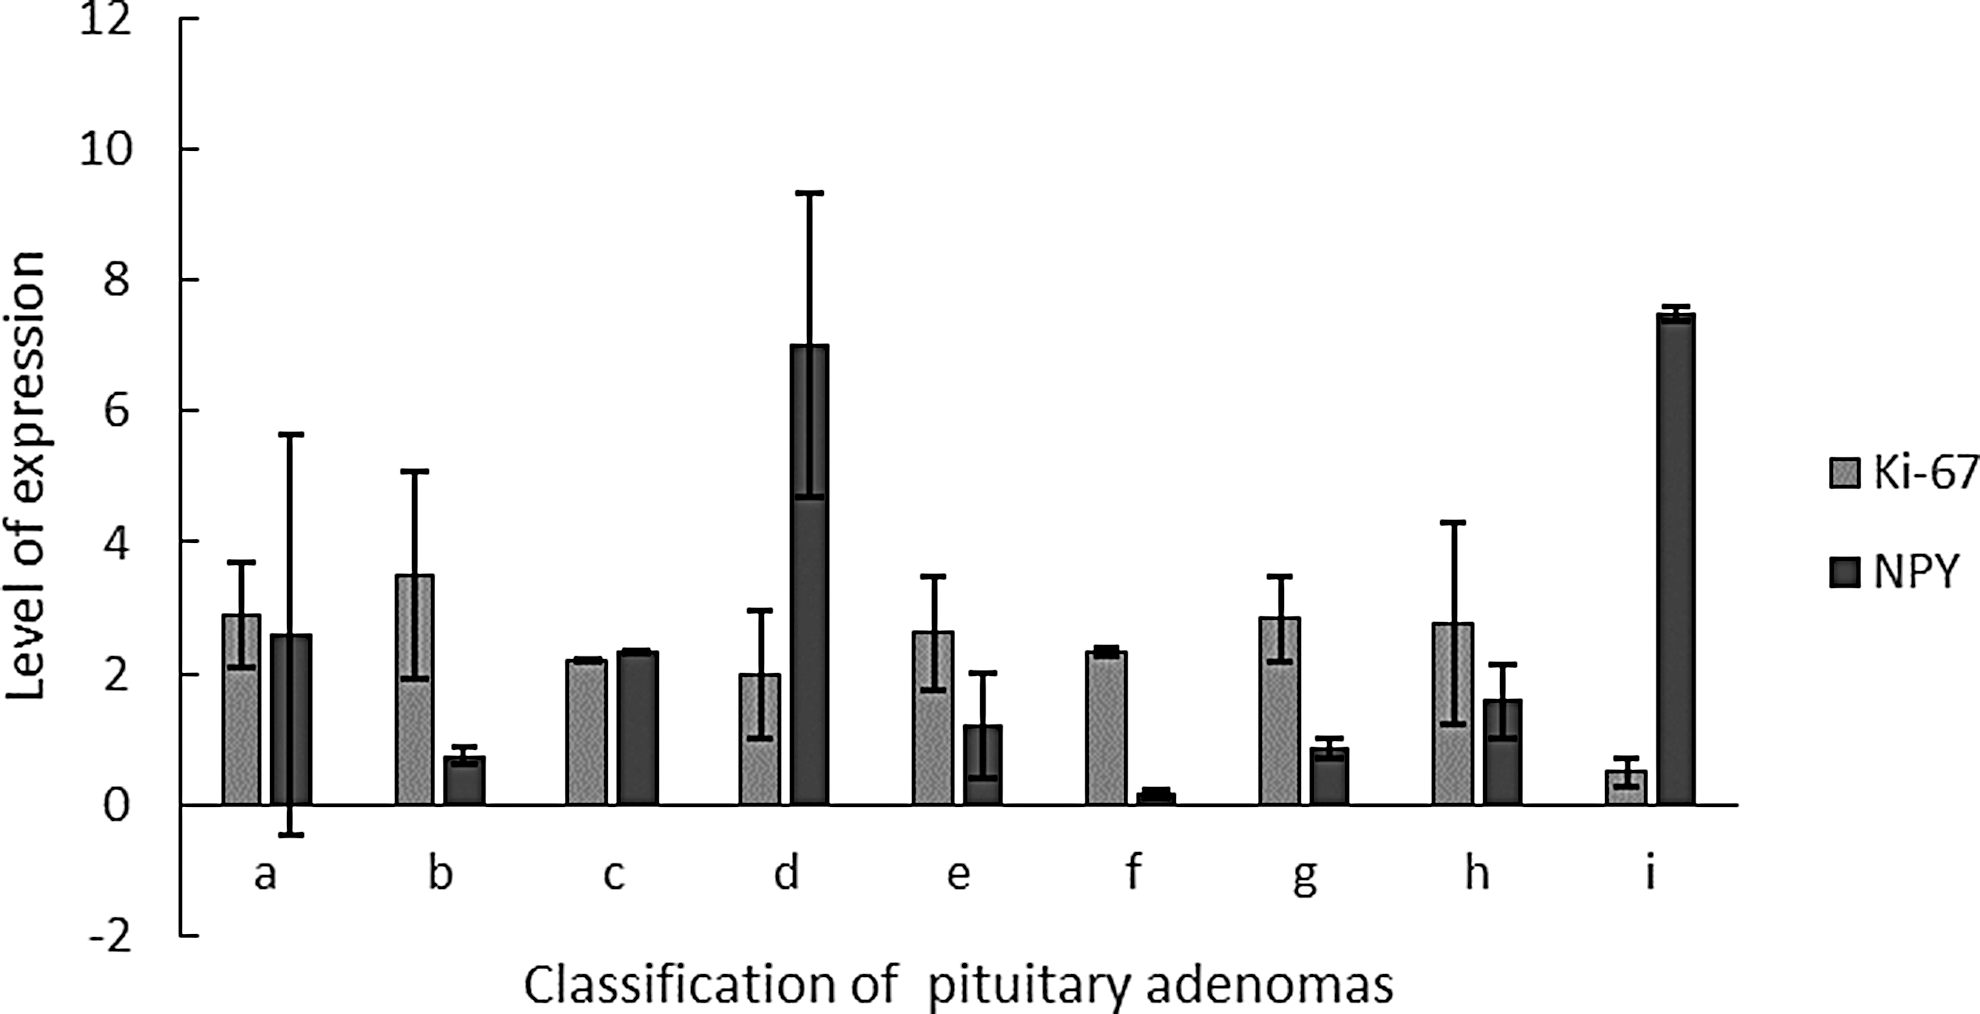
Expression of NPY and Ki-67 across different subcategories of pituitary adenoma and pituitary hyperplasia: (a) GH adenoma, (b) prolactinoma, (c) ACTH adenoma, (d) gonadotrophic cell adenoma, (e) nonfunctional adenoma (including static-type ACTH adenoma, null cell adenoma, and multihormone cell adenoma), (f) static-type ACTH adenoma, (g) multihormone cell adenoma, (h) null cell adenoma, and (i) pituitary hyperplasia. A negative correlation was found between the expression of NPY and that of Ki-67 across different subcategories of pituitary adenoma (p < 0.05).
p < 0.05 when compared with gonadotroph cell adenoma; b p < 0.05 when compared with GH adenoma, prolactinoma, and nonfunctioning adenoma.
mRNA, messenger RNA.
Expression of Y1R and Y2R in pituitary adenomas
Unlike mRNA expression, which was assessed using RT-PCR, the expression of NPY receptors in pituitary adenomas was measured using N-PCR to detect mRNA levels of Y1R and Y2R, and the correlation between these two was analyzed. The results showed a positive correlation between NPY and Y2R (r = 0.414, p = 0.003), but no correlation between NPY and Y1R (r = −0.123, p = 0.405), and no correlation between Y1R and Y2R (r = 0.158, p = 0.284).
N-PCR analysis indicated mRNA expression of Y1R, Y2R, and β-actin across all subcategories of pituitary adenomas in these 57 cases (Figs. 7 and 8). Semiquantitative evaluation of mRNA expression of Y1R and Y2R was performed using β-actin as the internal control (Table 4). As shown, across all subcategories of pituitary adenomas, the mRNA expression of Y1R was not statistically significant (F = 1.97, p = 0.098). There was a statistically significant amount of Y2R mRNA expression (F = 2.703, p = 0.03). There was significantly less Y2R mRNA expression in prolactinoma than in GH adenoma and gonadotrophic adenoma. Regular patterns of Y1R and Y2R expression were also obvious. There were no statistically significant differences in Y1R or Y2R expression across different sexes (p > 0.05). No correlation was found between Y1R or Y2R expression and age, tumor size, or hormone levels. Positive correlations were observed between NPY expression and Y2R expression in GH adenomas (r = 0.558, p = 0.025). A negative correlation was found between Y2R expression and patient age in nonfunctioning pituitary adenomas (r = −0.562, p = 0.046). Positive correlations were observed between Y1R expression and the level of TSH in the patients' blood serum (r = 0.70, p = 0.036).
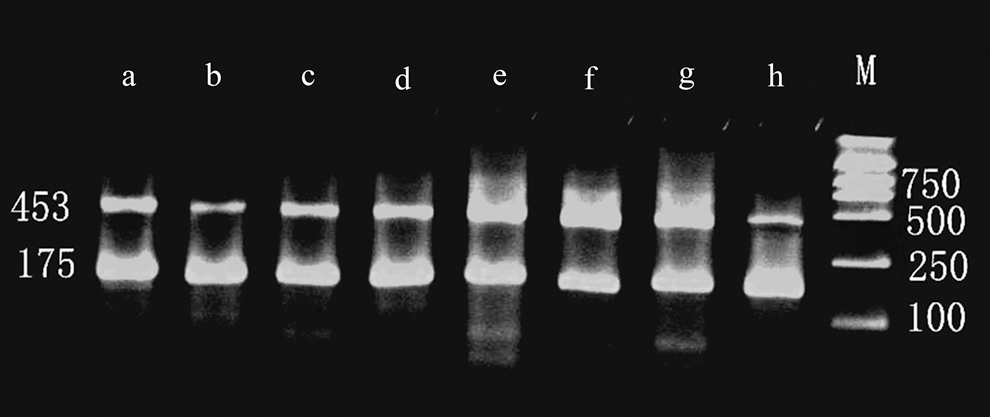
Electrophoretogram of expression of Y1R (175 bp) and β-actin (453 bp) in pituitary adenomas and pituitary hyperplasia: (a) GH adenoma, (b) gonadotrophic cell adenoma, (c) pituitary hyperplasia, (d) null cell adenoma, (e) prolactinoma, (f) static-type ACTH adenoma, (g) multihormone cell adenoma, and (h) ACTH adenoma.
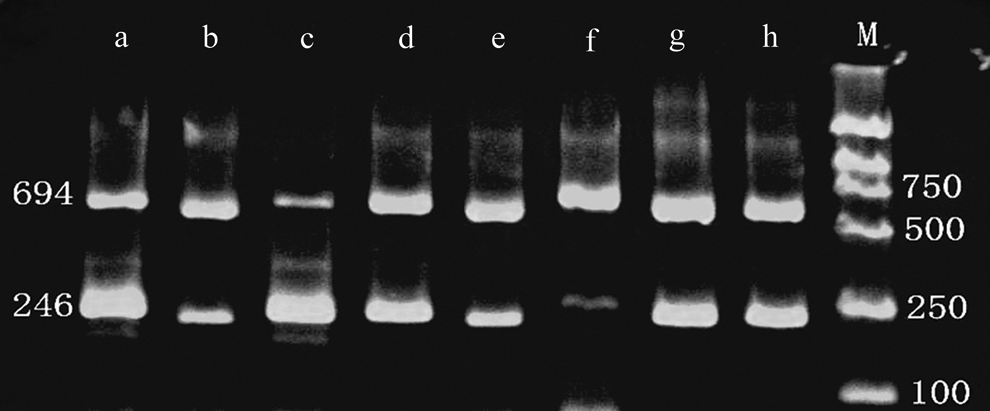
Electrophoretogram of expression of Y2R (246 bp) and β-actin (694 bp) in tissues of pituitary adenomas and pituitary hyperplasia (a) GH adenoma, (b) null cell adenoma, (c) static-type ACTH adenoma, (d) multihormone cell adenoma, (e) pituitary hyperplasia, (f) prolactinoma, (g) ACTH adenoma, and (h) gonadotrophic cell adenoma.
Comparison of GH adenoma, prolactinoma, and nonfunctioning adenoma showed that p < 0.05. Differences in the expression of Y2R were statistically significant across different subcategories of pituitary adenomas (F = 2.703, p = 0.03).
Comparison of GH adenoma and gonadotroph cell adenoma showed that p < 0.05. Differences in the expression of Y1R were not statistically significant across different subcategories of pituitary adenomas (F = 1.97, p = 0.098).
Discussion
Although it is universally accepted that NPY is a neurotransmitter and an endocrine hormone and that it participates in the coordination of many physiological functions, not much is known about its exact role in certain diseases, such as tumors of the neuroendocrine system. 2 In this study, the subcellular localization of NPY in human pituitary adenoma was examined using immunoelectron microscopy to identify morphological evidence of the role of NPY in human pituitary adenomas. NPY was located primarily in the secretory granules of the cells of pituitary adenomas, and secondarily in the rough endoplasmic reticulum and cell matrix, which is consistent with previous reports. Chabot et al. found NPY to be mainly located in the secretory granules in the cytoplasm, and a small amount was also found around the euchromatin and heterochromatin of the nucleus and on the cell membrane. 5 Earlier studies suggested that there were round and oval-shaped NPY secretory granules in the rough endoplasmic reticulum in the cytoplasm of prolactinoma cells of rats. Colloidal gold particles (10 nm) were scattered or distributed in small patches that showed a high electron density. A smaller number of particles were distributed in other organelles. 6 Experiments indicated the presence of NPY particles in human pituitary adenomas. They provide morphological evidence that NPY may play a role in the physiological functions of the body and in pathological processes.
The positivity of NPY protein expression in pituitary adenomas was 59.65% (34/57 cases) in the current study. According to pathological classification, the rate of NPY expression was the highest for gonadotrophic adenoma, at 91.7%, followed by GH adenoma and ACTH adenoma, which were both 66.7%. The rates of NPY expression were 50% for both null cell adenoma and mixed adenomas. The rate of NPY expression was the lowest for prolactinoma, at 25%. There may be a correlation between the rate of protein expression for pituitary adenoma and the subcategory of pituitary adenoma. This is consistent with test results addressing the levels of genetic expression of NPY and its receptors. Various subcategories of pituitary adenomas differed significantly in expression of mRNA and its receptors. The level of expression was the highest for gonadotrophic cell adenoma and the lowest for prolactinoma. The experimental results collected in this study were similar to those obtained by Grouzmann et al., who found the rate of expression of NPY to be 33% in pituitary adenoma, 48% in mixed cell adenoma, 22% in null cell adenoma, 29% in gonadotrophic adenoma, and 17% in GH adenoma. 7 The rate of NPY expression was only 12% in the normal pituitary tissues of the patients with pituitary adenoma. However, Grouzmann et al. believed that the levels of NPY expression were not related to the subcategory of pituitary adenoma. 7
Significant differences were observed in NPY mRNA expression across different subcategories of pituitary adenomas, where the expression of NPY mRNA was highest for gonadotrophic cell adenoma and lowest for prolactinoma. These results were similar to those of NPY expression in pituitary adenomas at the protein level and consistent with the results of earlier studies. 8 It can be inferred that the decrease in expression of NPY and its receptors in the pituitary adenomas is related to the formation of pituitary adenomas. Knerr et al. found the mRNA expression of NPY to be lower in pituitary adenomas and the level of NPY expression to differ across various subcategories of pituitary adenomas, with the most expression in GH adenoma, followed by nonfunctioning adenoma, and only slight expression in prolactinoma. 9
This study showed expression of Y1R and Y2R in all the 57 cases of pituitary adenoma. Differences in Y1R expression across various subcategories of pituitary adenomas were not statistically significant (F = 1.97, p = 0.098), and there was no correlation between Y1R expression and NPY expression (r = −0.123, p = 0.405). However, differences in Y2R expression across various subcategories were statistically significant (F = 2.703, p = 0.03), and the levels of expression in GH adenoma and gonadotrophic adenoma were significantly higher than in prolactinoma. These results were consistent with the level of NPY expression in human pituitary adenomas at the genetic and protein levels. In the meantime, a positive correlation was observed between NPY expression and Y2R expression in pituitary adenomas (r = 0.414, p = 0.0037). This suggests a close relationship between NPY and Y2R in pituitary adenomas. It can be inferred from this that NPY plays a role in the development and growth of pituitary adenomas and in the regulation of hormone secretion. This gives rise to various complex clinical symptoms and physical signs. Y1R may have negligible participation in the regulation of endocrine activity, but may instead be related to the biological behaviors of tumors or other receptors of NPY and may play its role in this way. These issues merit further exploration.
The role that NPY plays may depend on the histological types of adenomas in the pituitary. For example, studies by Lamberts in prolactinoma suggested that NPY could directly inhibit the secretion of prolactin cells in the pituitary and increase dopamine (DA)-induced inhibition of the secretion of prolactin. 10 It could also affect the cell membrane Ca2+ passages and counteract thyrotropin-releasing hormone (TRH)-induced secretion of prolactin. This study showed significantly less expression of NPY and Y2R than in GH adenoma and gonadotrophic cell adenoma, and the differences in Y1R expression across various subcategories of pituitary adenomas were not statistically significant. However, judging from the trends in expression, the expression of NPY and Y2R in prolactinoma was also quite low. Ogasawara et al. detected the expression of NPY and its receptor, Y2R, in cow adenohypophysis. 11 The results of rat pituitary cell intervention experiments showed that NPY from an extraneous source can inhibit the secretion of prolactin of the pituitary. Its inhibitory effect was more pronounced when it was used in combination with DA and it was also able to counteract secretion of prolactin induced by TRH. NPY has a mechanism similar to that of DA, in that it plays its regulatory role by lowering the withdrawal of Ca2+ into prolactin cells. 2 Relevant studies showed that Y2R agonist could selectively inhibit the passage of Ca2+. 12 Some researchers believe that NPY receptors and prolactin-releasing hormone (PRLH) have the same origin. NPY can competitively combine with PRLH receptors to inhibit the secretion of prolactin. 13 These studies indicate that NPY may inhibit the secretion of prolactin through Y2R (Y1R may also participate in the regulation). Because there is less expression of NPY and Y2R in prolactinoma, the inhibitory autocrine regulation effect of NPY is weakened, resulting in hyperfunction of secretion of the prolactinoma, followed by significant increases in the level of prolactin and decreases in the level of NPY in the blood plasma. 14
Studies of gonadotrophic adenomas have shown that NPY can regulate the secretion of gonadotropic cells at both the hypothalamus and the pituitary levels. 15 Results showed that NPY increases the level of activity of gonadotrophic cells in both the hypothalamus and pituitary. This causes a great deal of NPY expression in gonadotrophic adenoma. The current study showed that levels of mRNA expression for both NPY and Y2R were markedly higher in gonadotrophic adenomas. In GH adenoma, both NPY and Y2R showed a relatively high level of expression. Positive correlation was recorded between the two (r = 0.558, p = 0.025). This indicated that NPY in GH adenoma might be able to regulate the synthesis and secretion of GH. NPY regulates the secretion of GH through the hypothalamus not only by negative feedback regulation but also through direct stimulation of the pituitary adenoma. 2,16 The results of the present study showed significantly higher levels of mRNA expression of NPY and Y2R in GH adenomas than in other subcategories of pituitary adenoma. This contradicted the results of an earlier clinical study, in which a negative correlation was recorded between the concentration of NPY and that of GH in the blood serum of patients with GH adenoma (r = −0.962, p = 0.001). 14 Despite an increase in expression of both NPY and Y2R in GH adenomas and a positive correlation between the two, it is still unclear why and when the level of NPY in the serum decreases and the GH level increases.
This study also showed no statistically significant differences in the levels of NPY expression between invasive and noninvasive pituitary adenomas, as indicated by their biological characteristics. This showed that NPY might not participate in the regulation of invasiveness of pituitary adenomas. The underlying mechanism deserves further study.
Conclusion
NPY plays important roles in the pathogenesis and pathophysiology of pituitary adenomas, as shown in this clinical study. The expression of NPY and its receptors, Y1R and Y2R, in human pituitary adenomas and the levels of expression were found to differ across different subcategories. Differences in expression of Y2R in human pituitary adenomas were found to be statistically significant. However, it remains unclear what exact roles NPY plays in the development and growth of pituitary adenomas and in complex endocrine changes. Further research is warranted.
Footnotes
Disclosure Statement
No competing financial interests exist.
References
Supplementary Material
Please find the following supplemental material available below.
For Open Access articles published under a Creative Commons License, all supplemental material carries the same license as the article it is associated with.
For non-Open Access articles published, all supplemental material carries a non-exclusive license, and permission requests for re-use of supplemental material or any part of supplemental material shall be sent directly to the copyright owner as specified in the copyright notice associated with the article.