
Abstract
Spindle and kinetochore-associated protein 1 (SKA1), a component of microtubule-binding complex of kinetochore, is essential for proper chromosome segregation. Recently, SKA1 has been shown to be involved in malignant progression of several human cancers. However, its role in bladder cancer is still unknown. To evaluate the function of SKA1 in bladder cancer cells, the authors employed an RNA interference lentivirus system to deplete its expression in both BT5637 and T-24 bladder cancer cells. The cell proliferation was significantly decreased in both cell lines after SKA1 knockdown. Moreover, the colony formation capacity was impaired by SKA1 silencing. Flow cytometry analysis showed that depletion of SKA1 led to cell cycle arrest at S phase. Furthermore, knockdown of SKA1 in T-24 cells obviously downregulated the expressions of CDK4 and Cyclin D1, and alleviated the activations of ERK2 and AKT, conducive to cell growth inhibition. These findings suggested that knockdown of SKA1 could potently suppress bladder cancer cell proliferation in vitro and lentivirus-mediated silencing of SKA1 might serve as a novel strategy for gene therapy of bladder cancer.
Introduction
Bladder cancer, one of the most common types of cancer in the world, is the second most common malignancy in the genitourinary tract 1 with 72,570 new cases and 15,210 deaths predicted to occur in 2013 in the United States. 2 About 70%–80% of patients with bladder cancer are diagnosed with nonmuscle-invasive bladder cancer. 3 After transurethral resection, recurrence of the disease occurs in 30%–60% of patients and ∼10%–15% develop progression to muscle-invasive bladder cancer in the 5 years after diagnosis. 4 Due to the high incidence and recurrence rates of bladder cancer, alternative therapies are desired to prevent progression to highly lethal carcinoma. 5,6 Scientists are still in urgent need to investigate new molecular markers that will serve as potential targets for therapeutic strategies.
Spindle and kinetochore-associated protein 1 (SKA1), a component of microtubule-binding complex of kinetochore, is essential for proper chromosome segregation. 7 –9 SKA1 was initially discovered through proteomic analysis of human mitotic spindle apparatus in 2006. 8 SKA1, along with its coworkers SKA2 and SKA3, constitutes the SKA complex, which is required for kinetochore–microtubule structure stability and plays a critical role in the maintenance of metaphase plate during mitosis. 9 –12 All the three proteins are localized along spindle microtubules and on the outer kinetochore. 13
Disruption of SKA1 and SKA2 in human cells caused prolonged mitotic delay with minor defects in chromosome congression. 8 Depletion of all the three SKAs in HeLa cells through RNAi led to unstable kinetochore–microtubule structure formation and severe chromosome alignment defects. 12 Recently, Li et al. demonstrated that SKA1 overexpression led to centrosome amplification in human prostate epithelial cells through the induction of centriole overduplication, which contributed to prostate tumorigenesis. 14 It has been shown that SKA1 is aberrantly expressed in several human cancers and modulates cell proliferation, including oral adenosquamous carcinoma, 15 hepatocellular carcinoma, 16 and gastric cancer. 17 Much attention has been focused on determining the biological role of SKA1 in cancer cells; however, its function in bladder cancer formation is poorly understood.
In this study, to elucidate the effect of SKA1 in bladder cancer, the authors knocked down the expression of SKA1 using an RNA interference lentivirus system in two human bladder cancer cell lines BT5637 and T-24. Functional analyses were further conducted to examine the effects of SKA1 on cell growth and cell cycle progression, as well as the underlying mechanisms.
Materials and Methods
Cell culture
Human bladder cancer cell lines BT5637 and T-24 and human embryonic kidney cell line 293T were purchased from the Cell Bank of Chinese Academy of Sciences (Shanghai, China). BT5637 cells were incubated in RPMI-1640 (Hyclone) supplemented with 10% fetal bovine serum (FBS), 1% NEAA, 2 g/L glucose, and 1 mM sodium pyruvate. T-24 cells were incubated in the MCCOY’5A medium (Sigma-Aldrich) with 10% FBS. 293T cells were incubated in Dulbecco's modified Eagle's medium (Hyclone) with 10% FBS. These cell lines were maintained at 37°C in a 5% CO2 humidified atmosphere.
Construction of recombinant lentivirus and gene silencing
The cDNA sequence of SKA1 was obtained from NCBI (NM_001039535). The shRNA target sequence (5′-CCGGCCTGACACAAAGCTCCTAAATCTCGAGATTTAGGAGCTTTGTGTCAGGTTTTTG-3′) for SKA1 was designed and cloned into the pFH-L vector (Shanghai Hollybio), which contains the green fluorescent protein (GFP) gene as a reporter. Nonsilencing shRNA sequence (5′-GCGGAGGGTTTGAAAGAATATCTCGAGATATTCTTTCAAACCCTCCGCTTTTTT-3′) was used as control. Lentiviruses were generated by triple transfection of 80% confluent 293T cells with modified pFH-L plasmid and pVSVG-I and pCMVΔR8.92 helper plasmids (Shanghai Hollybio) using Lipofectamine 2000 (Invitrogen) according to a previous report. 18 For cell infection, BT5637 cells were seeded in six-well plates at a density of 50,000 cells per well and transduced with lentivirus-mediated SKA1 shRNA (Lv-shSKA1) or control shRNA (Lv-shCon) at a multiplicity of infection (MOI) of 25, while T-24 cells (25,000 cells/well) were transduced with Lv-shSKA1 or Lv-shCon at an MOI of 10. As the lentivirus carries a GFP reporter driven by the cytomegalovirus (CMV) promoter, the infection rate was determined by counting GFP-positive cells using fluorescence microscopy (Olympus) 4 days after infection.
Quantitative real-time PCR
Total RNA was extracted from cells using the Trizol reagent (Invitrogen) and synthesized into cDNA by M-MLV reverse transcriptase (Promega) according to the manufacturer's instructions. Quantitative real-time PCR (qRT-PCR) were performed on the BioRad Connect Real-Time PCR platform using the following system: 10 μL 2×SYBR premix ex taq, 0.8 μL primers (2.5 μM), 5 μL cDNA, and 4.2 μL ddH2O. The procedure was a two-step PCR: predenaturation at 95°C for 1 minute, and 40 cycles of denaturation at 95°C for 5 seconds followed by elongation at 60°C for 20 seconds. Absorbance values were obtained at the end of every elongation step. The relative expression level of SKA1 was normalized to that of the internal control gene, ACTB (Beta-actin). The data were analyzed with the comparative threshold cycle (2−ΔΔCt) method as described previously. 18 The primers used were as follows: SKA1-forward, 5′-TGATGTGCCAGGAAGGTGAC-3′; SKA1-reverse, 5′-CAAAGGATACAGATGAACAACAGC-3′; ACTB-forward, 5′-GTGGACATCCGCAAAGAC-3′; ACTB-reverse, 5′-AAAGGGTGTAACGCAACTA-3′. Experiments were performed in triplicate.
Western blotting
Cells were collected 4 days after lentivirus infection and lysed in 2×sodium dodecyl sulfate (SDS) sample buffer (100 mM Tris-HCl pH 6.8, 10 mM EDTA, 4% SDS, 10% glycine). Proteins were separated using SDS-polyacrylamide gel electrophoresis (SDS-PAGE) and transferred to polyvinylidene fluoride (PVDF) membranes. The membranes were then incubated with primary antibodies: rabbit anti-SKA1 (1:1000, #SBA3500101; Sigma-Aldrich), mouse anti-GAPDH (1:3000, #sc-32233; Santa Cruz Biotechnology), rabbit anti-Phospho-ERK (Tyr204) (1:2000, #11246; Signalway), rabbit anti-ERK2 (1:2000, #sc-154; Santa Cruz Biotechnology), rabbit anti-Phospho-Akt (Ser473) (1:1000, #4060; Cell Signaling Technology), mouse anti-Akt (1:1000, #2966; Cell Signaling Technology), mouse anti-CDK4 (1:500, #2906; Cell Signaling Technology), and rabbit anti-Cyclin D1 (1:1000, #2922; Cell Signaling Technology), followed by horseradish peroxidase-conjugated goat anti-rabbit IgG (1:5000, #sc-2004; Santa Cruz Technology) and goat anti-mouse IgG (1:5000, #sc-2005; Santa Cruz Technology) secondary antibodies. Then, the bands were exposed to films using the ECL method, as described previously. 17
MTT assay
Lentivirus-transduced BT5637 cells or T-24 cells were seeded in a six-well plate at a density of 2000 or 2500 cells per well. After 1, 2, 3, 4, and 5 days of incubation, viable cells were analyzed using MTT plus acidic isopropanol (10% SDS, 5% isopropanol, and 0.01 M HCl), as described in a previous report. 19 The absorbance of each well was recorded at the wavelength of 595 nm using a microplate reader. Experiments were performed in triplicate.
Colony formation assay
After lentivirus infection for 4 days, BT5637 cells or T-24 cells were cultured in the six-well plate at a density of 300 or 400 cells per well. Cell culture was maintained in a complete medium for 12 days (T-24) or 10 days (BT5637) until most single clones had more than 50 cells. The medium was changed at 3-day intervals. The cells were washed twice with phosphate-buffered saline (PBS), fixed with 4% paraformaldehyde, and then stained with crystal violet for 10 minutes. The total number of colonies was counted under a microscope.
Flow cytometry assay
Cell cycle was analyzed by propidium iodide (PI) staining using a flow cytometer as described. 20 In brief, lentivirus-transduced cells were seeded at a density of 200,000 cells per well. Upon reaching 80% confluence, cells were released by digestion with trypsin and harvested. After centrifugation, the cell pellet was washed twice with PBS and fixed with precooled 70% ethanol. Then, cells were stained with PI (C1052; Beyotime) following the manufacturer's instructions and analyzed by Cell Lab Quanta Beckman Coulter.
Statistical analysis
All data are presented as mean±standard deviation from three independent experiments. Student's t-test was performed to analyze the difference between Lv-shCon and Lv-shSKA1 groups. A p-value <0.05 was considered to be statistically significant.
Results
Expression of SKA1 was downregulated by infection with Lv-shSKA1 in bladder cancer cells
To evaluate the role of SKA1 in bladder cancer, the authors began by analyzing the expression of SKA1 in two human bladder cancer cell lines BT5637 and T-24. As shown in Figure 1A, SKA1 was expressed in both cell lines. To examine the function of SKA1 in bladder cancer cells, they used lentivirus-mediated RNAi to suppress SKA1 expression in BT5637 and T-24 cells. Four days after lentivirus infection, more than 80% cells were GFP positive in both Lv-shCon and Lv-shSKA1 groups as shown by fluorescence microscopy, representing a satisfying infection efficiency of recombinant lentivirus in BT5637 and T-24 cells (Fig. 1B, C). qRT-PCR analysis showed that the expression of SKA1 was markedly reduced in Lv-shSKA1 groups, by 78.6% in BT5637 cells (Fig. 1D) and 66.9% in T-24 cells (Fig. 1F), compared to Lv-shCon groups. Furthermore, western blotting analysis confirmed that SKA1 protein expression was obviously downregulated in bladder cancer cells in the Lv-shSKA1 group (Fig. 1E, G). Collectively, the recombined lentivirus containing shRNA directed against SKA1 could successfully and efficiently knock down endogenous SKA1 expression in bladder cancer cells.

Knockdown of spindle and kinetochore-associated protein 1 (SKA1) in bladder cancer cells by lentivirus-mediated RNAi silencing.
Knockdown of SKA1 repressed the proliferation of bladder cancer cells
The authors next evaluated cancer cell proliferation in BT5637 and T-24 cells treated with Lv-shSKA1, respectively. MTT assay showed that the growth curves of Lv-shSKA1 groups were much lower than those of Con and Lv-shCon groups in both BT5637 (p<0.001, Fig. 2A) and T-24 cells (p<0.001, Fig. 2B). The results suggested that knockdown of SKA1 could remarkably inhibit bladder cancer cell proliferation.
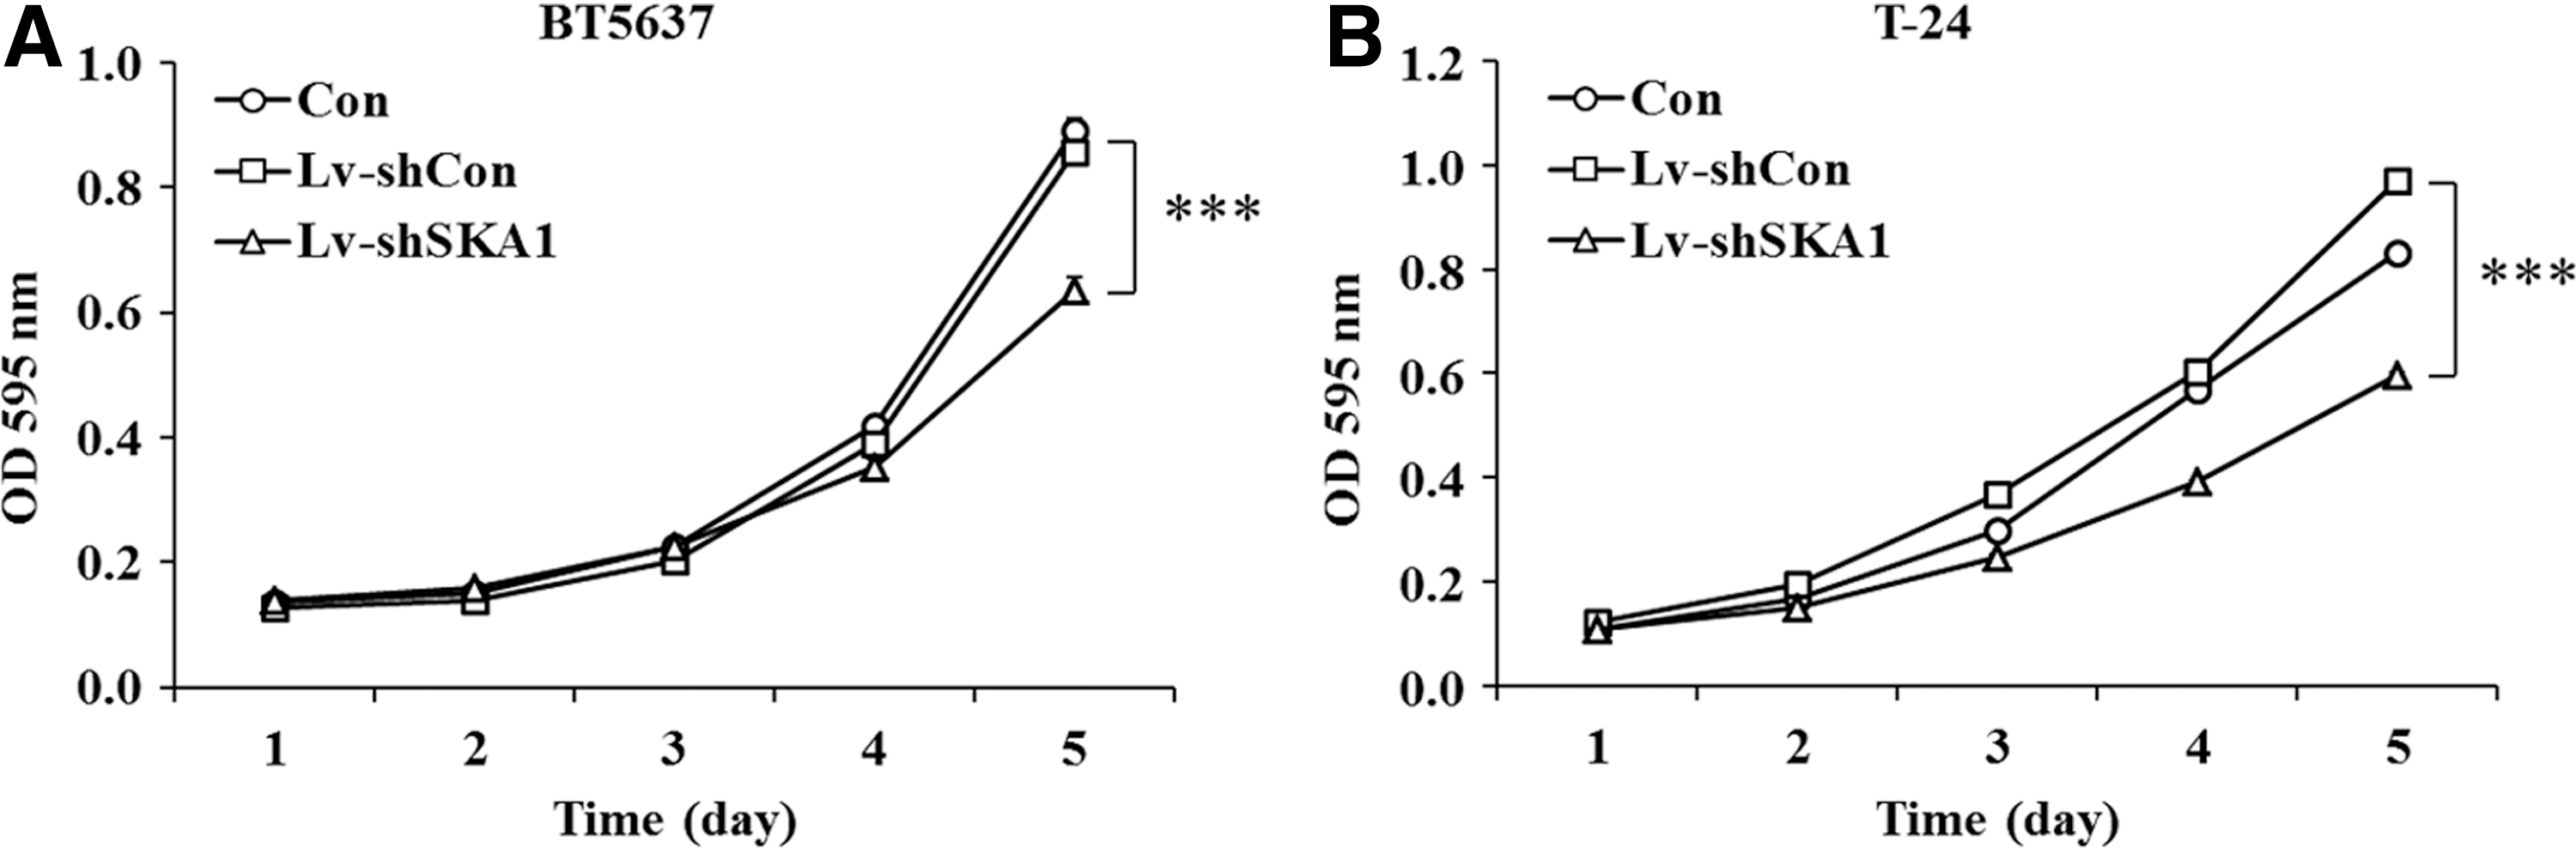
Knockdown of SKA1 suppresses the proliferation of BT5637
Knockdown of SKA1 impaired colony formation of bladder cancer cells
Colony formation assay was simultaneously conducted to investigate the effect of SKA1 knockdown on in vitro tumor formation. In consistent with MTT assay results, compared with Lv-shCon groups, colony numbers in Lv-shSKA1 groups were significantly decreased by 50% and 20% in BT5637 (Fig. 3A) and T-24 cells (Fig. 3C), respectively, indicating that the colony formation capacity was seriously impaired in bladder cancer cells after SKA1 silencing. Representative images of single colony with crystal violet staining indicated that the colony formed in BT5637 or T-24 cells was much smaller in Lv-shSKA1 groups than in Lv-shCon groups (Fig. 3B, D). Taken together, knockdown of SKA1 could suppress proliferation of bladder cancer cells.
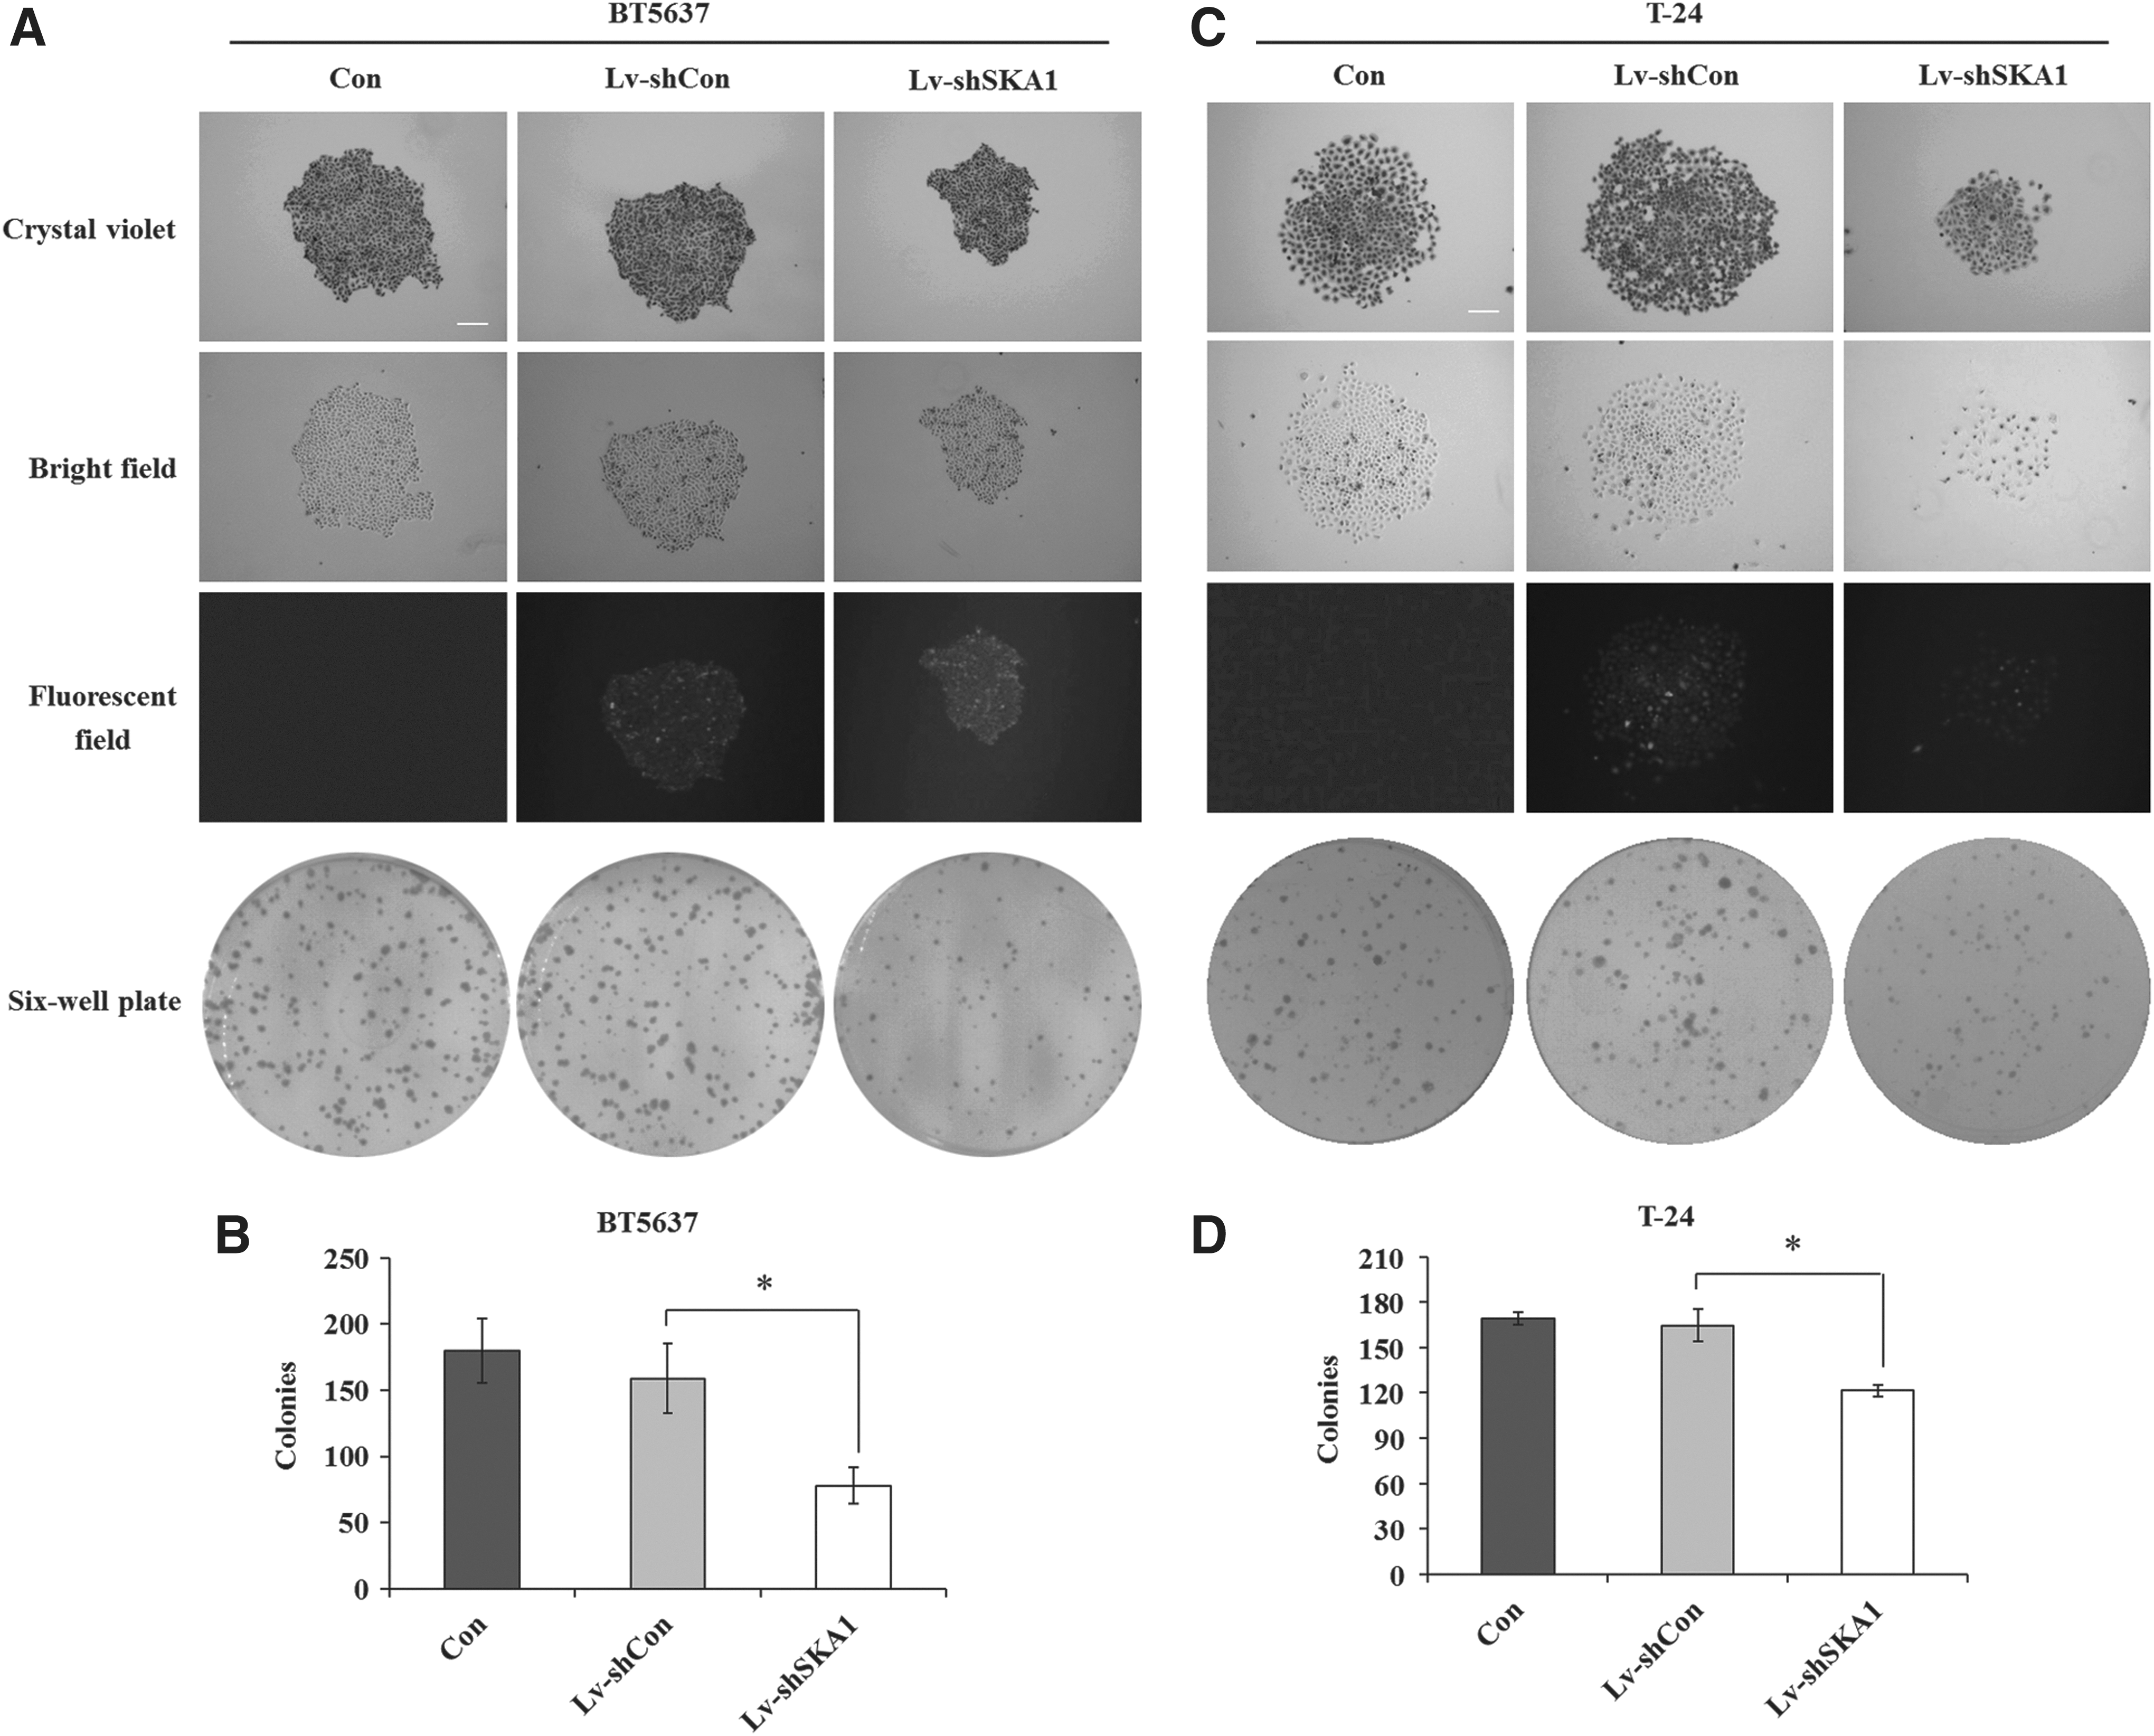
Knockdown of SKA1 inhibits the colony-forming ability. Statistical analysis of the number of colonies with crystal violet staining in BT5637
Knockdown of SKA1 blocked cell cycle progression of bladder cancer cells
To elucidate the underlying mechanism of cell growth inhibition, cell cycle progression was analyzed by flow cytometry (Fig. 4A, C). As shown in Figure 4B, the percentage of BT5637 cells in the S phase increased from 30.78% to 39.13% after Lv-shSKA1 infection (p<0.001) and decreased from 61.49% to 54.65% in the G0/G1 phase (p<0.001). As shown in Figure 4D, the proportion of T-24 cells in the S phase also increased from 18.1% to 30.1% after Lv-shSKA1 infection (p<0.001) and decreased from 75.35% to 63.08% in the G0/G1 phase (p<0.001). These results suggested that knockdown of SKA1 inhibited bladder cancer cell growth probably through the induction of S phase cell cycle arrest.

Knockdown of SKA1 induces cell cycle arrest at S phase. Representative flow cytometry graphs of BT5637
Knockdown of SKA1 suppressed CDK4, Cyclin D1 expression and ERK2, AKT activation
To gain insight into how SKA1 altered the phenotype of human bladder cancer cells, the authors detected the expressions of CDK4, Cyclin D1 and the activations of ERK2, AKT by western blotting. As shown in Figure 5, depletion of SKA1 significantly decreased the expression levels of CDK4 and Cyclin D1 in T-24 cells, but had little inhibitory effect on Cyclin B1, p15, and p27 expression (data not shown). In addition, the gray level of phosphorylated ERK2 (p-ERK2) to total ERK2 protein was visibly decreased in the Lv-shSKA1 group, as well as the level of phosphorylated AKT (p-AKT) to total AKT protein. These results indicated that knockdown of SKA1 in bladder cancer cells blocked cell cycle progression probably through suppression of CDK4 and Cyclin D1, leading to cell growth inhibition by blockade of ERK2 and AKT cascades.

Knockdown of SKA1 suppresses cell cycle-related proteins. Whole cell lysis was prepared after 4 days of infection and used for western blotting analysis of CDK4, Cyclin D1, ERK2, p-ERK2, AKT, and p-AKT. GAPDH was used as control.
Discussion
Recently, RNA interference has been extensively used to target genes implicated with proliferation, apoptosis, cell cycle regulation, invasion, and metastasis in bladder cancer, 21 –27 which provides promising therapeutic strategies for the treatment of bladder cancer. In the present study, the authors employed lentivirus-mediated RNAi to suppress SKA1 expression in BT5637 and T-24 bladder cancer cell lines. Depletion of SKA1 in bladder cancer cells resulted in decreased cell proliferation and impaired colony formation ability. Previous studies investigated the shRNA-mediated knockdown of SKA1 in various cancer cell lines and found similar results on cell proliferation, 15 –17 which enhanced the reliability of the results.
Uncontrolled cell growth and disrupted cell cycle check point are hallmarks of cancer cells. 28,29 Sun et al. showed that depletion of SKA1 in MGC80-3 gastric cancer cells caused a strong delay of S phase progression. 17 In line with the previous report, this study also indicated that downregulation of SKA1 induced cell cycle arrest at S phase in both BT5637 and T-24 cells, which contributed to the inhibition of cell growth.
To date, the molecular mechanisms of SKA1 knockdown restricting cancer cell proliferation and cell cycle progression have not yet been determined. Thus, the authors further evaluated the changes in growth and cell cycle-associated proteins after SKA1 silencing. It is known that Cyclins and CDKs are two kinds of crucial regulatory molecules determining cell cycle progression. 30 As a positive regulator of CDK4, Cyclin D1 has been implicated in controlling the G1 phase of the cell cycle. 31 These data demonstrated that knockdown of SKA1 downregulated the expression levels of CDK4 and Cyclin D1 in T-24 cells. Moreover, they found that both ERK2 and AKT phosphorylation were obviously inhibited after SKA1 silencing. As known, ERK and AKT are both important components of cell signaling pathways, which play important roles in cell growth. 32 Therefore, it is reasonable to speculate that the mechanisms of SKA1 knockdown alleviating cell growth may be partly through downregulation of the expression of CDK4 and Cyclin D1, and blockage of the ERK2 and AKT activations. The alterations of molecules within pathways controlling cell cycle regulation have been reported to significantly affect the outcome of patients with bladder cancer. 33 Furthermore, to provide abundant evidences that SKA1 may be a potential target for cancer therapy, the clinical significance of SKA1 gene in bladder cancer tissues should be investigated in the future.
In conclusion, these findings suggested that SKA1 could play an important role in bladder cancer cell growth through regulating growth and cell cycle-associated proteins, and lentivirus-mediated shRNA against SKA1 would be a new strategy to cure bladder cancer combined with other reported markers.
Footnotes
Acknowledgment
This study was supported by grants from the National Natural Science Foundation of China (81172576, 81472392).
Disclosure Statement
The authors declare no conflicts of interest.