
Abstract
Objective:
To investigate the biodistribution and single-photon emission computed tomography (SPECT) imaging of 99mTc-labeled arginine-glutamic acid-threonine (RET) and arginine-glutamic acid-glycine (REG) in nude mice bearing human lung cancer xenografts.
Materials and Methods:
RET and REG were labeled directly with 99mTc and their binding efficiency to tumor cells was measured in human nonsmall cell lung cancer H1299 cells. After intravenously injecting 99mTc-RET and 99mTc-REG into normal mice and nude mice bearing human lung cancer xenografts, their biodistribution was measured at different postinjection times, and percentages of injected dose per gram tissue (% ID/g) of organs of interest were calculated. The mice bearing H1299 lung cancer xenografts were scanned by SPECT at different times following the 99mTc-RET or 99mTc-REG injection.
Results:
The radiochemical purity of 99mTc-RET and 99mTc-REG was 93.15%±2.02% and 92.90%±2.86%, respectively. The binding rate of 99mTc-RET and 99mTc-REG to H1299 cells was 3.56%±0.37% and 2.32%±0.31%, respectively. The uptake of 99mTc-RET and 99mTc-REG in tumor was 4.96±1.05% ID/g at 4 hours postinjection and 1.95±0.73% ID/g at 2 hours postinjection, respectively. Tumors in nude mice could be best imaged at 4.5–6 hours postinjection of 99mTc-RET.
Conclusion:
99mTc-RET has a higher binding rate to H1299 cells than 99mTc-REG and might be used as a potential lung cancer imaging agent.
Introduction
Lung cancer is one of the most common malignant cancers. Its incidence and mortality rank the top three among malignant cancers in the world. 1 Early diagnosis and early treatment are the principles of lung cancer treatment. Nuclear medicine has unique advantages in the targeted diagnosis and treatment of lung cancer. Investigation of radiation-targeted polypeptide compounds is an important content in radiopharmaceutical medicine research and development.
Although 18F-fluorodeoxyglucose positron emission tomography (FDG PET) imaging is a powerful tool in diagnosing and staging lung cancer, its penetration rate is much lower compared with single-photon emission computed tomography (SPECT) in China. Besides, the imaging cost of SPECT is much lower compared with FDG PET imaging, and now, the imaging cost of FDG PET imaging could not even be covered by medical insurance in China. So, the SPECT lung cancer imaging agents, such as peptides labeled with technetium-99m, have great value and clinical transformation possible in China. The establishment of technetium coupling tripeptide combinational library (TCTPCL) and in vivo implementation of high-throughput screening in nude mice could avoid the disadvantages of traditionally targeted radiopharmaceutical development models.
2,3
This method utilizes 20 kinds of
In the previous research, the SPECT image screening of nude mice bearing the human lung cancer cell H460 xenograft was implemented to screen the TCTPCL. For screening of the first amino acid residue, the authors first synthesized 20 kinds of MBHA-O-XX at Rink Amide-MBHA resin, where O is the 20 kinds of known
This study focuses on the uptake of 99mTc-RET and 99mTc-REG in human nonsmall cell lung cancer cells H1299, their pharmacokinetics in normal mice, and their in vivo biodistributions in nude mice bearing human lung cancer cell H460 xenografts.
Materials and Methods
The CO2 incubator was from Thermo Epectron Corporation. The XDS-1A inverted microscope was from Shanghai Precision Instrument Co., Ltd. The molybdenum/technetium generator was from the 401 Institute of Atomic Energy of China. The Wizard γ-counter was from Perkins Elmer Instrument Co., Ltd. The BS224S electronic balance was from Sartorius instrument Co., Ltd. Clean-level Kunming mice and BALB/C nude mice were purchased from Shanghai Slac Experimental Animal Co. Ltd. H460 and H1299 cell lines were introduced from the American Type Culture Collection (ATCC). Arg-Glu-Thr (RET) and Arg-Glu-Gly (REG) were synthesized by Shanghai Biotech Bioscience and Technology Co. Ltd.
RET and REG labeling with 99mTc
Twenty micrograms of stannous chloride was dissolved in 0.1 mL of hydrochloric acid and diluted with distilled water to 2.0 mL. The solution was simultaneously filled with nitrogen gas to completely remove oxygen and stored in a sealed container. Three hundred milligrams of tricine was dissolved in 5 mL of sodium hydroxide (0.1 M) as a reaction buffer. Fifty micrograms of RET or REG (Fig. 1 shows their structure formula) was dissolved in 0.5 mL of tricine buffer and mixed thoroughly with 15 μL of stannous solution followed instantly with 100 μL of fresh 99mTcO4 − eluant with specific activity of 1.85 GBq/mL. The mixture was incubated for 1 hour at room temperature to complete the reaction and sterilized by passing through a 0.22-μm membrane.

Molecular structures of RET (Arg-Glu-Thr-NH2) and REG (Arg-Glu-Gly-NH2).
Measurement of labeling rate, radiochemical purity, and stability of 99mTc-RET and 99mTc-REG
The labeling rate and radiochemical purity of 99mTc-RET and 99mTc-REG were measured using the paper chromatography method, using Xinhua No. 1 chromatographic paper as the fixed phase and two different developing solvent systems. The first system uses normal saline as the developing agent, in which 99mTc-RET or99mTc-REG and colloidal had retention value (Rf) of 0, and 99mTcO4− had Rf of 0.7–0.9. The second system uses 1.5:1:1 (v/v/v) of acetonitrile/acetone/water as the developing agent, and the labeled samples were inoculated on Xinhua No. 1 chromatographic paper, presoaked with bovine serum albumin with 2.5% mass fraction, in which 99mTc and colloid had Rf of 0, while 99mTc-REG and 99mTcO4− had Rf of 0.5–0.7. After development, the radioactivity of each fraction was measured using the γ-radiation counter and used to calculate the labeling rate and radiochemical purity of various fractions. To measure radioactivity stability, 50 μL of 99mTc-RET or 99mTc-REG was mixed with 950 μL of fresh human serum and its radioactivity was measured after being incubated at room temperature for 1, 2, 4, 6, and 24 hours, respectively. The labeling rate was calculated using the following formula:
Labeling rate=[99mTc-REG or 99mTc-RET and colloidal radioactive counts/(99mTc-REG or 99mTc-REG and colloidal radioactive counts+99mTcO4 − radioactive counts)−99mTc labeled colloid radioactive counts/(99mTc labeled colloid radioactive counts+99mTc-REG or 99mTc-RET+99mTcO4 − radioactive counts)]×100%.
Measurement of in vitro 99mTc-RET and 99mTc-REG uptake in lung cancer cells H1299
Effects of different cell densities on H1299 cells binding with 99mTc-RET and 99mTc-REG
Human nonsmall cell lung cancer cells H1299 were cultured in Dulbecco's modified Eagle's medium supplemented with 10% newborn calf serum at 37°C in an incubator supplemented with 5% CO2 and routinely passaged. H1299 cells were prepared as 2.0×10⁴, 4.0×10⁴, and 6.0×10⁴/mL cell suspensions and inoculated into each well of a 96-well plate with 4000, 8000, and 12,000 cells per well in each group with six replicates. In addition, another six wells were used as control for the 99mTcO4
− eluant. The plate was incubated in the incubator with 5% CO2 at 37°C. After 24 hours of incubation, 10 μL of 99mTc-RET or 99mTc-REG (10 μCi/mL) was added into each well except those used as 99mTcO4
− eluant control, in which 99mTcO4
− eluant of same volume and radioactivity was added. The plate was further incubated for 60 minutes. The supernatant of each well was stored in a RIA tube and marked as F, and after cells of each well were washed twice with 200 μL normal saline, these saline also were added into the F tube. Then, cells were digested with trypsin and transferred into RIA tubes, which were labeled as B. The radioactivity of each tube was measured using the γ-counter as counts per minute. The cell-binding rate of each sample was calculated as the following:
Then, the cell-binding rate of 99mTc-RET and 99mTc-REG is considered as the cell binding rate of each sample after deducting that of 99mTcO4 − eluant control. The optimal cell density was determined based on the optimal binding rate.
Effects of different incubation times on binding of H1299 cells with 99mTc-RET and 99mTc-REG
H1299 cells were prepared as 4.0×10⁴ cells/mL suspension and inoculated into 96-well plates with 200 μL per well with six replications. In each time point, another six wells were used as control for 99mTcO4 − eluant. After incubation in an incubator with 5% CO2 for 24 hours, 10 μL of 99mTc-RET or 99mTc-REG (10 μCi/mL) was added into each well except those used as 99mTcO4 − eluant control, in which 99mTcO4 − eluant of the same volume and radioactivity was added and incubated for 60, 120, and 180 minutes, respectively. The binding rate of each sample was then measured and calculated as described in the Effects of Different Cell Densities on H1299 Cells Binding with 99mTc-RET and 99mTc-REG section. The best incubation time was selected based on the optimal binding rate.
Effects of different 99mTc-RET and 99mTc-REG doses on its binding to H1299 cells
H1299 cells were prepared as 4.0×10⁴ cells/mL suspension and inoculated into 96-well plates with 200 μL per well with six replications. In each time point, another six wells were used as control for 99mTcO4 − eluant. After incubation in an incubator with 5% CO2 for 24 hours, 10 μL of 99mTc-RET or 99mTc-REG of 10, 20, and 40 μCi/mL, respectively, was added into each well except those used as 99mTcO4 − eluant control, in which 99mTcO4 − eluant of the same volume and radioactivity was added. Cells mixed with 99mTc-RET and 99mTc-REG were incubated for 120 and 180 minutes, respectively, and the binding rate of each sample was then measured and calculated as described in the Effects of Different Cell Densities on H1299 Cells Binding with 99mTc-RET and 99mTc-REG section. The best dosage was selected based on the optimal binding rate.
Biodistribution and pharmacokinetic parameters of 99mTc-RET or 99mTc-REG in normal mice
The study was approved by the institutional review board/local ethics committee, and the experiments followed the guidelines on experiments with animals. One hundred eight normal Institute of Cancer Research (ICR) mice were assigned into 99mTc-RET or 99mTc-REG groups with 54 mice in each group and then further randomly divided into 9 subgroups per group with 6 mice per subgroup. After intravenous injection through the tail with 0.1 mL of freshly prepared 99mTc-RET or 99mTc-REG (8.51 MBq, i.e., 230 μCi), mice of each subgroup were sacrificed at 5, 15, and 30 minutes as well as at 1, 2, 4, 8, and 24 hours postinjection. Their brain, heart, liver, spleen, lung, kidney, stomach, intestine, pancreas, muscle, fat, gonads, thyroid, bone, and tumor, as well as 100 μL of carotid blood, were collected, weighted, and measured for radioactivity using the γ-counter. The distribution of radioactivity was calculated as the percentages of the radioactivity counts per gram of organs or tissues over the total injected dose (% ID/g).
In addition, another six normal ICR mice were assigned into two groups with three mice per group. Mice in each group were intravenously injected 0.1 mL of freshly labeled 99mTc-RET or 99mTc-REG (9.25 MBq, i.e., 250 μCi), respectively. Their tail vein blood was collected at 2, 5, 10, and 30 minutes, as well as 1, 2, 4, 8, and 24 hours postinjection, and used to measure the wet blood weight and count radioactivity using the γ-counter. The mean uptake of 99mTc-RET or 99mTc-REG in blood of ICR mice at different times was calculated according to the following formula:
Uptake of 99mTc-RET or 99mTc-RE in blood (% ID/g)=(the counts in blood/the total counts injected into the body)/the blood weight×100.
99mTc-RET or 99mTc-REG standards were prepared as the following, at the same time performing tail vein injection. A total of 0.1 mL 99mTc-RET or 99mTc-REG was diluted with injecting water to 50 mL in a volumetric flask. After being mixed thoroughly, 200 μL of solution was transferred using a pipette into an RIA tube, counted simultaneously with the samples using the γ-counter, and used as the standard to calculate the uptake of 99mTc-RET or 99mTc-REG in various organs (% ID/g). The pharmacokinetic parameters were calculated using the pharmacokinetics software DAS2.0.
In vivo biodistribution of 99mTc-RET or 99mTc-REG and SPECT imaging of nude mice with human lung cancer cell H1299 xenografts
Establishment of tumor-bearing nude mice
H1299 cells at the logarithmic growth period were collected, prepared as 5×10⁶ cells/mL suspension, and hypodermically inoculated at near the left axillary region of each nude mouse with 0.2 mL per mouse. Mice were then placed in a pathogen-free animal room till tumors reached 200 mm3 for further use.
In vivo biodistribution of 99mTc-RET or 99mTc-REG in tumor-bearing nude mice
Thirty-two tumor-bearing nude mice for each radiopharmaceutical reagent were divided randomly into 8 groups with 4 mice per group. Mice were injected 0.1 mL freshly prepared 99mTc-RET or 99mTc-REG (4.81 MBq, 130 μCi) through tail vein and sacrificed at 15 and 30 minutes, as well as 1, 2, 4, 8, and 24 hours, respectively. Their brain, heart, liver, spleen, lung, kidney, stomach, intestine, pancreas, muscle, fat, gonads, thyroid, bone, and tumor, as well as 100 μL of carotid blood, were collected and used to count radioactivity using the γ-counter and weighting. The percentage of radioactivity count per gram organ or tissue over the total injection dose (% ID/g) was calculated as described in the Biodistribution and Pharmacokinetic Parameters of 99mTc-RET or 99mTc-REG in Normal Mice section.
SPECT imaging of tumor-bearing nude mice
A total of six tumor-bearing nude mice were divided into two groups, intravenously injected with 0.1 mL of 99mTc-RET or 99mTc-REG (4.81 MBq) through the tail vein and subjected to SPECT imaging at 0.5, 1, 2, 4.5, 5, and 6 hours postinjection at conditions of low-energy high-resolution collimator of 1024×1024 acquisition matrix, 2×magnification, and 15 minutes acquisition time to observe the concentration and accumulation of the imaging agent in the tumor sites.
Statistical analysis
The acquired results were presented as
Results
Labeling rates and radiochemical purities of 99mTc-RET and 99mTc-REG at optimal conditions
The labeling rate of 99mTc-RET was 93.15%±2.02% and its radiochemical purity was 92.18%±1.51%, 92.00%±1.41%, 91.30%±1.67%, 90.78%±2.48%, and 90.65%±0.60% at 1, 2, 4, 6, and 24 hours postmixing with fresh human serum, respectively. The labeling rate of 99mTc-REG was 92.90%±2.86% and its radiochemical purity was 91.43%±1.14%, 91.50%±1.28%, 91.05%±2.60%, 90.53%±3.00%, and 89.15%±1.57% at 1, 2, 4, 6, and 24 hours postmixing with fresh human serum, respectively.
Binding rates of 99mTc-RET and 99mTc-REG with different amounts of H1299 cells
The binding rate of 99mTc-RET with H1299 cells at three different densities (4000, 8000, and 12,000 cells/well) was 1.14%±0.19%, 1.99%±0.29%, and 1.83%±0.28%, respectively. Among them, the binding rate at 4000 cells per well was significantly lower than that at 8000 and 12,000 cells per well (F=24.345, p<0.01), while that at 8000 cells per well was not significantly different from that at 12,000 cells per well (F=24.345, p>0.05). By comparison, the binding rate of 99mTc-REG with H1299 cells was 0.25%±0.09%, 0.58%±0.12%, and 0.56%±0.13% at 4000, 8000, and 12,000 cells per well, respectively. Among them, the binding rate at 4000 cells per well was significantly lower than that at 8000 and 12,000 cells per well (F=22.775, p<0.01), while that at 8000 cells per well was not significantly different from that at 12,000 cells per well (p>0.05).
Binding rate of 99mTc-RET and 99mTc-REG with H1299 cells at different incubation times
The binding rate of 99mTc-RET with H1299 cells at 8000 cells per well was 2.03%±0.27%, 3.03%±0.56%, and 3.54%±0.62% at incubation for 1, 2, and 3 hours, respectively, indicating that the binding rate of 99mTc-RET with H1299 cells increased with time. In addition, there was a statistically significant difference in the binding rate between 1 and 2 hours, as well as 3 hours of incubation (F=19.656 and 18.482, respectively, both p<0.01), but not between 2 and 3 hours of incubation (F=18.482, p>0.05).
The binding rate of 99mTc-REG with H1299 cells was 0.57%±0.07%, 0.87%±0.15%, and 2.06%±0.62% at incubation for 1, 2, and 3 hours, respectively, indicating that the binding rate of 99mTc-REG with H1299 cells increased with time. Moreover, there was a significant difference in the binding rate at 3 hours from that at 1 and 2 hours (F=35.934, both p<0.01).
Binding rate of 99mTc-RET and 99mTc-REG at different doses with H1299 cells
The binding rate of 99mTc-RET at 10, 20, and 40 μCi/mL doses with H1299 cells was 3.56%±0.37%, 2.32%±0.2%, and 1.13%±0.16%, respectively. The differences in the binding rate at different doses were statistically significant (F=154.782, all p<0.01).
Similarly, the binding rate of 99mTc-REG at 10, 20, and 40 μCi/mL doses with H1299 cells was 2.32%±0.31%, 1.98%±0.16%, and 0.85%±0.20%, respectively. There were significant differences in the binding rate of 99mTc-REG at different doses (F=86.879, all p<0.01), showing that the binding rates of 99mTc-RET and 99mTc-REG with H1299 cells gradually decrease with the radioactivity increasing.
In vivo distribution of 99mTc-RET and 99mTc-REG in normal ICR mice
In vivo distribution of 99mTc-RET in normal ICR mice
The uptake of 99mTc-RET in different organs of normal ICR mice (% ID/g) is shown in Table 1. It is clear from the table that 99mTc-RET was mainly uptaken by the liver, heart, and lung, as well as part of the kidney. 99mTc-RET uptake in the liver was high and gradually declined. 99mTc-RET uptake in the heart and lung also gradually decreased with time. In addition, 99mTc-RET was rapidly cleared from the blood of mice, with its radioactivity at 2 hours postinjection only accounting for about 26% of that at 5 minutes postinjection.
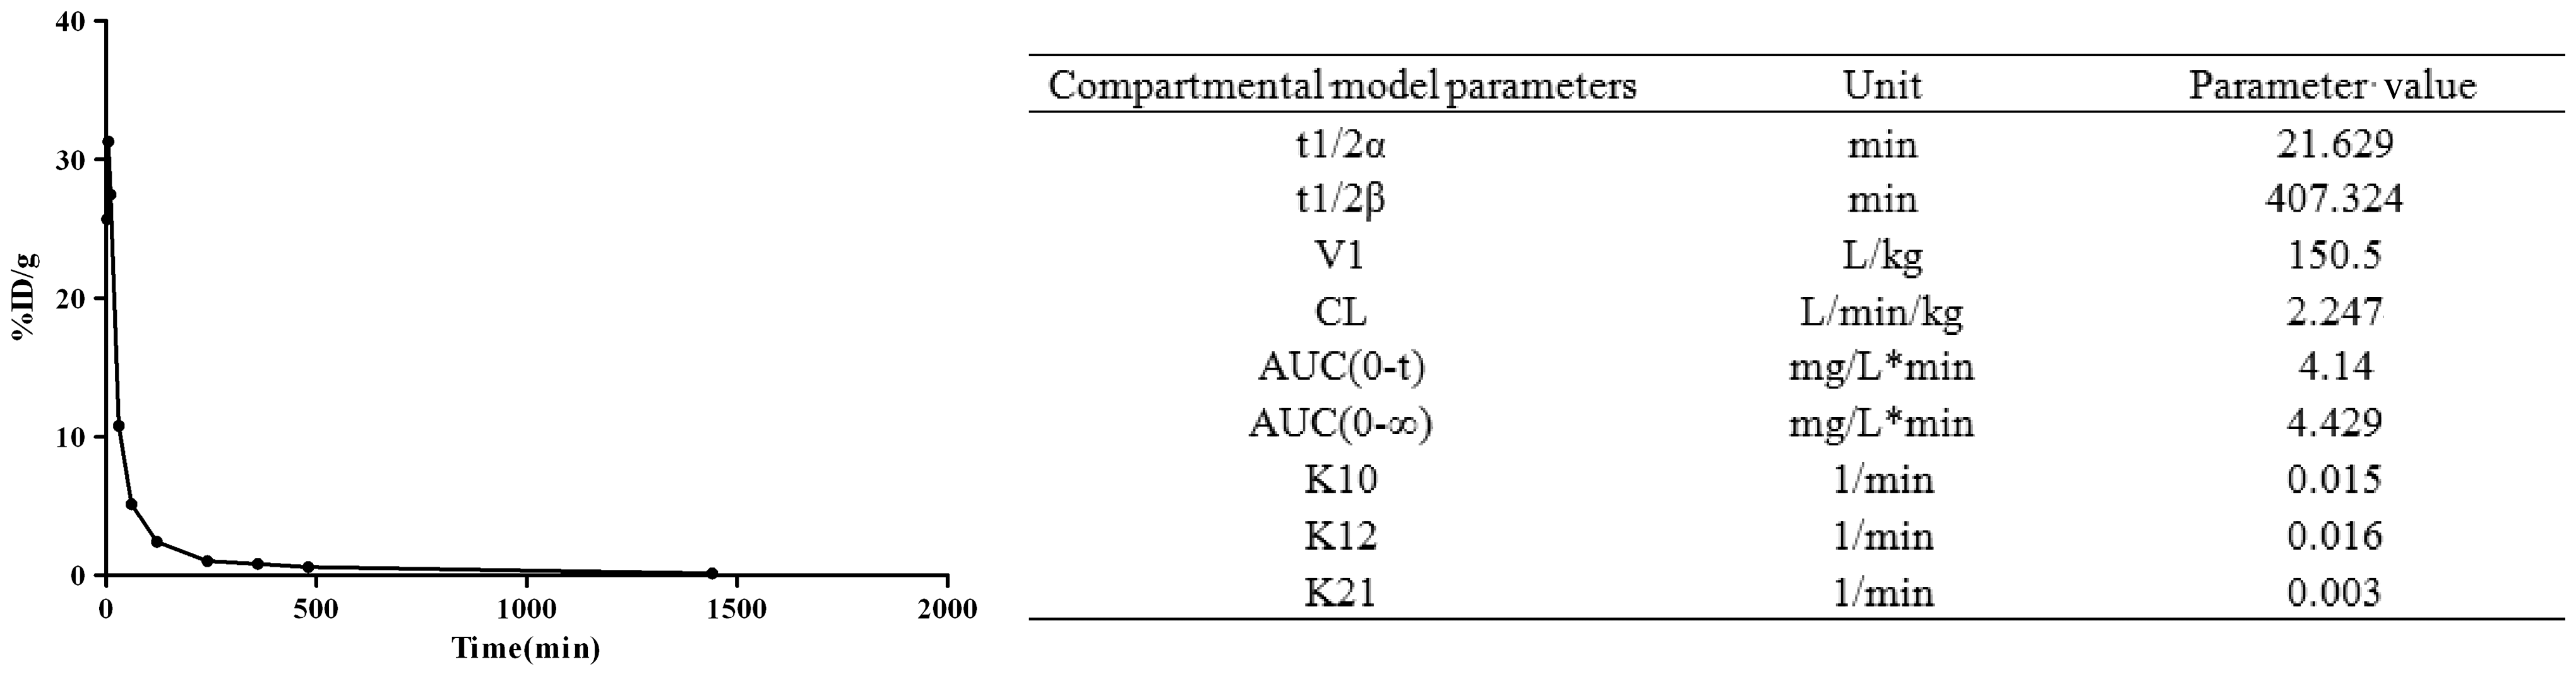
Pharmacokinetic parameters of 99mTc-RET in normal ICR mice
The average uptake of 99mTc-RET in the blood of ICR mice at different times is shown in Figure 2. It is obvious from Figure 2 that the in vivo metabolism of 99mTc-RET in ICR mice calculated using the pharmacokinetic software DAS2.0 is in agreement with the two-compartment model. The metabolic parameters are listed in Table 2.
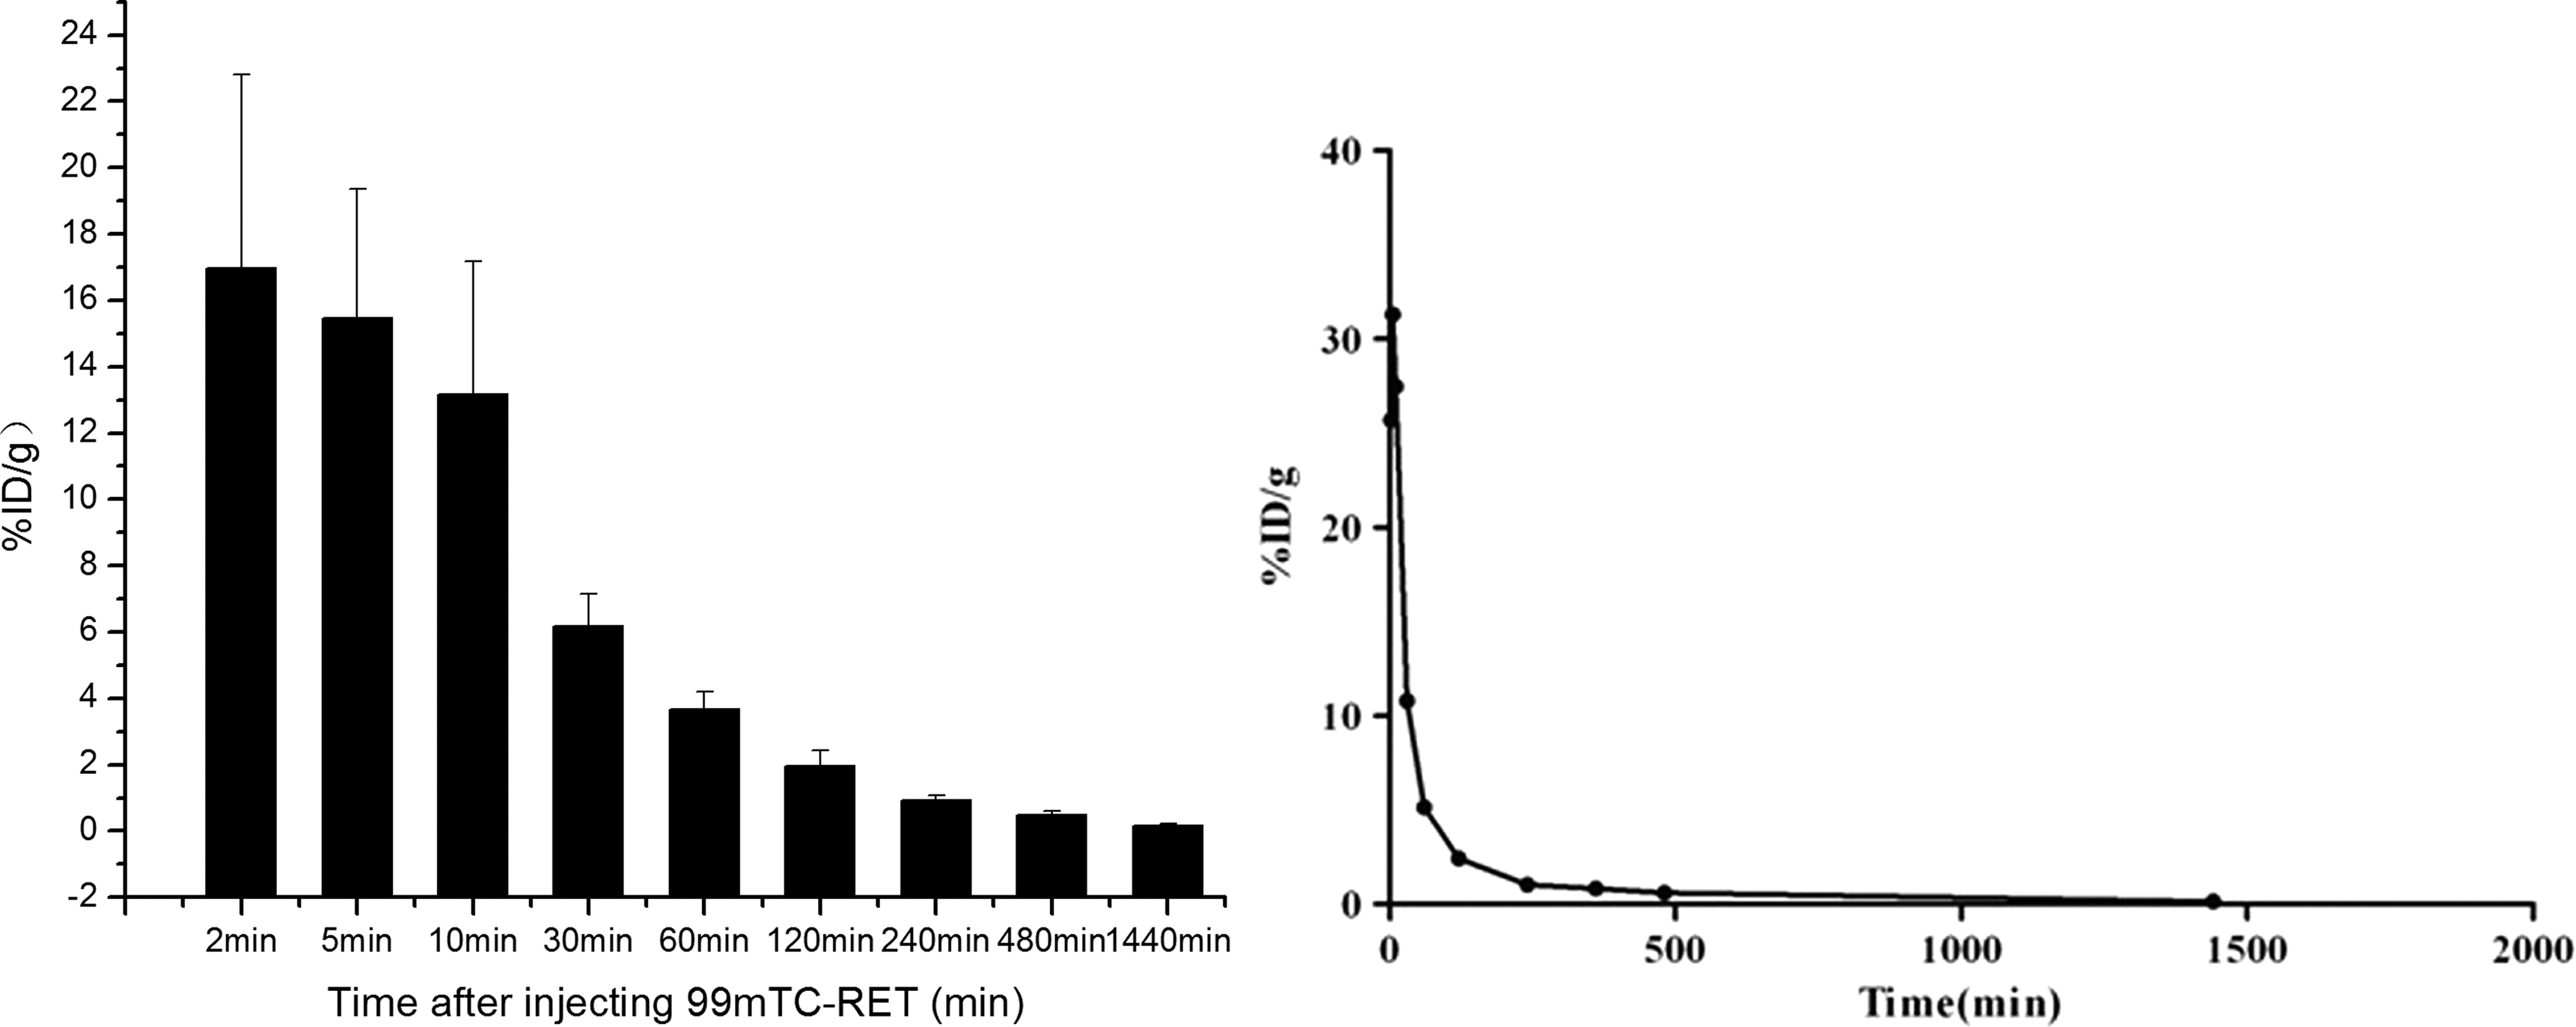
Metabolic and pharmacokinetic curves of 99mTc-RET in blood of Institute of Cancer Research (ICR) mice.
In vivo biodistribution of 99mTc-REG in normal ICR mice
The uptake of 99mTc-REG in different organs in normal ICR mice (% ID/g) is shown in Table 3. It is clear from Table 3 that 99mTc-REG in the blood of mice rapidly lowered with its radioactivity at 2 hours postinjection accounting for only about 20.26% of that at 5 minutes. 99mTc-REG uptake decreased rapidly in the heart and lung, but slowly in the liver, as shown in Figure 3.

In vivo distribution of 99mTc-REG in different mouse organs.
Pharmacokinetic parameters of 99mTc-REG in normal ICR mice
The average uptake of 99mTc-REG in the blood of ICR mice at different times is shown in Figure 4. It is obvious from Figure 4 that the in vivo metabolism of 99mTc-REG in ICR mice calculated using the pharmacokinetic software DAS2.0 is in agreement with the two-compartment model. The metabolic parameters are shown in Figure 4.
Metabolic and pharmacokinetic curves of 99mTc-REG in blood of ICR mice.
In vivo distribution of 99mTc-RET and 99mTc-REG in nude mice bearing tumor xenografts
In vivo distribution of 99mTc-RET in nude mice bearing tumor xenografts
Table 4 shows the 99mTc-RET distribution in organs or tissues of nude mice bearing tumor xenografts. 99mTc-RET uptake in tumor tissues increased gradually, reaching a peak at 4 hours postinjection, and then slowly declined. At this time, 99mTc-RET is mostly distributed in abdominal organs such as the liver and spleen and cleared rapidly in blood. At 4 hours postinjection, its distribution in the heart and blood is the least, and the ratio of radioactivity in tumor to heart and blood is up to 5.7±0.21 and 12.4±0.11, respectively.
In vivo distribution of 99mTc-REG in nude mice bearing tumor xenografts
Table 5 shows the 99mTc-REG distribution in organs or tissues of nude mice bearing tumor xenografts. 99mTc-RET uptake in tumor tissues increased gradually, reaching a peak at 4 hours postinjection, and then slowly declined. 99mTc-RET is mostly distributed in abdominal organs such as the liver and spleen and cleared rapidly in blood. The ratio of radioactivity in tumor to muscle is 3.50±1.27 at 4 hours postinjection.
SPECT imaging of nude mice bearing human lung cancer xenografts
When tumor volume in nude mice is about 200 mm3, the SPECT scan was conducted at different times of postintravenously injecting 99mTc-RET or 99mTc-REG. The results shown in Figure 5 indicated that the tumor started to uptake 99mTc-RET at 0.5 hours postinjection and became clear at 4.5–6 hours postinjection. At this time, the liver, spleen, kidney, and bladder also had a higher radioactivity distribution. Similarly, the results shown in Figure 6 indicated that the tumor started to uptake 99mTc-RET at 0.5 hours postinjection and became clear at 2 hours postinjection. However, 99mTc-REG distribution in tumor at 4–6 hours postinjection was not as good as that for 99mTc-RET.

Imaging of 99mTc-RET in tumor-bearing nude mice at different time points.

Imaging of 99mTc-REG in tumor-bearing nude mice at different time points.
Discussion
In this study, the authors used 99mTc to directly label RET and REG. At the optimal conditions, the labeled products achieved greater than 90% labeling rate and radiochemical purity and were very stable. Both RET and REG contain multiple N and NH2 groups per molecule, therefore 99mTc binds to the peptides through 4 N and NH2 groups in one or more molecules. 99mTc-RET and 99mTc-REG are selected from the “99mTc coupling tripeptide combinatorial library” because they can be enriched in human lung cancer xenografts in nude mice, as shown in images of human lung cancer cell H460 xenograft-bearing nude mice. Because the incidence of large-cell lung cancer is lower than adenocarcinoma and squamous cell carcinoma, in this study, the authors used lung cancer H1299 cell line, a nonsmall lung cancer cell line, to conduct cell-binding experiments. 6 The results showed that at the optimal conditions, that is, 8000 cells per well were incubated with 10 μCi/mL 99mTc-RET for 2 hours or 99mTc–REG for 3 hours, the maximum binding rate to H1299 cells was 3.56%±0.37% for 99mTc-RET and 2.32%±0.31% for 99mTc-REG, respectively, confirming that these two reagents have different binding abilities to H1299 cells.
Polypeptides generally refer to compounds with molecular weight less than 10 kD and containing less than 100 amino acid residues. Therefore, the labeled peptides could be rapidly decomposed and metabolized by peptidases and cleared from the blood. Hydrophilic peptides could be rapidly cleared through kidney, while lipophilic peptides are mainly cleared through the hepatobiliary pathway. Radiolabeling could enhance the lipophilicity of peptides and change their charge distribution, leading to changes of their biodistribution and kinetic behaviors. 99mTc-RET and 99mTc-REG are mainly distributed in the liver, spleen, and blood of normal mice at an early stage and then gradually decreased. With prolonged time, 99mTc-RET and 99mTc-REG were cleared quickly in blood, while slowly in the liver and spleen. At 120 minutes postinjection, 99mTc-RET and 99mTc-REG contents remained at a relatively high level in the liver and spleen rather than in other tissues. Rapid blood clearance of 99mTc-RET and 99mTc-REG helps to improve their ratio in target to nontarget tumors. The high content of 99mTc-RET and 99mTc-REG in the liver and spleen is possibly due to the impurity of 99mTc-RET and 99mTc-REG. Although their labeling rate is high, during the process, the products are not purified and contain radioactive colloid, which could be accumulated in the liver and spleen. 99mTc-RET and 99mTc-REG contents in the thyroid and stomach were always at a low level, indicating that they were relatively stable in vivo and showing no obvious de-Tc phenomenon. The experimental data indicated that 99mTc-RET is mainly excreted by the liver and, in part, through the kidney. In addition, its distribution was low in the heart, which is conducive to lung cancer imaging.
At 4 hours postinjection of 99mTc-RET through tail vein, its distribution in tumor was up to 4.96±1.05% ID/g. Meanwhile, its distribution in the liver and spleen was higher than that in blood and heart. The ratios of radioactivity count in tumor to heart and blood were as high as 5.7±0.21 and 12.4±0.11, respectively. At 2 hours postinjection of 99mTc-REG through tail vein, its distribution in tumor was up to 1.95±0.73% ID/g. Meanwhile, its distribution was higher in the liver and spleen than in blood and heart. The ratio of its radioactivity count at 4 hours postinjection in tumor to muscle was 3.50±1.27. Considering that resolution of SPECT imaging was about 1 cm, the fact that tumors in nude mice were relatively large in diameter and had central necrosis is one of the possible reasons for poor image quality.
Overall, labeling RET and REG with 99mTc is simple and easy and has a high labeling rate. 99mTc-RET and 99mTc-REG can specifically bind to lung cancer cells both in vitro and in vivo and be quickly cleared from the liver and kidney in nude mice. In addition, 99mTc-RET has a higher binding ability to H1299 cells compared with 99mTc-REG and could be a prolung tumor-imaging agent.
Footnotes
Acknowledgment
This work was supported by grants from the Foundation of Shanghai Municipal Health Bureau (2010066), National Science Foundation of Shanghai (11ZR1433700).
Disclosure Statement
No competing financial interests exist.