
Abstract
Purpose:
Dosimetric accuracy depends directly upon the accuracy of the activity measurements in tumors and organs. The authors present the methods and results of a retrospective tumor dosimetry analysis in 14 patients with a total of 28 tumors treated with high activities of 153Sm-ethylenediaminetetramethylenephosphonate (153Sm-EDTMP) for therapy of metastatic osteosarcoma using planar images and compare the results with three-dimensional dosimetry.
Materials and Methods:
Analysis of phantom data provided a complete set of parameters for dosimetric calculations, including buildup factor, attenuation coefficient, and camera dead-time compensation. The latter was obtained using a previously developed methodology that accounts for the relative motion of the camera and patient during whole-body (WB) imaging. Tumor activity values calculated from the anterior and posterior views of WB planar images of patients treated with 153Sm-EDTMP for pediatric osteosarcoma were compared with the geometric mean value. The mean activities were integrated over time and tumor-absorbed doses were calculated using the software package OLINDA/EXM.
Results:
The authors found that it was necessary to employ the dead-time correction algorithm to prevent measured tumor activity half-lives from often exceeding the physical decay half-life of 153Sm. Measured half-lives so long are unquestionably in error. Tumor-absorbed doses varied between 0.0022 and 0.27 cGy/MBq with an average of 0.065 cGy/MBq; however, a comparison with absorbed dose values derived from a three-dimensional analysis for the same tumors showed no correlation; moreover, the ratio of three-dimensional absorbed dose value to planar absorbed dose value was 2.19. From the anterior and posterior activity comparisons, the order of clinical uncertainty for activity and dose calculations from WB planar images, with the present methodology, is hypothesized to be about 70%.
Conclusion:
The dosimetric results from clinical patient data indicate that absolute planar dosimetry is unreliable and dosimetry using three-dimensional imaging is preferable, particularly for tumors, except perhaps for the most sophisticated planar methods. The relative activity and patient kinetics derived from planar imaging show a greater level of reliability than the dosimetry.
Introduction
The purpose of dosimetry is to deduce dose–response relationships for tumors and normal organs, as well as to bring patient-based treatment planning to the clinic based on these relationships. The accuracy and therefore the ability of dosimetry to perform accordingly depend highly upon the accuracy of the activity measurements in the tumors and organs. Planar image quantification, which has long been the principal means of activity quantification used as an input into the calculation of absorbed dose, 1 requires an extensive array of methodological adjustments for scatter correction, 2 –5 attenuation, 6 –8 septal penetration, and, most recently, dead-time correction for whole-body (WB) images involving the relative motion between the camera and imaged object, 9 with an end result that is still controversial. In particular, He et al. 10,11 showed, in the context of phantom studies, an absolute uncertainty of 30% in planar quantification compared with 5% using single-photon emission computed tomography (SPECT) images; the relative quantification, that is, determination of kinetic parameters, is considered to be more reliable 4,12 as the errors from scatter, septal penetration, and attenuation generally cancel out from one time point to the next for the same imaged object. As yet, no such comparison has been extended to clinical data where certain methodological components present a much greater challenge and the potential for increased uncertainty. In particular, the issue of background subtraction becomes more problematic as the superposition of different anatomical features with varying uptakes and depths creates a nonuniform landscape from which it is difficult to extract a reasonable background rate with any accuracy, certainly not with a strictly systematic methodology, and where ad hoc adjustments are often required to determine background rates.
The use of 153Sm-ethylenediaminetetramethylenephosphonate (153Sm-EDTMP) for palliative treatment of bone metastases from a variety of carcinomas is well established, 13 –16 and its therapeutic value for patients with osteosarcoma is being investigated. 17 –20 Sm-153-EDTMP, or Quadramet™, is a bone-seeking calcium mimetic containing the 153Sm radionuclide, which decays by β− emission, with a half-life of 46.5 hours and a maximum β− energy of 808 keV. Sm-153 also emits photons, including a 103 keV photon with 28.3% frequency, which is used for quantitative imaging. This radiopharmaceutical targets new pockets of calcification such as are seen in bony metastases from epithelial tumors and in osteosarcoma. The calcification of new osteosarcoma lesions is in general very rapid so that even recently established tumors can most often be imaged and treated. Any other region of the body that has new calcification will also show uptake of 153Sm-EDTMP, including, but not limited to, bone that is stressed, epiphyseal growth plates, and bone that has had recent lesions. 21 This bone uptake constitutes the large part of the background in the images. Typically, an order of magnitude more of uptake in bone tissue than in soft tissue can be seen, with another order of magnitude (or more) of uptake present in the tumor sites.
Although biodistribution and dosimetry studies of 153Sm-EDTMP have been conducted on animals, 22 –24 the existing human data are almost exclusively in patients with bone metastases of epithelial cancers 25 –31 or for bone marrow transplant 32 or toxicity studies 33 where the focus is not on dosimetry, although with a few notable exceptions. 17,34
In this study, the authors present the methods and results of a retrospective planar imaging-based tumor dosimetry analysis in 14 metastatic osteosarcoma patients treated with 153Sm-EDTMP, which complements previously published clinical results. 19,20,34,35 Because of the high activities involved, camera saturation effects occur and affect quantitative as well as qualitative analysis. Incorrect quantification could lead to false half-life estimations, which would lead to erroneous conclusions concerning the biological dynamics of the activity distribution in the body. To account for these effects, the authors used a previously described method for saturation compensation in cases of relative motion between the detector and patient. 9
The main purpose of this study is to determine the reliability of planar-based dosimetry in clinical data by comparing the relative differences of the anterior and posterior dosimetric values from a set of tumor data for an empiric quantification of the uncertainty in two-dimensional dosimetry. A comparison between two-dimensional and three-dimensional dosimetric results (previously published 34 ) for a set of same tumors and a comparison of the differences in the relative uncertainties estimated in phantoms 11,36 are also undertaken with this objective in mind. In addition, the authors will also compare dosimetric values between the same tumors at different initial dose values and determine the strength of the correlation between the uptakes at two different administered activities.
Materials and Methods
Patients and 153Sm-EDTMP therapy
A phase I dose-finding study of patients with high-grade osteoblastic osteosarcoma was conducted to determine the maximum tolerated injected activity of 153Sm-EDTMP with hematopoietic recovery within 6 weeks. Subsequently, a phase II study was performed to assess the safety and response of high-risk osteosarcoma to a high injected activity of 153Sm-EDTMP, and 11 of 14 patients who participated in the phase I study were determined to be eligible to receive a second high injected activity (tandem dose) of 153Sm-EDTMP. Seven of these patients were imaged for dosimetric purposes. Loeb et al. 19,20 have described the clinical trial details and the treatment plan. Briefly, patients with a positive 99mTc-methylene diphosphonate bone scan finding were included in the study and autologous hematopoietic stem cells were collected before the first treatment with 153Sm-EDTMP (low injected activity), which ranged from 37 to 51.8 MBq/kg (1.0–1.4 mCi/kg). Patients were followed up until hematologic recovery and evaluated for disease response. Approximately 6 weeks after the first treatment, a second treatment (high injected activity) with 222 MBq/kg (6 mCi/kg) of 153Sm-EDTMP was administered. Patients received autologous stem cell infusion 14 days after high injected activity 153Sm-EDTMP therapy. The study was approved by the institutional review board of Johns Hopkins University and informed consent was provided by all patients or their legal guardian. The data were collected from 14 metastatic osteosarcoma patients (ages 11–30 years, mean 18, median 18). The patients presented with a total of 28 tumors (mass 5 g–4 kg, mean 326 g, median 30 g). More detailed patient information is given in Table 1.
When data from both low and high activity regimens are available, both are given, separated by a slash. Tumors that were not present for the low activity regimen are designated by “n.a.”
AA, administered activity.
Quadramet (153Sm-EDTMP) targets new pockets of calcification and therefore does not, in principle, target the earliest form of the disease, which is a soft tissue disease which calcifies. However, the calcification is in general very rapid so that even recently established tumors can most often be imaged and treated. 153Sm-EDTMP can be used to target relatively new disease, which has already accrued mass and calcium deposit, but not disease at the cellular level in the blood stream, for example. Any other region of the body that has new calcification will also show uptake of 153Sm, including, but not limited to, bone that is stressed or that has had recent lesions. This bone uptake constitutes the large part of the background in the images. Typically, for the administered activity range in this study, an order of magnitude more of uptake in bone tissue than in soft tissue can be seen, with another order of magnitude (or more) of uptake present in the tumor sites.
Imaging
Patients were imaged on a GE Infinia Hawkeye gamma camera using a low-energy high-resolution collimator for the low activity regimen and a medium-energy general-purpose collimator for the high activity regimen, using an energy window set at 103 ± 10.3 keV; a sample image is shown in Figure 1. WB scans (Fig. 1) were collected at a sweep rate of 10 cm/minute. Since scatter windows were not set at study acquisition time, scatter correction was performed using a buildup factor correction term. 3,37 Calibration, scatter, attenuation, and count dead-time corrections were implemented as outlined below and in a previous study. 9
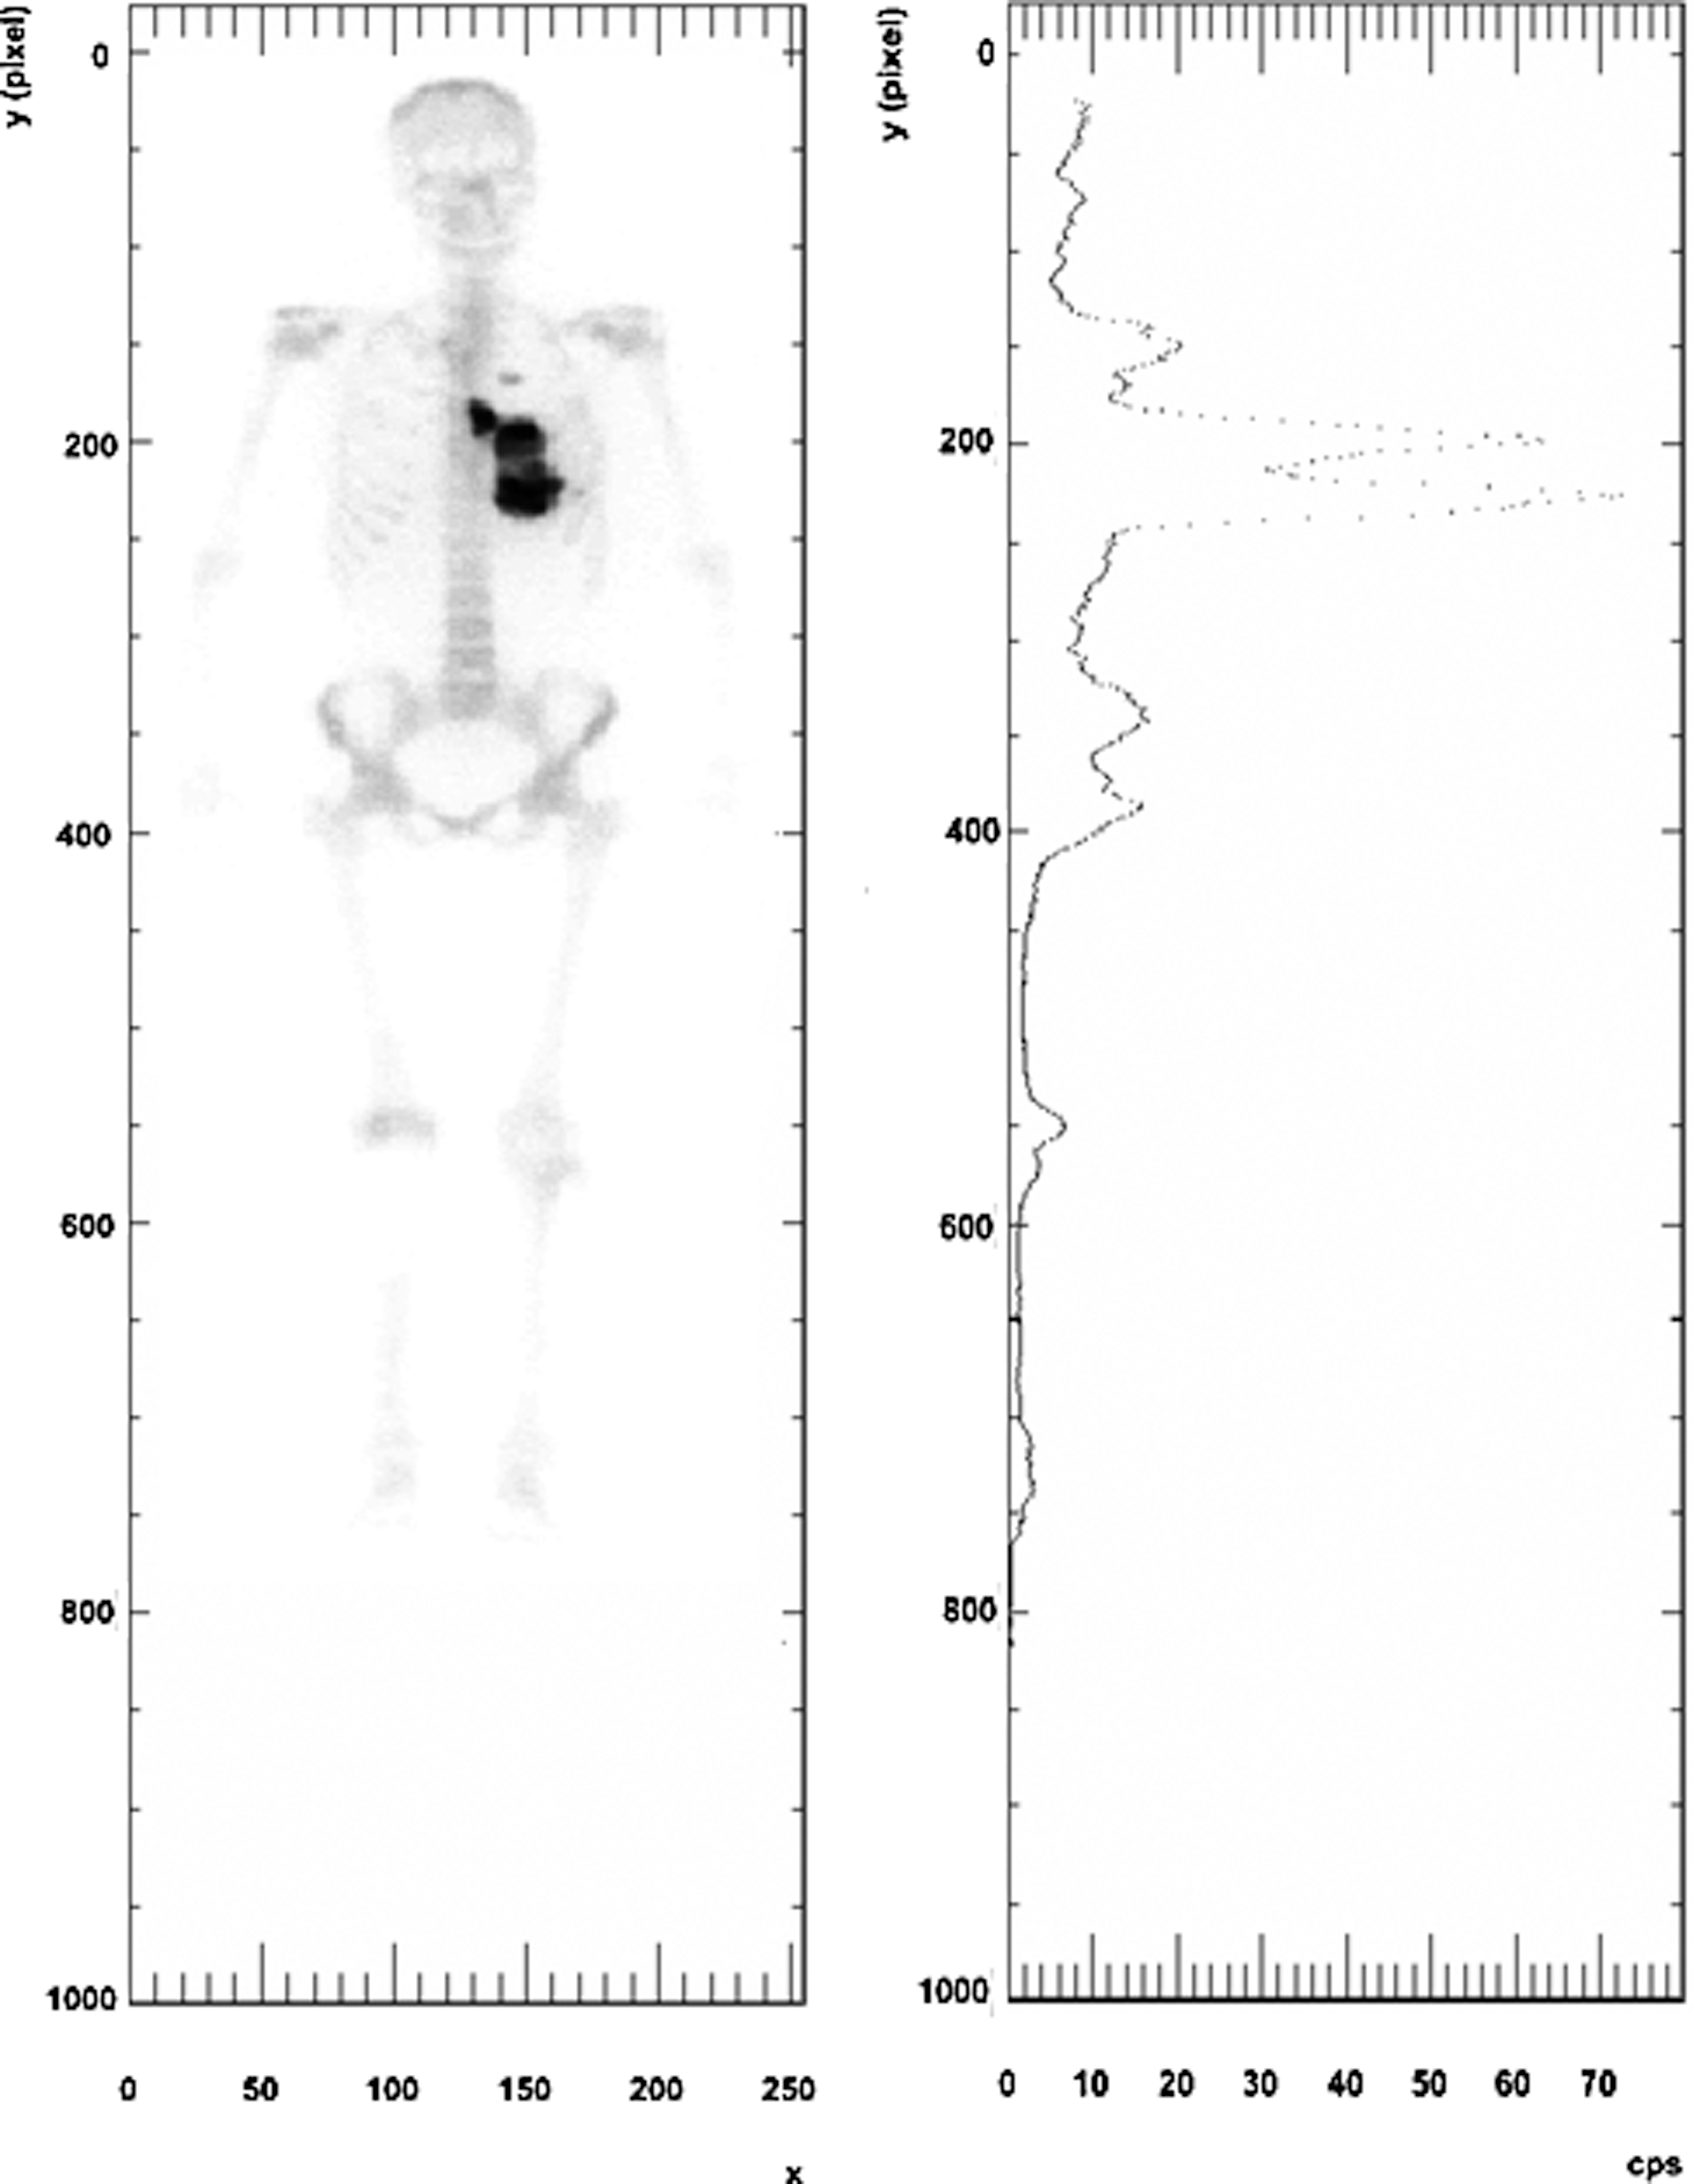
Count image of a patient (left panel). They y-axes are the same for both images. In the right panel, the x-axis shows the sum of the counts measured across the y-row of pixels in the left panel.
In addition, SPECT/CT imaging was done on a subset of the patient population. This allowed for three-dimensional tumor dosimetry using 3D-RD, a personalized dosimetry software package. 38,39 The results of that analysis have been published 34 and were available for comparison with the planar dosimetry.
Dead-time correction
The counts of all the pixels in a same row are affected by saturation in the same proportion. As illustrated in Figure 1a and b, the measured count values were summed for each pixel row (y values) and the corrections were made on a row-by-row basis by applying a previously published methodology developed for this specific purpose. 9 The implementation of this methodology requires a translation of the counts measured spatially to a time-ordered measure of counts, that is, the counts measured as a function of time. This is necessary as the camera dead time is a function of the activity seen by the whole camera and thus the saturation for a specific y-row varies as a function of time as the camera sweeps over all positions, which include y. Thus, the activity quantification does not depend on a single conversion, but is a function of the activity (or count rate) itself and is incorporated into the dead-time effect calculations. Figure 1b shows the number of counts measured as a function of y-position, while Figure 2 shows the specifics of the modifications made to the measured counts. Figure 2a shows the number of counts measured as a function of time, that is, related to the activity seen by the camera at time t. The counts as a function of time (or camera position relative to the patient) are corrected by the factor shown in Figure 2b using a multidimensional adaptation of Newton's method, and the correction factor is then translated to the spatial distribution of counts (y-row values) (Fig. 2c).

Camera dead-time algorithm applied to the patient data shown in Figure 1.
WB half-lives
A check on the correction algorithm for count rate saturation was made by examining the WB clearance half-lives obtained for each patient before and after correction for count rate saturation. The WB effective half-time values are given in Table 2; for comparative purposes, the authors also present the noncorrected values. The half-life was obtained by fitting a monoexponential fit to the WB counts at the different time points. The WB counts were taken as the geometric mean of the posterior and anterior counts.
Low and high activity data are separated by a slash.
HL, half-life; M, mean; SD, standard deviation; WB, whole-body.
Tumor dosimetry
The tumor masses and depths from the anterior and posterior surfaces were determined from CT images acquired a few days before WB planar imaging. The tumor time–activity curves were obtained by drawing tumor regions of interest (ROIs) defined by a threshold of the maximum count value of each individual tumor on anterior and posterior planar images, respectively, which had been previously corrected for count saturation. A core feature of the MIRD anteroposterior methodology of activity determination is the background subtraction. Since the activity measured at the surface of the ROI is the sum of the contribution from the tumor as well as the background activity present in the patient both in front of and behind the tumor, the background activity must be estimated and its contribution to the ROI activity subtracted. For this, a region must be determined where the activity is assumed to be homogeneously distributed as a function of patient depth and is consistent with the background activity present at the level of the ROI. In this methodology, the tumor region is grown from a seed visually placed in a region of high count rate and using a threshold determined experimentally to give an area corresponding visually to the activity from the tumor in question. The background region is determined graphically by symmetry of the tumor with respect to the vertical axis, but with a condition that there be no overlap and with a spacing of a minimum of five voxels between the tumor and background. Figure 3 shows an example of a tumor region and a background region, determined using this procedure.
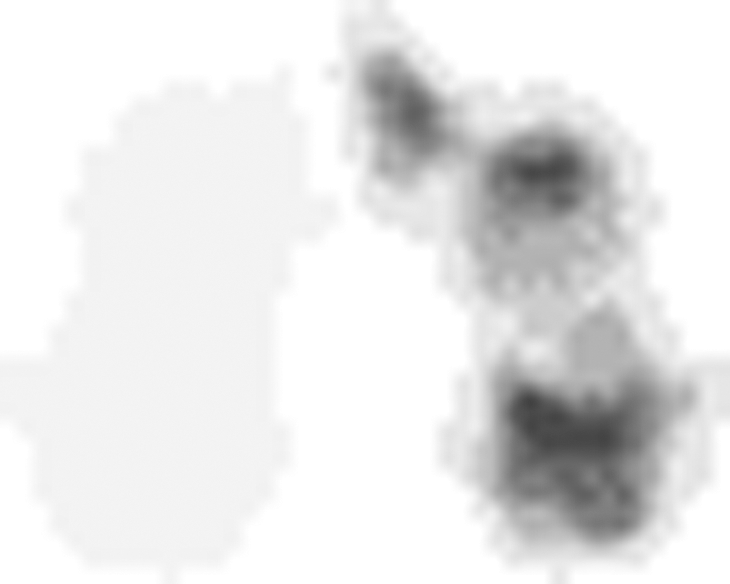
Count image of the tumor (right image) and background (left image) shown in Figure 1. The background region is determined by symmetry of the tumor with respect to the vertical axis, but with a condition that there be no overlap and with a spacing of a minimum of five voxels between the tumor and background.
The counts in the tumor ROIs were scatter and attenuation corrected using a buildup factor method, 3 as implemented in a previous publication. 9 The tumor activity was then determined by applying the sensitivity and dead-time conversion and taking the geometric mean of the anteriorly and posteriorly determined activities. The time-integrated activity for each tumor was obtained by analytically integrating a simple exponential function to the time–activity data for each tumor. The time-integrated activity coefficient (residence time) was then entered into the OLINDA/EXM 40 tumor dose sphere module and the absorbed dose for each tumor was obtained. Note that most patients presented with two time points of imaging, therefore no quantitative evaluation of the goodness of fit was available.
A few patients also were imaged using the SPECT/CT camera and the 3D dosimetry was performed using the 3D-RD personalized dosimetry package. 38,39 The results from this work have been published 34 and served as a comparison for the planar dosimetry results.
Note that the size and location of the tumors are quite diverse (Table 1). Tumors for which there was no CT imaging available were not taken into consideration. Neither did the authors include tumor sites near prosthetics, which create too much scatter in the CT and falsify the density values, as well as make the tumor contours difficult to detect.
The average depths of the tumor from the anterior and posterior body surfaces are also measured using these CT images. These values are then used to calculate photon attenuation through the body tissue, using the buildup factor method. 3
Uncertainty analysis
A first-order estimate of the uncertainty in tumor activity calculations was obtained by comparing the estimated anterior and posterior activities to the value obtained by the conjugate view method.
37,41
In principle, the activity in a tumor can be measured from a single 2D view by measuring the counts in an ROI drawn around the tumor:
where CA/P
are the counts measured on either the anterior (A) or posterior (P) view, respectively, in the ROI drawn around the tumor; s is the sensitivity, which converts counts to activity; and the exponential is the factor that accounts for attenuation, with μ as the attenuation coefficient and dA/P
as the depth of the tumor seen from the anterior (A) or posterior (P) side, respectively. The sensitivity is not applied as a single value, but is incorporated in the dead-time saturation curve, which gives the count rate as a function of activity. This formulation is valid in cases where the anterior–posterior thickness of the tumor is much smaller than the overall anterior–posterior thickness of the patient; otherwise, an integration of the exponential over the thickness of the tumor is necessary. Equation (1) yields only an approximate estimate of the tumor activity since it is valid only when there is no activity outside of the tumor contributing to the measured counts, which is rarely the case. In general, background subtraction is necessary. This single formula has the disadvantage of requiring some three-dimensional information, namely the depth of the tumor, usually obtained with a CT scan; however, since it is valid for both views, the product of the two views gives the following:
Since dA + dP
is the thickness of the patient (D), which may be obtained without 3D imaging, the basic equation for the conjugate view method when the tumor is small and tumor self-attenuation may be neglected is as follows:
This approach is adopted even when three-dimensional information is available and utilized in more sophisticated calculations, such as including tumor self-attenuation and background subtraction, which may be generalized as follows:
where AA
and AP
are the activities calculated from the counts measured in the ROI from the anterior (A) and posterior (P) images, respectively. In principle, if all the appropriate corrections are made, both are equal to A
0. By calculating the difference between A
0 calculated from the posterior and anterior views, an indication of the uncertainty in the values of the activity may be obtained as follows:
The relative difference between anterior and posterior activity is given by the following:
Low activity–high activity comparison
While the dosimetry based on planar imaging quantification remains questionable, planar imaging is generally considered reliable for relative quantification. When available, a comparison was made between the calculated absorbed doses delivered to the same tumor for both regimens, the low activity (1.0–1.4 mCi/kg) and high activity (6.0 mCi/kg), to determine if a five-fold increase in activity results in a comparable increase in uptake and tumor-absorbed dose.
Results
WB half-lives
A check on the correction for count rate saturation was made by examining the WB clearance half-times obtained for each patient before and after correction for count rate saturation. The WB effective half-time values are given in Table 2. The mean ± standard deviation for the uncorrected measured effective WB half-time was 45 ± 6 hours. The dead-time correction model gave 42 ± 6 hours; these should be compared with the physical decay half-life for 153Sm, which is 46.5 hours. More specifically, 11 half-lives were measured as being nonphysical (longer than 46.5 hours) before dead-time correction, while 4 half-lives were still nonphysical after dead-time correction.
Tumor radiation-absorbed dose
The absorbed dose values obtained using the OLINDA/EXM homogeneous spherical model are shown in Table 3, along with the previously published results from the three-dimensional analysis. 34
The (low) index indicates the low activity results, the (high) index indicates high activity results.
AD, absorbed dose; TIA, time-integrated activity.
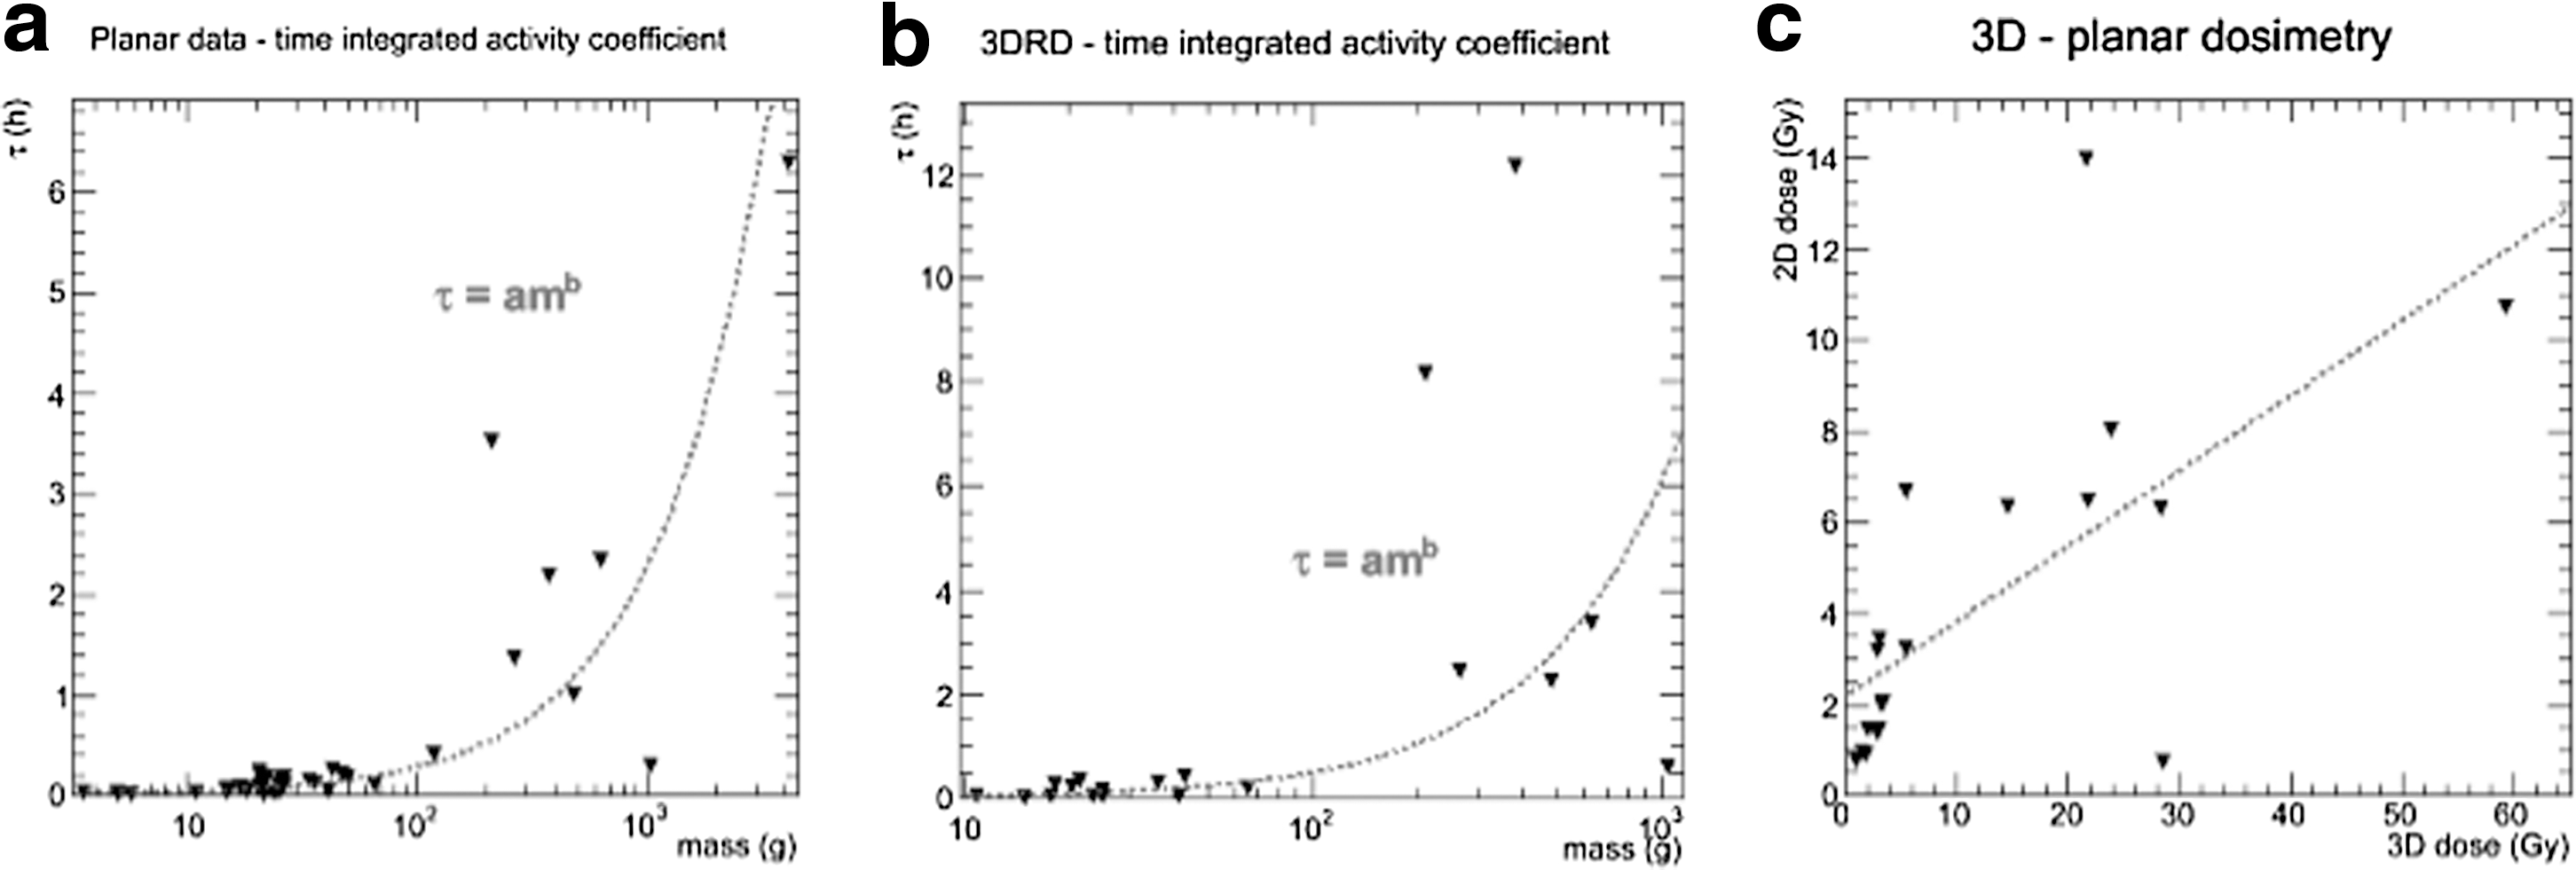
A relationship between the time-integrated activity coefficient, τ, and the tumor mass, m, was examined. Inspired by the mass uptake dependency proposed by Williams et al.,
42
in theory applicable to high-molecular-weight antibodies, τ was plotted against m using both the planar (Fig. 4a) and three-dimensional uptake values (Fig. 4b). Fits of the form of the following equation:
where a and b are the parameters were made to both sets of data. The planar imaging-derived data gave a value of a = 0.00429 h/g and b = 0.91, with a correlation coefficient of R 2 = 0.72. For the three-dimensional data from 3D-RD, the values were a = 0.00340 h/g, b = 1.08, and R 2 = 0.74.
Anteroposterior activity comparison
An assessment of the uncertainty in activity quantification and the absorbed dose estimates was obtained by comparing the anterior and posterior tumor activity calculations. The standard deviation, or σ value, of the percentage difference using Equation (2) is 35.6%. A commonly used value for uncertainty is 2σ, which corresponds to a 95% confidence interval; thus, the uncertainty on the tumor-absorbed dose values as ascertained empirically is on the order of 71.2%. Using Formula (3), the standard deviation is 72.5%. Both sets of results were obtained using 99 of the 112 tumor images (multiple time points per tumor). The remaining 13 values could not be calculated since 1 of the 2 values (anterior or posterior) gave completely nonsensical activity values (could not be distinguished from the background).
3D-RD comparison
The absorbed dose values that were calculated by both the planar and the three-dimensional methodologies were compared (Fig. 4c). However, only a weak correlation was apparent (R 2 = 0.44 for a linear correlation). Moreover, the average ratio of 3D absorbed dose value to 2D absorbed dose was 2.13 ± 1.22, excluding tumor No. 8, which had a ratio of 40.9.
Low activity–high activity comparison
Ten tumors in 7 patients were imaged for both the low-dose (∼1 mCi/kg) and high-dose (∼6 mCi/kg) regimens. A comparison was made between the absorbed dose values. The average ratio was 5.29 ± 2.38, which is on the order of the ratio of activities. However, the dispersion of values is relatively large, and by plotting the low activity absorbed dose (AD) values versus the high-dose AD values (Fig. 5), a linear best fit gives a slope, m, of only 1.98 with a y-intercept of b = 6.57 with a fit value of R 2 = 0.71 (blue line). Fitting the average value gives a correlation of only R 2 = 0.44 (red line). However, by omitting the outlier tumor No. 5, with a low activity/high activity ratio of 1.69 (and with a ratio of 4.06 measured with 3D-RD), a better correlation exists, R 2 = 0.87.
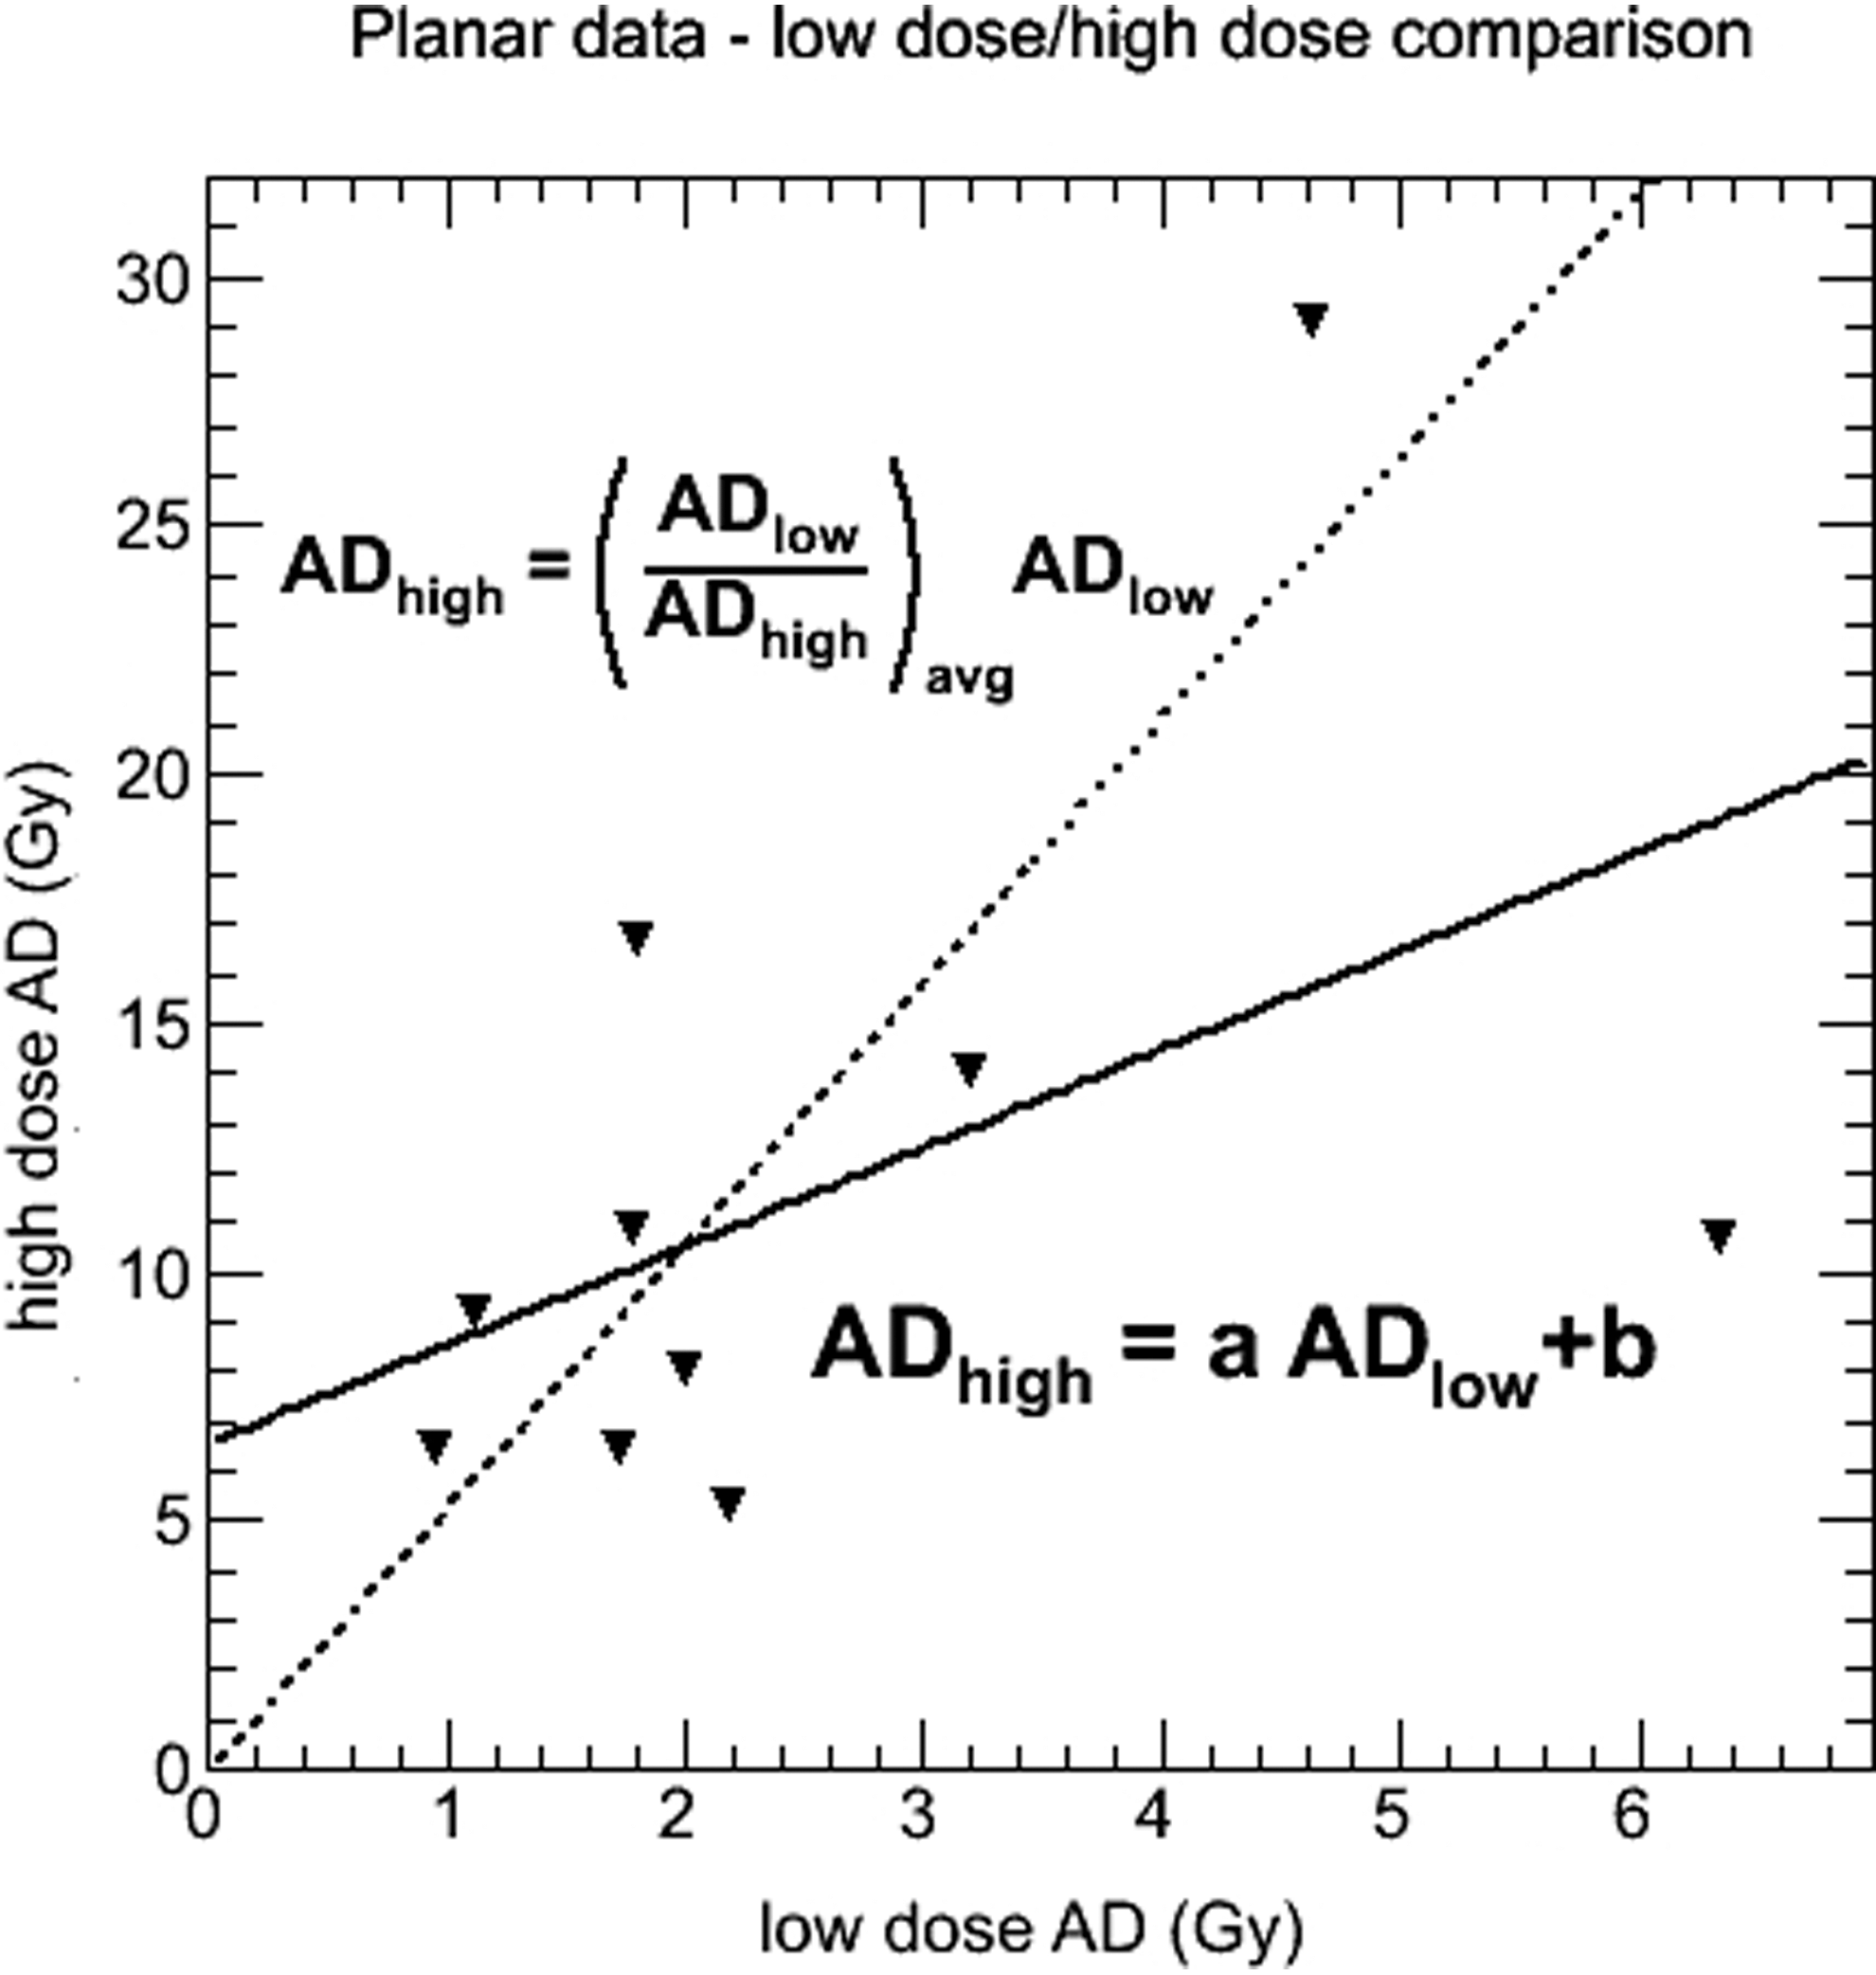
Low activity results plotted versus the high activity results from the planar dosimetry. The solid line shows the fit result, while the dotted line represents the average ratio relationship.
Discussion
A retrospective planar imaging-based dosimetry analysis was performed on osteosarcoma patients administered 153Sm-EDTMP with therapeutic intent. As suggested by the uncorrected WB clearance half-times (Table 2), being longer than the physical half-life of 153Sm, a correction for count saturation was required. The count dead-time correction yielded WB half-lives consistent with the physical decay half-life of the radionuclide.
The correction method used to account for dead time, although quite developed, is still a simplification of a complex phenomenon; in particular, dead time contribution may come from photons reaching the collimator from outside the field of view. Similarly, the assumption that counts of all the pixels in a same row are affected by saturation in the same proportion is a simplification as the count rate degradation of image quality is not uniform across the entire field of view or over the same row. Therefore, although the data point to a reasonable first-order dead-time correction, there is still ample room for improvement of the methodology.
From an uncertainty standpoint, the comparison of the corrected tumor activity for each view with a conjugate view activity measure shows that the corrections applied yielded an uncertainty of ∼71% for the calculated tumor dose estimates. This is higher even than the values (30%) found in phantom studies, 11 although not surprising since the additional complications of overlapping regions and nonuniform background activity make quantification in patients more complex and thus less accurate. Note that the 71% value is an estimate from relative values used to calculate an activity which is unknown, as opposed to the phantom studies where the uncertainty is measured relative to a known truth. Additionally, this value is minimized since in 13 of 112 instances values could not be calculated given that either the anterior or posterior activity value could not be determined. The comparison with the three-dimensional results suggests an equally large discrepancy: on average, the two-dimensional dosimetry gave absorbed dose values more than two times lower than the 3D-RD values.
The foregoing estimate of uncertainty should be considered when interpreting the results of any analysis using activity quantification or dosimetry based on planar imaging. For example, the reliability of the power function fit of the tumor uptake-versus-mass data (Fig. 4a), despite a reasonably high correlation coefficient, is questionable. On the other hand, a similar fit can be seen with the 3D-RD-derived absorbed dose values, although the values of the fitted parameters are different, which is not surprising given the lack of correlation between the two-dimensional and three-dimensional results (Fig. 4c). It must be noted that a strong correlation was previously observed 34 between the absorbed dose from two distinct three-dimensional methodologies, 3D-RD and OLINDA/EXM, using activity acquired from SPECT scans, with the differences (on the order of 5%–10%) being attributed to the lack of external contribution in the OLINDA/EXM simple sphere model. Thus, it appears that the large discrepancies are indeed attributable to the planar activity quantification and methodology, although uncertainties are certainly present in the 3D-RD analysis. In general, it must be stated that a lack of uncertainty or error estimate attached to absorbed dose values regardless of methodology contributes to a general skepticism of dosimetry, where it becomes difficult to appreciate the value of the results, and efforts need to be made to establish methodologies, which will enable a systematic presentation of dosimetric results with error bars. While efforts are indeed underway in this direction, no general methodology has yet been established.
The WB half-life results confirm the value of the camera saturation algorithm as well as confirm that the relative dosimetry is indeed more reliable than absolute quantification for planar dosimetry, as indicated in the literature. 4,12 The average measured tumor half-times are on the order of the physical decay half-life of 46.5 hours, confirming previously published results, 28 although with a much greater variability than with the WB results. As a first approximation, the 153Sm-EDTMP binds to the tumor site such that there is relatively little biological clearance, unlike high-molecular-weight antibody agents, which have a more prolonged uptake time. 43 However, the tumor half-life results suggest some amount of tumor uptake beyond the first time point (4 hours), although the nature of the tumor dosimetry methodology, in particular the background subtraction, suggests caution in this assessment.
Given the more reliable nature of the relative dosimetry, that is, the ratio of the quantification at different time points, the correlation between low activity and high activity absorbed doses seems on more stable footing. Indeed, the average ratio of 5.3 is consistent with the ratio of administered activities and is consistent with the average value (5.1, determined from the four tumors common to both low activity and high activity 3D analysis) previously determined from a different subset of patients using 3D-RD. 34 However, given the wide range of values, it seems that individual patient uptake may vary from administration to administration possibly due to any number of patient or tumor biological factors; therefore, when using pretherapeutic administrations to predict or plan for higher activity regimens, caution must be taken not to adopt a too literal interpretation of the linear scaling and account for individual discrepancies.
Another interpretation of the results suggests that a hybrid method as described by He et al., 11 for example, where the kinetics of the planar imaging are combined with the absolute quantification of the 3D imaging (SPECT in this case), would likely provide a quantification scheme with a greater accuracy than by planar imaging alone, perhaps comparable with 3D dosimetry. This has generally been admitted (Dewaraja et al. 44 ) with the caveat that there are instances where intratumoral uptake and retention vary as a function of time and for which 3D imaging at every time point would still be optimal. 45 Moreover, the advantage of complete 3D data sets is the ability to run Monte Carlo and score energy within the different volumes of interest (VOIs) from all activity within the field of view. As mentioned, Senthamizhchelvan et al. 34 have shown for a subset of this same data set that the external dose contribution to tumors can vary up to 10% of the total dose.
As concerns the absolute quantification and the discrepancies observed between the planar and 3D dosimetries, a possible cause for this major difference could be attributed to the particular uptake pattern and large quantities of radiopharmaceutical administered. The background counts used for subtraction tended to be high given that the patients receive up to 400 mCi of activity and that a substantial fraction of this activity was present in the skeleton and that often the regions of uptake included some amount of skeleton to be subtracted.
Recent experience in tumor dosimetry has shown that a single absorbed dose value is unlikely to be predictive of tumor control. Indeed, quantities that take into account tumor heterogeneity such as the equivalent uniform dose are much more likely to correlate with tumor control. This observance has a theoretical basis 46 and is supported by evidence collected in clinical studies. 34,47 In addition to the large uncertainties, planar dosimetry is unable to distinguish activity heterogeneity and assumes uniform distribution of activity and a homogeneous composition of the tumor. These conditions will be met in some tumors, but, especially for osteosarcoma, these estimates must be seen as a first-order approximation and more accurate estimates will require an accounting of the density and composition inhomogeneities, as well as the nonuniformity, in absorbed dose. For normal organs, the discrepancies may be less or systematic, in which case planar dosimetry adapted to specific organs such as the posterior view-only approach for kidneys may be adequate. 48 Additionally, more sophisticated methods of planar quantification have been developed, which are more accurate 49,50 ; however, they are not widely available, nor do they resolve the issue of tumor nonuniform uptake. Indeed, a caveat to the conclusions regarding the levels of uncertainty in planar dosimetry is that this article made use of a particular approach and generalizations regarding the exact accuracy of planar quantification should be made with caution. Direct comparisons with this planar activity quantification would be enlightening; however, the artistic nature of background subtraction in patients and the unequivocal greater uncertainties associated with phantom planar quantification regardless of the methodology urge for a cautious use of planar-based quantification and dosimetry.
From a clinical perspective, experience with external radiotherapy treatment of osteosarcoma suggests that 50–70 Gy are required for this radioresistant tumor. 51 –53 The values presented here are well below this threshold. Higher administered activities will yield higher absorbed doses, increasing the likelihood of therapeutic benefit; however, considering that a similar trial with administered activities of 30.0 mCi/kg has yet to yield significant therapeutic results, 18 the efficacy might be increased by combining targeted radiotherapy for osteogenic sarcoma with other modalities in a combined front-line treatment, 54 as has been already proven effective for myeloma. 27
Conclusions
This study presents retrospective planar tumor dosimetry results as well as an assessment of the uncertainties in tumor activity quantification from WB planar imaging in clinical cases of patients treated with high administered activities of 153Sm-EDTMP. Results indicate that absolute planar dosimetry is unreliable and dosimetry using three-dimensional imaging is preferable, particularly for tumors, except perhaps for the most sophisticated planar methods.
Footnotes
Acknowledgments
This article has received support from the National Institutes of Health through the following grants: NIH/NCI 2R01 CA116477 and R01 CA163870.
Disclosure Statement
No competing financial interests exist.