
Abstract
Purpose:
We evaluated the possibility to assess 90Y-PET/CT imaging quantification for dosimetry in 90Y-peptide receptor radionuclide therapy.
Methods:
Tests were performed by Discovery 710 Elite (GE) PET/CT equipment. A body-phantom containing radioactive-coplanar-spheres was filled with 90Y water solution to reproduce different signal-to-background-activity-ratios (S/N). We studied minimum detectable activity (MDA) concentration, contrast-to-noise ratio (CNR), and full-width-at-half-maximum (FWHM). Subsequently, three recovery coefficients (RC)-based correction approaches were evaluated: maximum-RC, resolution-RC, and isovolume-RC. The analysis of the volume segmentation thresholding method was also assessed to derive a relationship between the true volume of the targets and the threshold to be applied to the PET images. 90Y-PET/CT imaging quantification was then achieved on some patients and related with preclinical tests. Moreover, the dosimetric evaluation was obtained on the target regions.
Results:
CNR value was greater than 5 if the MDA was greater than 0.2 MBq/mL with no background activity and 0.5–0.7 MBq/mL with S/N ranging from 3 to 6. FWHM was equal to 7 mm. An exponential fitting of isovolume RCs-based correction technique was adopted for activity quantification. Adaptive segmentation thresholding exponential curves were obtained and applied for target volume identification in three signal-to-background-activity-ratios. The imaging quantification study and dosimetric evaluations in clinical cases was feasible and the results were coherent with those obtained in preclinical tests.
Conclusions:
90Y-PET/CT imaging quantification is possible both in phantoms and in patients. Absorbed dose evaluations in clinical applications are strongly related to targets activity concentration.
Introduction
The administration of the therapeutic radiopharmaceuticals known as molecular radiotherapy (MRT) is increasingly used for an efficient treatment of cancer patients. The optimization of the absorbed dose to the biological target volumes and the accurate assessment of dose/s received by the critical organs is the main concern for the effective planning of MRT. A visualization and quantification of activity distribution in each individual patient and lesion may provide a personalized—peptide receptor radionuclide therapy (PRRT) to cancer patients. 1
At present, radiopharmaceutical administration for therapeutic purpose is usually performed according to strictly established schedules, without considering the individual variations in absorbed radiation dose and, finally, the different dose-related effects.
Undoubtedly a personalized dosimetric evaluation in MRT would represent the ideal approach—strongly recommended—such as in external beam radiation therapy. Nevertheless, imaging acquisition and processing protocols are time consuming and not routinely applicable. Patients themselves are not always able to be enrolled for long-term scanning.
PRRT is widely used for internal radiotherapy of neuroendocrine tumors and consists in the systemic administration of a synthetic peptide labeled with 90Y. This compound is able to irradiate tumors and their metastases via the internalization through specific somatostatin receptors, overexpressed on the cell membrane. 90Y-based PRRT is conventionally administered in several cycles allowing a consequent dose fractionation. Nevertheless, unavoidable dose to kidney, bone marrow, and other non-target tissues, and the large variability in biodistribution and tumor uptake among patients, should be addressed. Thus, precise and reliable dosimetry of normal organs and tumor with these agents is needed, and its achievement is challenging. Bremsstrahlung SPECT/CT imaging, performed after 90Y-peptide administration, has been recognized to be a useful method to detect the radiopharmaceutical distribution and, at the same time, a quickly scanning modality well accepted by the patients. 2 –4 However, the low spatial resolution does not allow an accurate visualization of the intra-lesion activity distribution.
Many recent studies regarding PET/CT acquisitions were assessed to verify the biodistribution of 90Y-microspheres (administered via intra-arterial injection into branches of the hepatic artery in liver-tumor-bearing patients) and confirmed the possibility to obtain accurate imaging, which enables to carefully reproduce the heterogeneous distribution of the microspheres corresponding to the different regions of the tumor and the surrounding healthy tissues. In particular, the high intra-lesion concentration of the radiospheres provides the key element to achieve such a defined imaging. 5 –11
A limited literature is available on the use of 90Y-PET/CT image data for intra-lesion dosimetry analysis of lesions with low activity concentrations (ACs) following systemic infusion with based 90Y-labeled (used in PRRT 12 –14 and radioimmunotherapy 15 ) compounds.
90Y is not an ideal radionuclide for PET imaging, especially when compared with the radiotracer routinely used in nuclear medicine diagnostic procedures.
Based on this limitation, the principal aim of the present article was to analyze quantitatively the imaging quality through some main parameters, specifically, the minimum detectable activity (MDA) concentration, the contrast to noise ratio (CNR), the partial volume effect (PVE) and the recovery coefficients (RCs), the spatial resolution, and finally, the volume segmentation thresholding method.
MDA is a useful index able to characterize the performance of a PET scanner at very low activity distribution. It is defined as the lowest AC level that can be detected in a reconstructed PET image. The detection limit depends on the lesion background contrast and the noise in the background, so called CNR. The Rose criterion states that, to be detectable, CNR of an object must have a value ranging from at least 3–5. 15 –19
PVE is caused by the limited spatial resolution of PET 20 and it results in a systematic underestimation of the imaged AC in small lesions.
The RC-based correction method is an example of PVE correction at a regional level and is usually adopted in PET and SPECT lesion imaging quantification.
In this study three RC-based correction techniques were considered. These approaches differed with respect to the volume of interest (VOI) drawn to determine the imaged AC: maximum-RC, resolution-RC, and isovolume-RC.
Maximum-RC uses the maximum value of a single voxel within the VOI. Resolution-RC employs the average of all voxel values within the spherical VOI with a diameter of the scanner resolution. Finally, isovolume-RC uses the average of all voxel values equalling physical volume of the targets. 21
According to the PVE correction, different 90Y-RC curves were defined taking into account different S/N, to evaluate the background spill-in effects.
Furthermore, a significant aspect of the imaging quantification, related to the absorbed dose evaluations, is the accuracy of PET-based tumor volume delineation.
Visual and fixed segmentation threshold are the most widely used techniques, although they might lead to significant errors in the volume estimation. 22 –24
In this study, adaptive segmentation thresholding curves were applied for target volume identification in three conditions of signal-to-background activity ratios.
As the distribution of activity within tumor and non-tumor target is consistent with the irradiation dose, an accurate molecular imaging might represent an ideal tool to monitor any activity variation within the tissue/tumor following PRRT.
Phantom activity quantification study was realized by uniform AC within the radioactive spheres. Nevertheless, the clinical condition can be very different since it could present irregular geometric shape of the lesions and nonuniform distribution of tumor uptake and background.
A preliminary study based on texture analysis was performed to verify the possibility to assess a dosimetric evaluation at voxel level. The texture analysis on the phantom and on clinical PET-imaging in terms of textural indexes was applied by using a mathematical algorithm that was based on the spatial variation of pixel intensity. 25,26
The aim of this study was to verify the possibility of using the information derived from PET data quantification for optimization of the administered radioactivity and the treatment response monitoring during the course of 90Y-PRRT.
Materials and Methods
PET/CT imaging system
The characteristics of the time-of-flight (TOF) PET/CT scanner (Discovery 710 Elite; GE) used in this study are presented in Supplementary Table S1; Supplementary Data are available online at
Acquisition and reconstruction
All the images were acquired for 30 min; only one acquisition lasted for 60 min.
The data were reconstructed using 3D-ordered subset expectation maximization algorithm applied in conjunction with the proprietary VUEPOINT FX—TOF correction and the implementation of the point spread function (SHARP-IR).
Two iterations and four subsets were adopted with a standard Gaussian postreconstruction filter equal to 3 mm.
The CT acquisitions parameters were as follows: 120 kV tube voltage, 80 mA tube current, 3.75 mm slice width, 0.6 s rotation time, and a pitch of 0.93.
Phantom study
Source preparation and acquisitions
The image quality, NU-2 phantom was used for preclinical experiments. It consists of a fillable torso-shaped compartment (9.7 L) and a set of six fillable coplanar spheres. In this study only the three biggest spheres (diameter=22, 28 and 37 mm) were used to simulate neuroendocrine lesions. A further sphere (diameter=60 mm) was added to complete the tests. The spheres were injected with free 90Y with an initial maximum AC equal to 4.6 MBq/mL (sphere diameter=60 mm), 4.6 MBq/mL (sphere diameter=37 mm), 5.3 MBq/mL (sphere diameter=28 mm), and 6.3 MBq/mL (sphere diameter=22 mm).
In the last acquisition the AC decreased up to 0.05 MBq/mL (sphere diameter=60 mm), 0.07 MBq/mL (sphere diameter=37 mm), 0.05 MBq/mL (sphere diameter=28 mm), and 0.2 MBq/mL (sphere diameter=22 mm).
The phantom acquisitions were realized with no 90Y-background activity in the volume of the phantom and adding a background AC equal to 267 and 801 kBq/mL, respectively.
In a first group of acquisitions the biggest sphere (diameter=60 mm) was placed outside the phantom, aligned and behind it, and therefore the scans were performed in two bed positions. In the remaining tests the biggest sphere was inserted inside the phantom and in this case, only one bed position was sufficient to acquire the phantom image.
S/N of the images was evaluated considering the maximum value within the VOI of the radioactive source and the mean value within the VOI in the background region. 21
Data analysis
CNR and MDA concentration
The CNR (Eq. 1) is an index to establish the detection limit of an imaging system. Many studies aimed to assess the MDA concentration (MBq/mL) in preclinical situations
16
and the Rose criterion was usually adopted for the imaging analysis. It states that an object is discernable when CNR is greater than 5
15
:
CS=radioactive source intensity
CB=background intensity
σB=background noise intensity
Among all acquired scans, the images with lower AC, ranging from 0.05 to 2.2 MBq/mL, inside the radioactive spheres, were selected for the MDA evaluations.
Especially, the analysis of the CNR parameter was performed on two 90Y-PET/CT acquisitions (30 min/bed) for all radioactive inserts with no background activity inside the phantom (S/N ratio of infinity). Subsequently, two other scans, which lasted 30 and 60 min/bed, with variable S/N were analyzed. In these acquisitions the biggest sphere (V=110 mL) was located outside the phantom, hence in this case the CNR of this sphere has not been evaluated.
Additionally, the evaluation of CNR was assessed also on the 90Y-post-therapy imaging of three patients.
To apply Equation (1) in phantom tests and in clinical conditions, one ROI was drawn within the source and Cs was the mean value of the MBq/mL of the ROI. Moreover, CB value was obtained as average of the mean values belonging to 20 ROIs with area equal to 6.4 cm2, localized in the background and randomly chosen.
Full width at half maximum
The 90Y full width at half maximum (FWHM) was assessed by using NEMA Standards Publication NU2-2007 guidelines. 20 The tests were performed by the automatic procedures of the NEMA Quality Assurance tools, which are installed in the acquisition console (Dayton Console; GE). The AC of the sources was equal to 3 GBq/mL. The elaboration of the images was obtained by ImageJ plugin.
RCs study
The use of RCs in 90Y-PET imaging is a method used to correct the imaged AC, Cimg, for the PVE.
The RC (Eq. 2) is the ratio of Cimg, (kBq/mL)images, to the true (or prepared) AC, Ctrue, (kBq/mL)true where Cimg and Ctrue were defined via the VOI technique and the dose calibrator, respectively.
Cimg=(kBq/mL)images is the value provided from PET/CT system, where 90Y radioisotope was set up for the images acquisition.
Ctrue=(kBq/mL)true is the AC prepared and inserted in the spheres.
Three RC-based correction approaches were considered in this article: maximum-RC, resolution-RC, and isovolume-RC. They differ with respect to the VOI drawn on reconstructed images. Maximum-RC was the maximum voxel value (Cimg) within each object. Resolution-RC was performed by placing the center of the spherical VOI at the position of the maximum AC, which was close to the center of the object itself. The spherical VOI had a diameter of 12 mm; the mean voxel value (Cimg) in the resolution VOI was the resolution-RC. Finally, to identify isovolume-RC, a VOI encompassing the entire sphere was drawn by maximum threshold volume segmentation and the average of all voxel values (Cimg) was adopted.
Since the RC is known to be dependent on the spill-in effect, preclinical tests were also performed to assess RCs curves based on different S/N that were as follows: 3<S/N<5 (BKG1), 5<S/N<16 (BKG2), and no free background (NO BKG) activity.
Determination of target volume by adaptive thresholding segmentation method in different S/N
The segmentation of tumor volume in PET is usually performed by thresholding methods, which requires a priori estimation of the lesion volume, “true volume,” from anatomic images such as CT.
In this study the adaptive thresholding method was based on phantom measurements using radioactive spheres of known AC and volumes to derive a relationship between the true volume and the threshold to be applied to the PET images. Since the threshold-volume curves depend on S/N, they were obtained at varying of source-to-background activity ratios (3<S/N<5, 5<S/N<100 and S/N>100) corresponding to the typical conditions of the clinical target volume in 90Y-PRRT.
The adaptive segmentation thresholding was verified in the radioactive sources and in patients having CT-visible tumors, in which the sphere inner volume and CT volumes of tumors, respectively, served as gold standard. 22 –24
For each radioactive insert the optimum threshold was adopted on the PET images with the aim of measuring the true volume of the spheres for a given S/N. The mathematical fit of the segmentation thresholding curves relative to the three evaluated S/N was assessed by “cftool” of Matlab software.
Patient study and targets dosimetry
As a clinical application of the phantom tests, three patients who received 90Y-PRRT were selected for the quantitative analysis of the imaging.
The analysis and evaluations of the quantitative values such as CNR, S/N, volume segmentation threshold and texture index were assessed to compare the results on clinical PET images with those obtained on the phantom in preclinical studies.
Patients received therapeutic administration (∼1.85 GBq) of radiolabeled peptides with an infusion of amino acid solution for renal protection.
The evaluation of the activity biodistribution and absorbed dose in lesions and kidneys were performed by SPECT/CT scans (Symbia T2; Siemens) 3,4 at 4 and 24 h after the radiopeptide injection, and by one PET/CT acquisition on the abdominal region at 6 h. 13
The acquisition and reconstruction parameters were set up according to those used in preclinical tests.
Tumor and kidney activities were estimated from PET images applying the isovolume-RC curves for the PVE correction.
Similarly, the activity from SPECT/CT images was determined by using the calculated RC for PVE correction as described in the precedent article. 3 The effective half time (t1/2eff) was calculated from the SPECT/CT scans at 4 and 24 h postinjection with monoexponential fit to generate time-activity curves.
The target time-integrated activity Ã(rS,TD) was multiplied by the S(rT←rS) values, assuming a unit density sphere model, to obtain the absorbed dose according to the Medical Internal Radiation Dose schema
27
:
rT=target tissue
TD=dose-integration period
Ã(rS,TD)=time integrated activity in rS over TD
S(rT←rS)=absorbed dose in rT per nuclear transformation in rS; for 90Y rT≡rS, only.
The S values used for the dosimetric evaluations were calculated by using an exponential interpolation of the S values of the spheres provided by OLINDA/EXM software.
Analysis of 3D AC distribution in spherical sources and in clinical targets for quantifying tumor heterogeneity
The computation of tumor heterogeneity can be related to texture analysis that refers to mathematical methods to compute quantitative textural features from 2D or 3D images based on the spatial variation of voxel intensity. 26 In this study the phantom and tumor VOI heterogeneities were calculated and compared in a numerical form. Especially, inhomogeneity and asymmetry of the 3D-PET activity distributions in the VOI of the phantom and target patients were analyzed by the calculation of three different statistical parameters: fractional standard deviation (FSD), Skewness (SK), and Kurtosis (K). 25
FSD (Eq. 3) is defined as the standard deviation (σ) of a voxel cluster values divided by the mean (μ) of those voxel values belonging to the cluster:
It provides a way of comparing variance in different situations, since it is independent from absolute intensity value.
SK(I) represents a measure of the degree of asymmetry of a distribution and is calculated as Equation (4):
where μ and σ are the mean and standard deviation of the selected image intensity histogram values, I. Skewness takes positive values when most of the data are concentrated toward the low-value side of the histogram distribution, but has a longer tail toward the right and takes negative values when the opposite is true. 25
While FSD measures the variation in the image intensities, SK gives an idea of the shape of the image intensity distribution in a cluster of N voxels.
K(I) quantifies how a distribution is sharp (Eq. 5):
The 3D-PET AC distributions of the VOIs of the phantom sources were processed to define a correlation between the required isovolume segmentation threshold to identify the real volume of the targets and the inhomegeneity of the target's image intensity distribution determined by FSD values. 25
Moreover, the intensity distributions within the cluster of the spherical sources and the clinical volume were compared by the calculation of SK and K values.
The image texture elaboration was obtained by using the Chang-Gung Image Texture Analysis (CGITA_GUI) 26 based on Matlab software that is an open office source project hosted on the World Wide Web.
Results and Discussion
CNR and MDA concentration
Table 1 shows the results relative to the evaluation of CNR and MDA concentration in the phantom.
NO BKG, no free background.
Figure 1a and b illustrates the 90Y-PET images relative to the evaluation of CNR in the presence of free background activity inside the phantom.
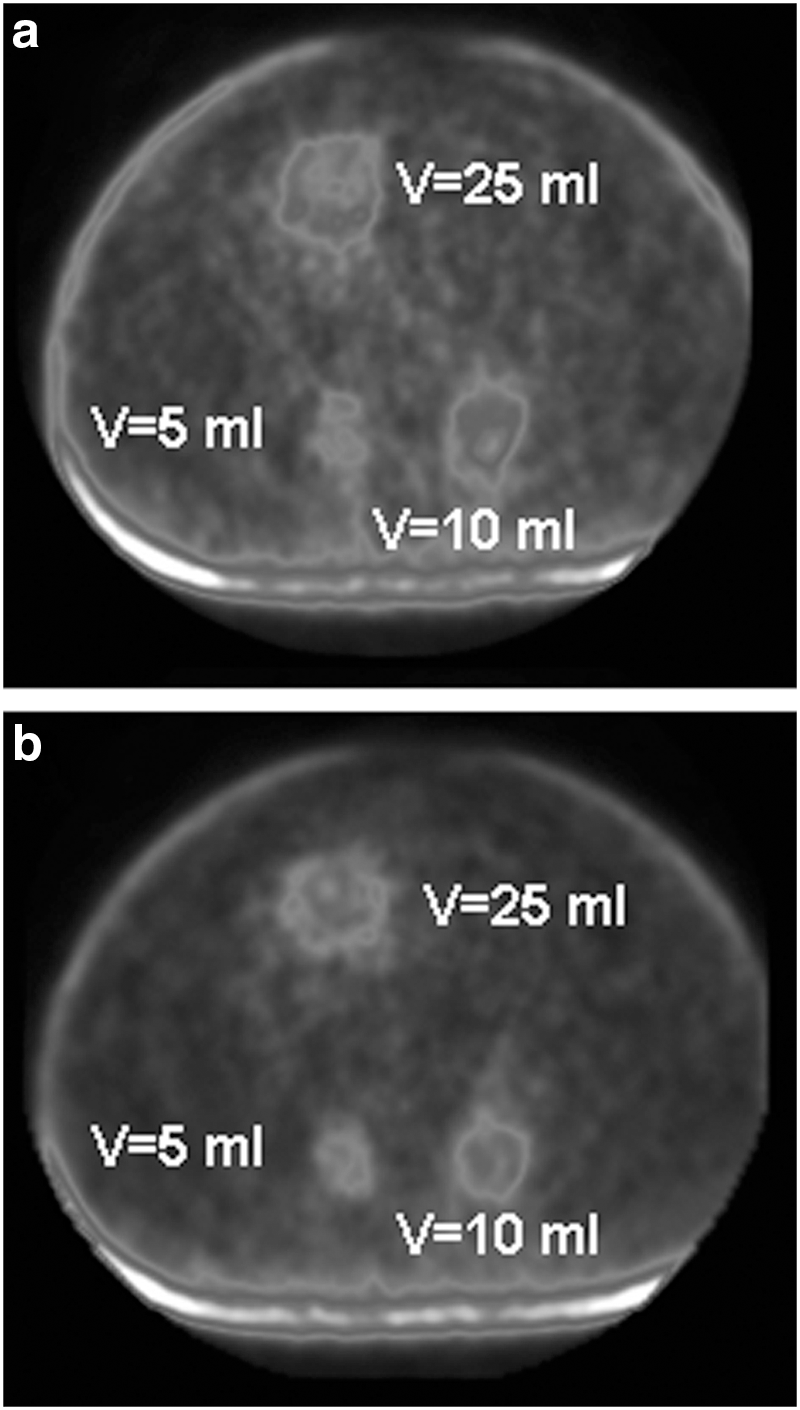
PET images relative to the preclinical evaluations of the contrast-to-noise ratio (CNR) in presence of free background activity inside the phantom.
The values of CNR were higher than the limit for the detectability (CNR>5) in all acquisitions where the AC was greater than 0.2 MBq/mL (NO BKG).
Moreover, the values were greater than 5 and MDA equal to 0.7 MBq/mL, when S/N was ranging from 3 to 6.
The values of CNR (Table 1) appear coherent with the results of Carlier et al., 15 which reported values of MDA equal to 0.5 MBq/mL (V=5 and 10 mL).
Furthermore, longer acquisition times (60 min/BED) allowed to reduce statistical image noise providing higher CNR values in the presence of a lower AC.
Full width at half maximum
The system spatial resolution was determined equal to 7 mm according to similar results obtained in other articles. 6 –10,12 In this study, FWHM was determined in air, and therefore it is not completely representative of the spatial resolution of the equipment in clinical condition. However, its value result improved especially if it is compared with the 90Y-resolution of a SPECT/CT equipment (19 mm). 3
The better spatial resolution of 90Y-PET imaging, as visible also in clinical images of the patients (Fig. 6), allows a superior evaluation of the rim of the lesions and could bring to an evaluation of different activity distribution within the tumor.
RC study
An exponential model with asymptotic trend describes 90Y resolution, maximum and isovolume-RC curves:
where:
A, B, C=constants
V=volume (mL)
Figure 2 shows the 90Y-RC curves obtained with NO BKG activity inside the phantom (NO BKG), while Figure 3 reports the curves with S/N ranging from 3 to 5 (BKG1) and S/N ranging from 5 to 16 (BKG2).

90Y-RC curves obtained from the experimental data with no free background (NO BKG) activity inside the phantom. An exponential model with asymptotic trend describes 90Y resolution, maximum and isovolume-RC curves: RC=A*exp(-B*V)+C where A, B, C are constant and V is the volume (mL) of the source. As showed in figure, RCMAX, RCRIS, and RCISO assumed very different values, especially when comparing the asymptotic component C of the three equations (CNOBKGMAX=1.1, CNOBKGRIS=0.71, and CNOBKGISO=0.5).

90Y-RC curves obtained with S/N ranging from 3 to 5 (BKG1) and S/N ranging from 5 to 16 (BKG2). In presence of free background activity with higher or lower intensity (BKG1: 3<S/N<5 and BKG2: 5<S/N<16) the differences among the three RC-methods appear flattened. CBKG1MAX and CBKG2MAX were equal to 0.75 and 0.7, respectively, while CBKG1RIS≡CBKG2RIS=0.6 and CBKG1ISO≡CBKG2ISO=0.5.
All experimental data obtained by the three RC-based methods are showed in Figure 4.

90Y-RC curves assessed from all experimental data by the three RC-based methods. Considering all experimental data, resolution-RCs had a sensible variability in the presence of different S/N (0.59<CRIS<0.71) and its correlation coefficient (R2) was equal to 0.43. Isovolume-RCs showed the highest stability (0.49<CISO<0.51) and the R2 of the isovolume-RCs curve was 0.56. Maximum-RCs assumed very different values (0.73<CMAX<1.2) in the presence of variable S/N; R2 of maximum-RCs fitting was 0.37.
As visible in Figure 2, RCMAX, RCRIS, and RCISO assumed very different values, especially if the asymptotic components of Equation (1) are compared (CNOBKGMAX=1.1, CNOBKGRIS=0.71, and CNOBKGISO=0.5).
In presence of free background activity with higher or lower intensity (BKG1: 3<S/N<5 and BKG2: 5<S/N<16) the differences among the three RCs-methods appear flattened (Fig. 3). CBKG1MAX and CBKG2MAX were equal to 0.75 and 0.7, respectively, while CBKG1RIS and CBKG2RIS=0.6, and CBKG1ISO and CBKG2ISO=0.5.
Finally, considering the fitting (Fig. 4) of all experimental data, resolution-RCs had a sensible variability in presence of different S/N (0.59<CRIS<0.71). The resolution-RCs curve had a correlation coefficient (R2) equal to 0.43.
Isovolume-RCs showed the highest stability (0.49<CISO<0.51) and the R2 of the isovolume-RCs curve was 0.56.
Maximum-RCs assumed very different values (0.73<CMAX<1.2) in presence of variable S/N; R2 of maximum-RCs fitting was 0.37.
According to these results and considering the typical S/N of the targets in 90Y-PRRT, the isovolume-RC-based correction was adopted for imaging quantification in clinical cases.
Determination of target volume by adaptive thresholding segmentation method in different S/N
Different regression models 21,23 were evaluated to implement the adaptive thresholding segmentation method in presence of S/N similar to the clinical conditions and considering volumes ranging from 5 to 110 mL. It was decided to adopt the fitting with higher correlation coefficient (R2).
The adopted model (Eq. 7) depending on the target volume (V) is formed from an exponential decreasing curve and an adaptive term depending on S/N (Fig. 5):
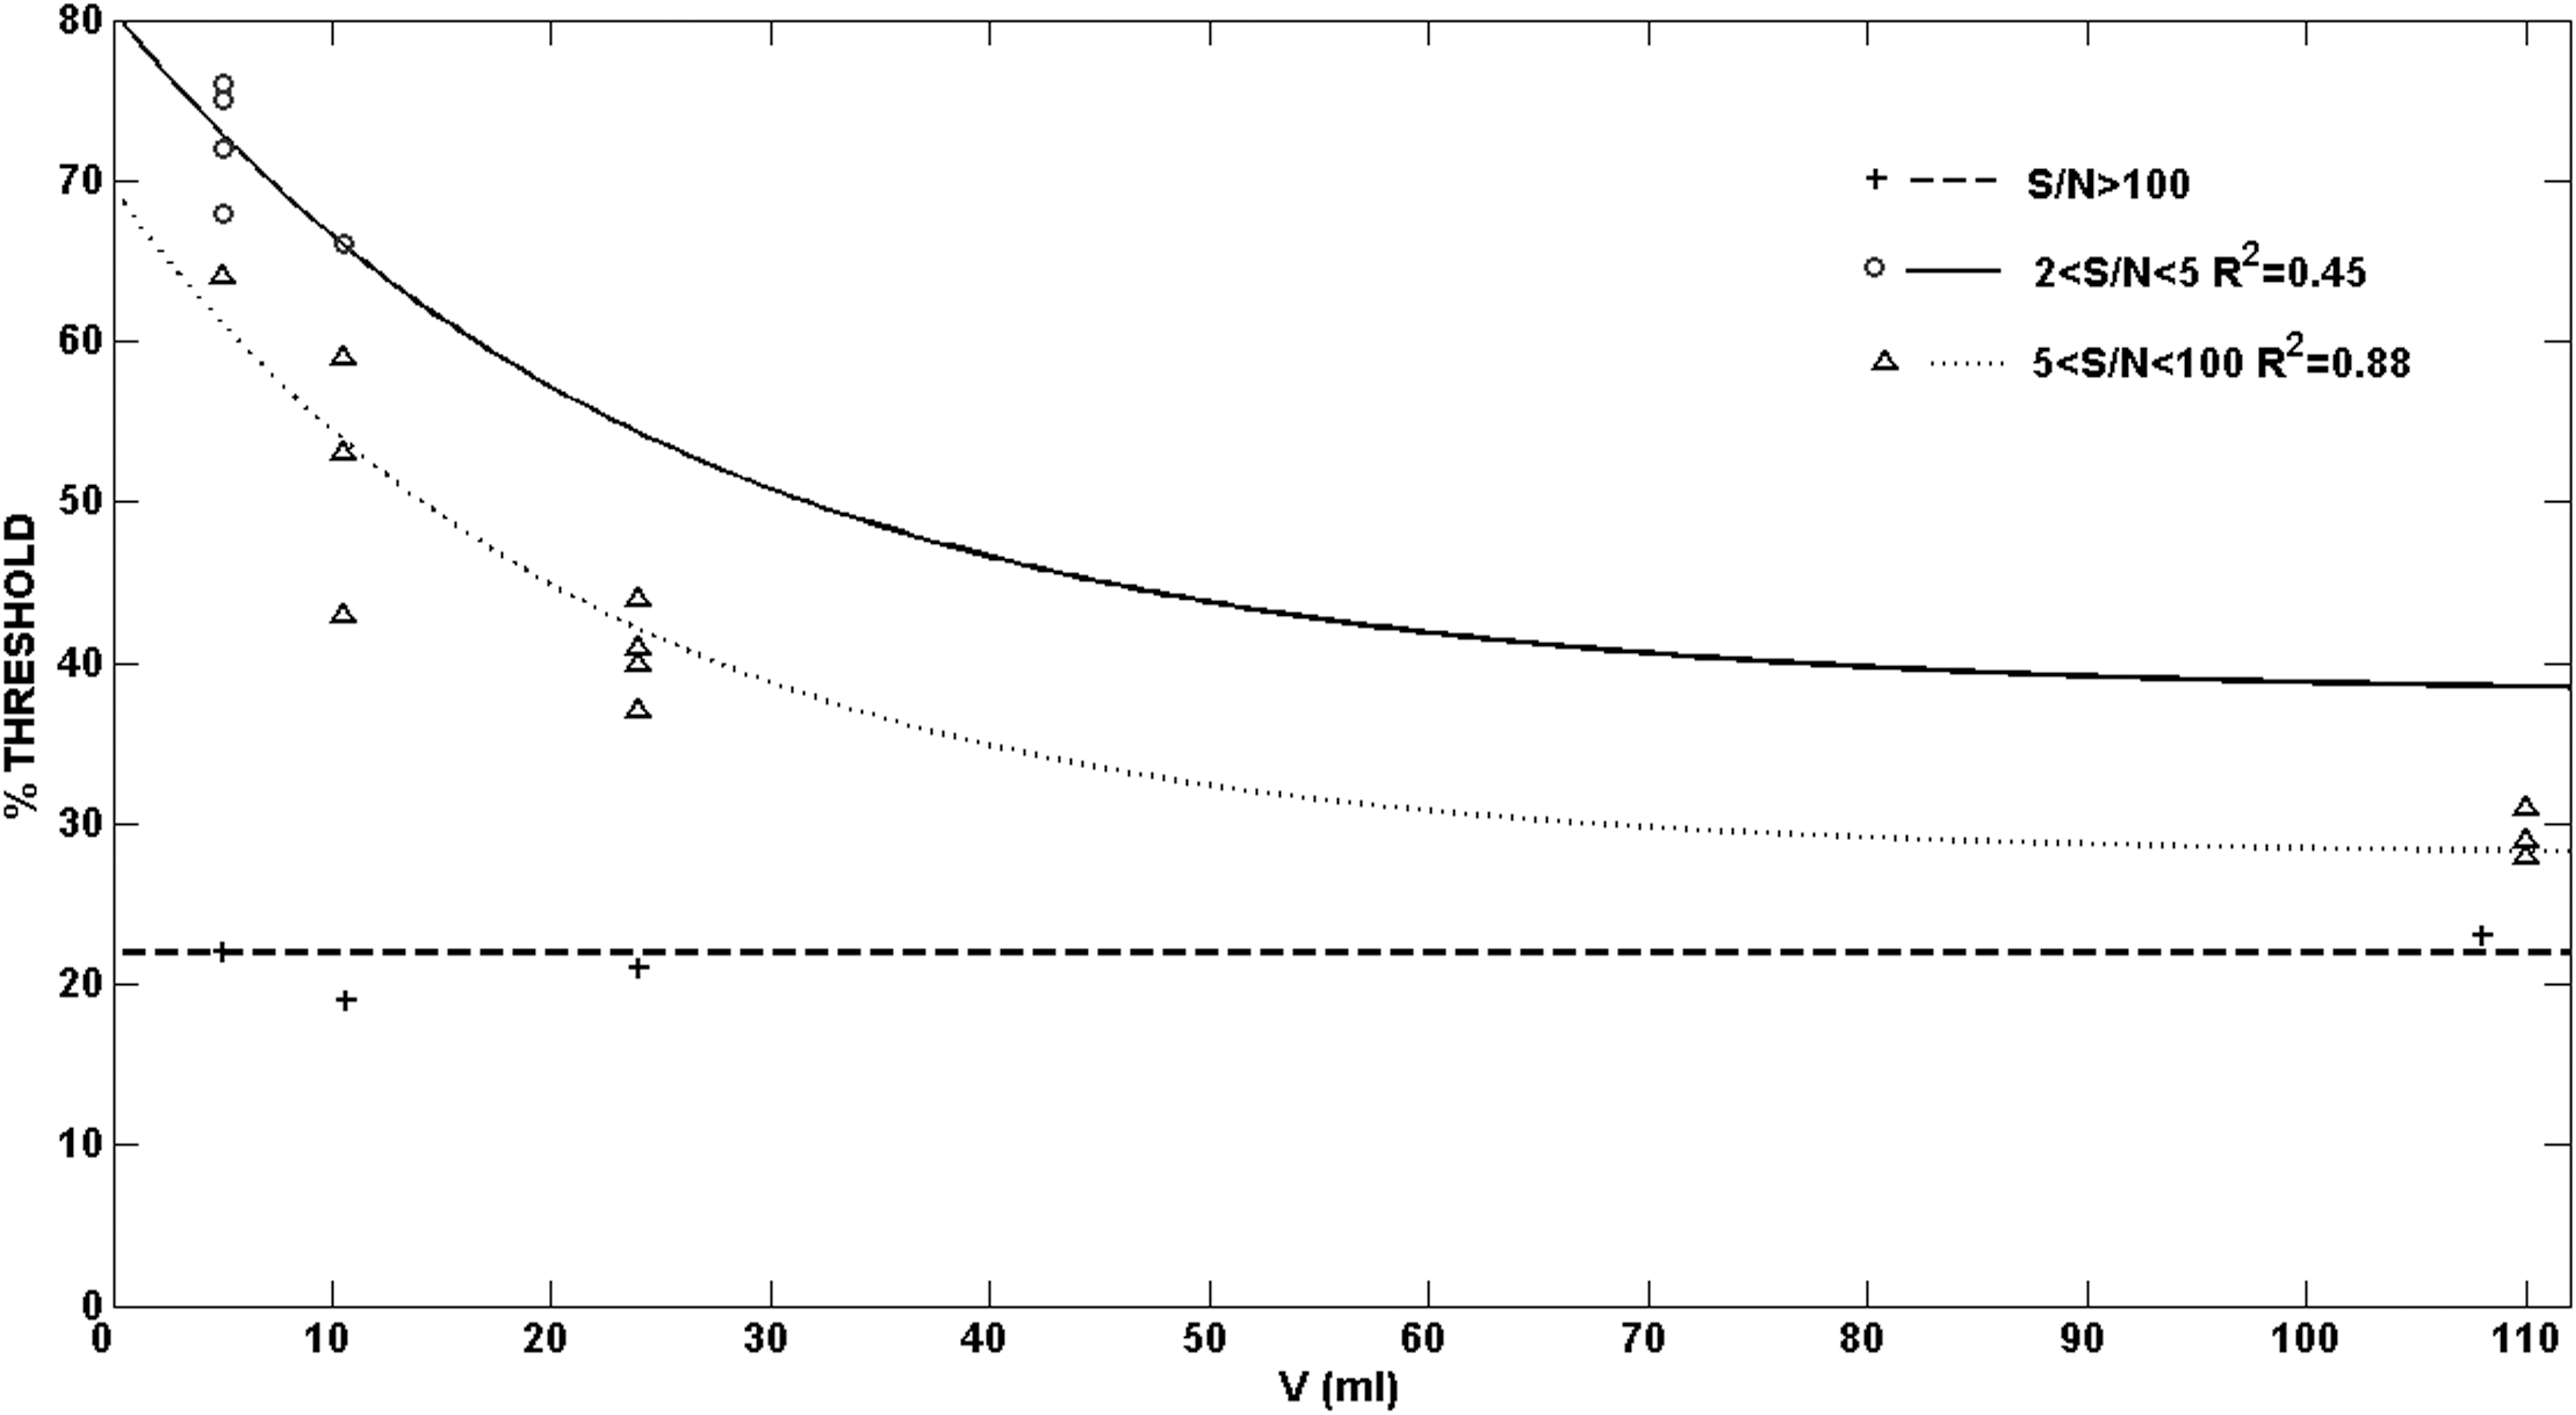
S/N-threshold-volume curves determined with phantom study at varying S/N (S/N>100—dashed line, 2<S/N<5—solid line, 5<S/N<100—dot-dashed line). The adopted model is formed by an exponential decreasing function and an adaptive term depending on S/N: Threshold (%)=exp(b–c*V)+D%, where b, c, D% are constant.
where b, c, D% are constants.
b and c were equal to 4 and 0.05 respectively, if 3<S/N<100.
D% was equal to 38% and 28% correspondingly, when 3<S/N<5 and 5<S/N<100.
In the presence of S/N>100 the segmentation threshold was nearly independent from the volume and it was assumed equal to 21% according to the mean of the obtained segmentation thresholding values (Fig. 5).
The results of the segmentation thresholding study in preclinical tests have been adopted in the contouring of the tumor target volume for patients 1, 2, and 3 (Fig. 6).
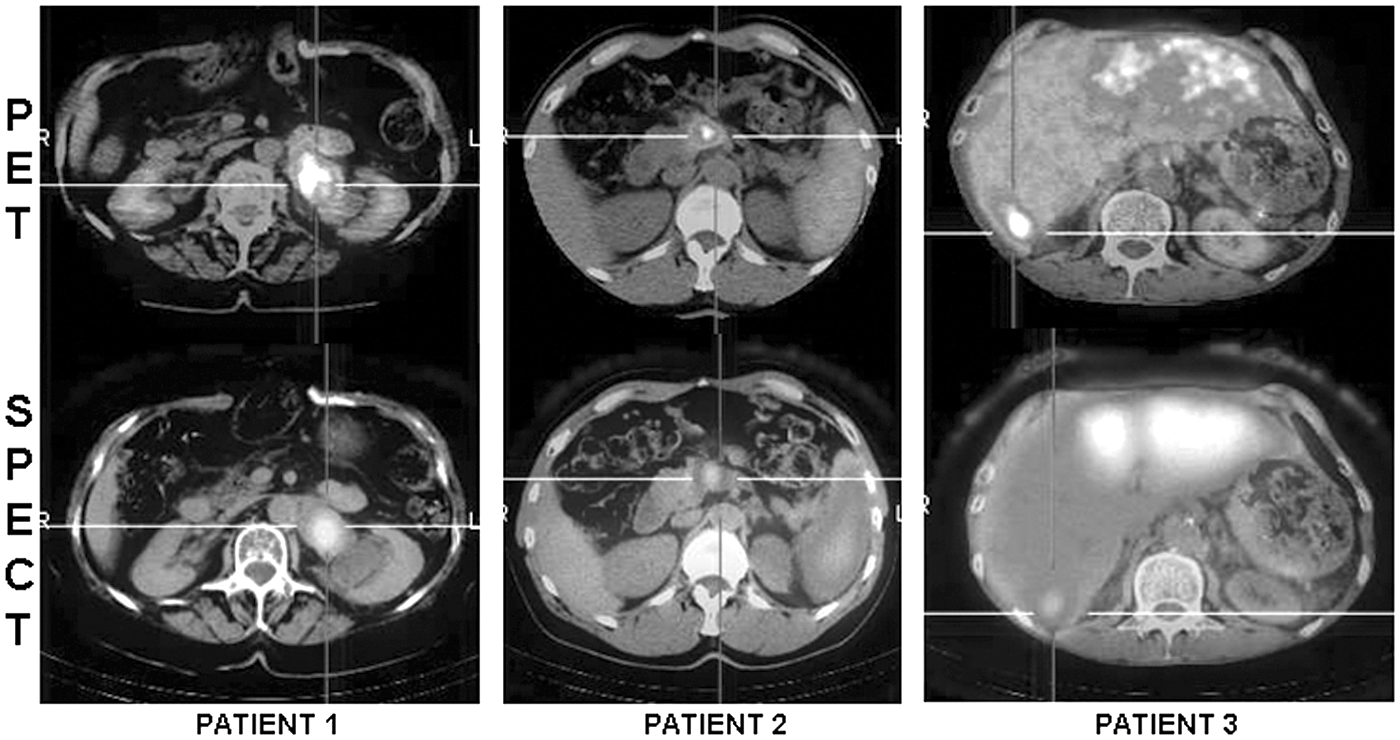
90Y PET/CT (first line) and SPECT/CT (second line) imaging of three patients after administration of peptide receptor radionuclide therapy (PRRT). SPECT/CT and PET/CT scans were acquired at 4 and 6 h p.i., respectively. Patient 1, injected with 1424 MBq of 90Y-DOTATATE (second cycle), shows a consistent accumulation of activity in the suprarenal lesion. Patient 2, suffering from inoperable pancreatic tumor, was administered with 2834 MBq of 90Y-PRRT (seventh cycle). Patient 3, at his eighth cycle of PRRT (1426 MBq), presents wide areas of radiopharmaceutical uptake within the liver at the level of the third and fourth hepatic segment.
Patient study and targets dosimetry
Table 2 shows the values resulting from the quantitative study on 90Y post-therapy imaging of three patients. It reports, respectively: S/N, the segmentation thresholds adopted to identify the “real” volume of the targets, the volume of the targets known by the CT scan, the AC within the targets, assessed by isovolume-RC based correction, and the CNR.
A perfect correspondence between the threshold determined by the segmentation method study during phantom tests and the tumor volume identified by diagnostic CT was found in patient 1 (Table 2). Conversely, an incoherent segmentation threshold with regard to the phantom study was applied for the identification of the true target volume in patient 2.
The explanation of this incoherency could be identifiable with a real heterogeneity of activity distribution within the tumor; hence, the adaptive thresholding segmentation method is based on the hypothesis of uniform AC in the target.
Finally, an increased segmentation threshold value compared with the value of the fitting was chosen for the contouring of the lesion of patient 3. In this case, only an area with highest uptake was drawn inside the metastatic regions of the liver.
Figure 6 (column 1) reports 90Y-PET/CT and SPECT/CT imaging of a 76-year- old patient after infusion of the two cycle of 90Y-DOTATATE (1428 MBq). A consistent accumulation of radioactivity (1.9 MBq/mL) was registered in the target lesion and reported in Table 2, while a very lower AC (0.3 MBq/mL) was found in the kidney, where the CNR value was still higher than the detectability limit.
Second column (Fig. 6) shows the 90Y-PET/CT and SPECT/CT imaging after the seven cycle (2834 MBq) of PRRT of a 47-year-old male patient who suffered from inoperable pancreatic neuroendocrine tumor.
Very high AC (3.2 MBq/mL) and CNR value (117) were registered within the target, while low AC (0.1 MBq/mL) was found in the kidney, where the CNR was equal to 4.
Column 3 (Fig. 6) depicts the post-therapy imaging of a 65-year-old patient enrolled in MRT to reduce the liver metastatic disease. Both images showed the activity distribution in the metastatic tissue of the liver after the 8° cycle (1426 MBq) of PRRT. In this case, the limit of the detectability was still enriched (CNR=17) when the AC was equal to 0.5 MBq/mL and S/N=8.
Finally, Table 3 describes the mean absorbed doses and the percentage differences calculated by PET and SPECT imaging quantification relative to tumors and kidneys (patient 1 and 2).
The kidney absorbed dose evaluation was assessed for patient 1 only, since in patient 2 the AC was lower than the detectable limit.
The absorbed dose values for the lesions with a high AC (Table 2) showed percentage differences equal to 2.5% and 8.6% for patient 1 and patient 2, respectively. Higher difference (−10.3%) was registered in the kidney absorbed dose (patient 1).
Analysis of 3D AC distribution in spherical sources and in clinical targets for quantifying tumor heterogeneity
The evaluation of the homogeneity of the spheres filled with uniform AC carried out a very high variability of FSD ranging from 0.1 to 0.4 (Fig. 7) due to statistical noise, iterative reconstruction, imperfect attenuation and scatter correction method, and PVE in the images.

Plot of the percent threshold required to obtain the known volume of the phantom radioactive spheres against the measured fractional standard deviation (FSD) of each volume. An exponential function y=a*exp(-b*x) is an excellent fit for the data (a=94.88, b=4.17, R2=0.93).
Figure 7 illustrates the strong inverse relationship between the FSD values relative to the VOI of the radioactive spheres and the percent isovolume segmentation thresholds required to identify the known volume of the spheres.
The phantom measurements pointed out that an exponential function (y=a*exp(-b*x)), whose equation and R2 are shown in Figure 7, is an excellent fit for the data.
High values of FSD involve adopting very low segmentation thresholds to recognize the real volume of the sources. 25
Furthermore, the Skewness assumed values lower than 0 and ranging from 0 to 0.5 when the radioactive sphere (V=110 mL) was located outside and inside the phantom, respectively and with an AC>0.5 MBq/mL (Fig. 8). Skewness values ranging from 0 to 1.2 were found also in clinical cases (V>40 mL) according to the data reported from Aristophanus. 24
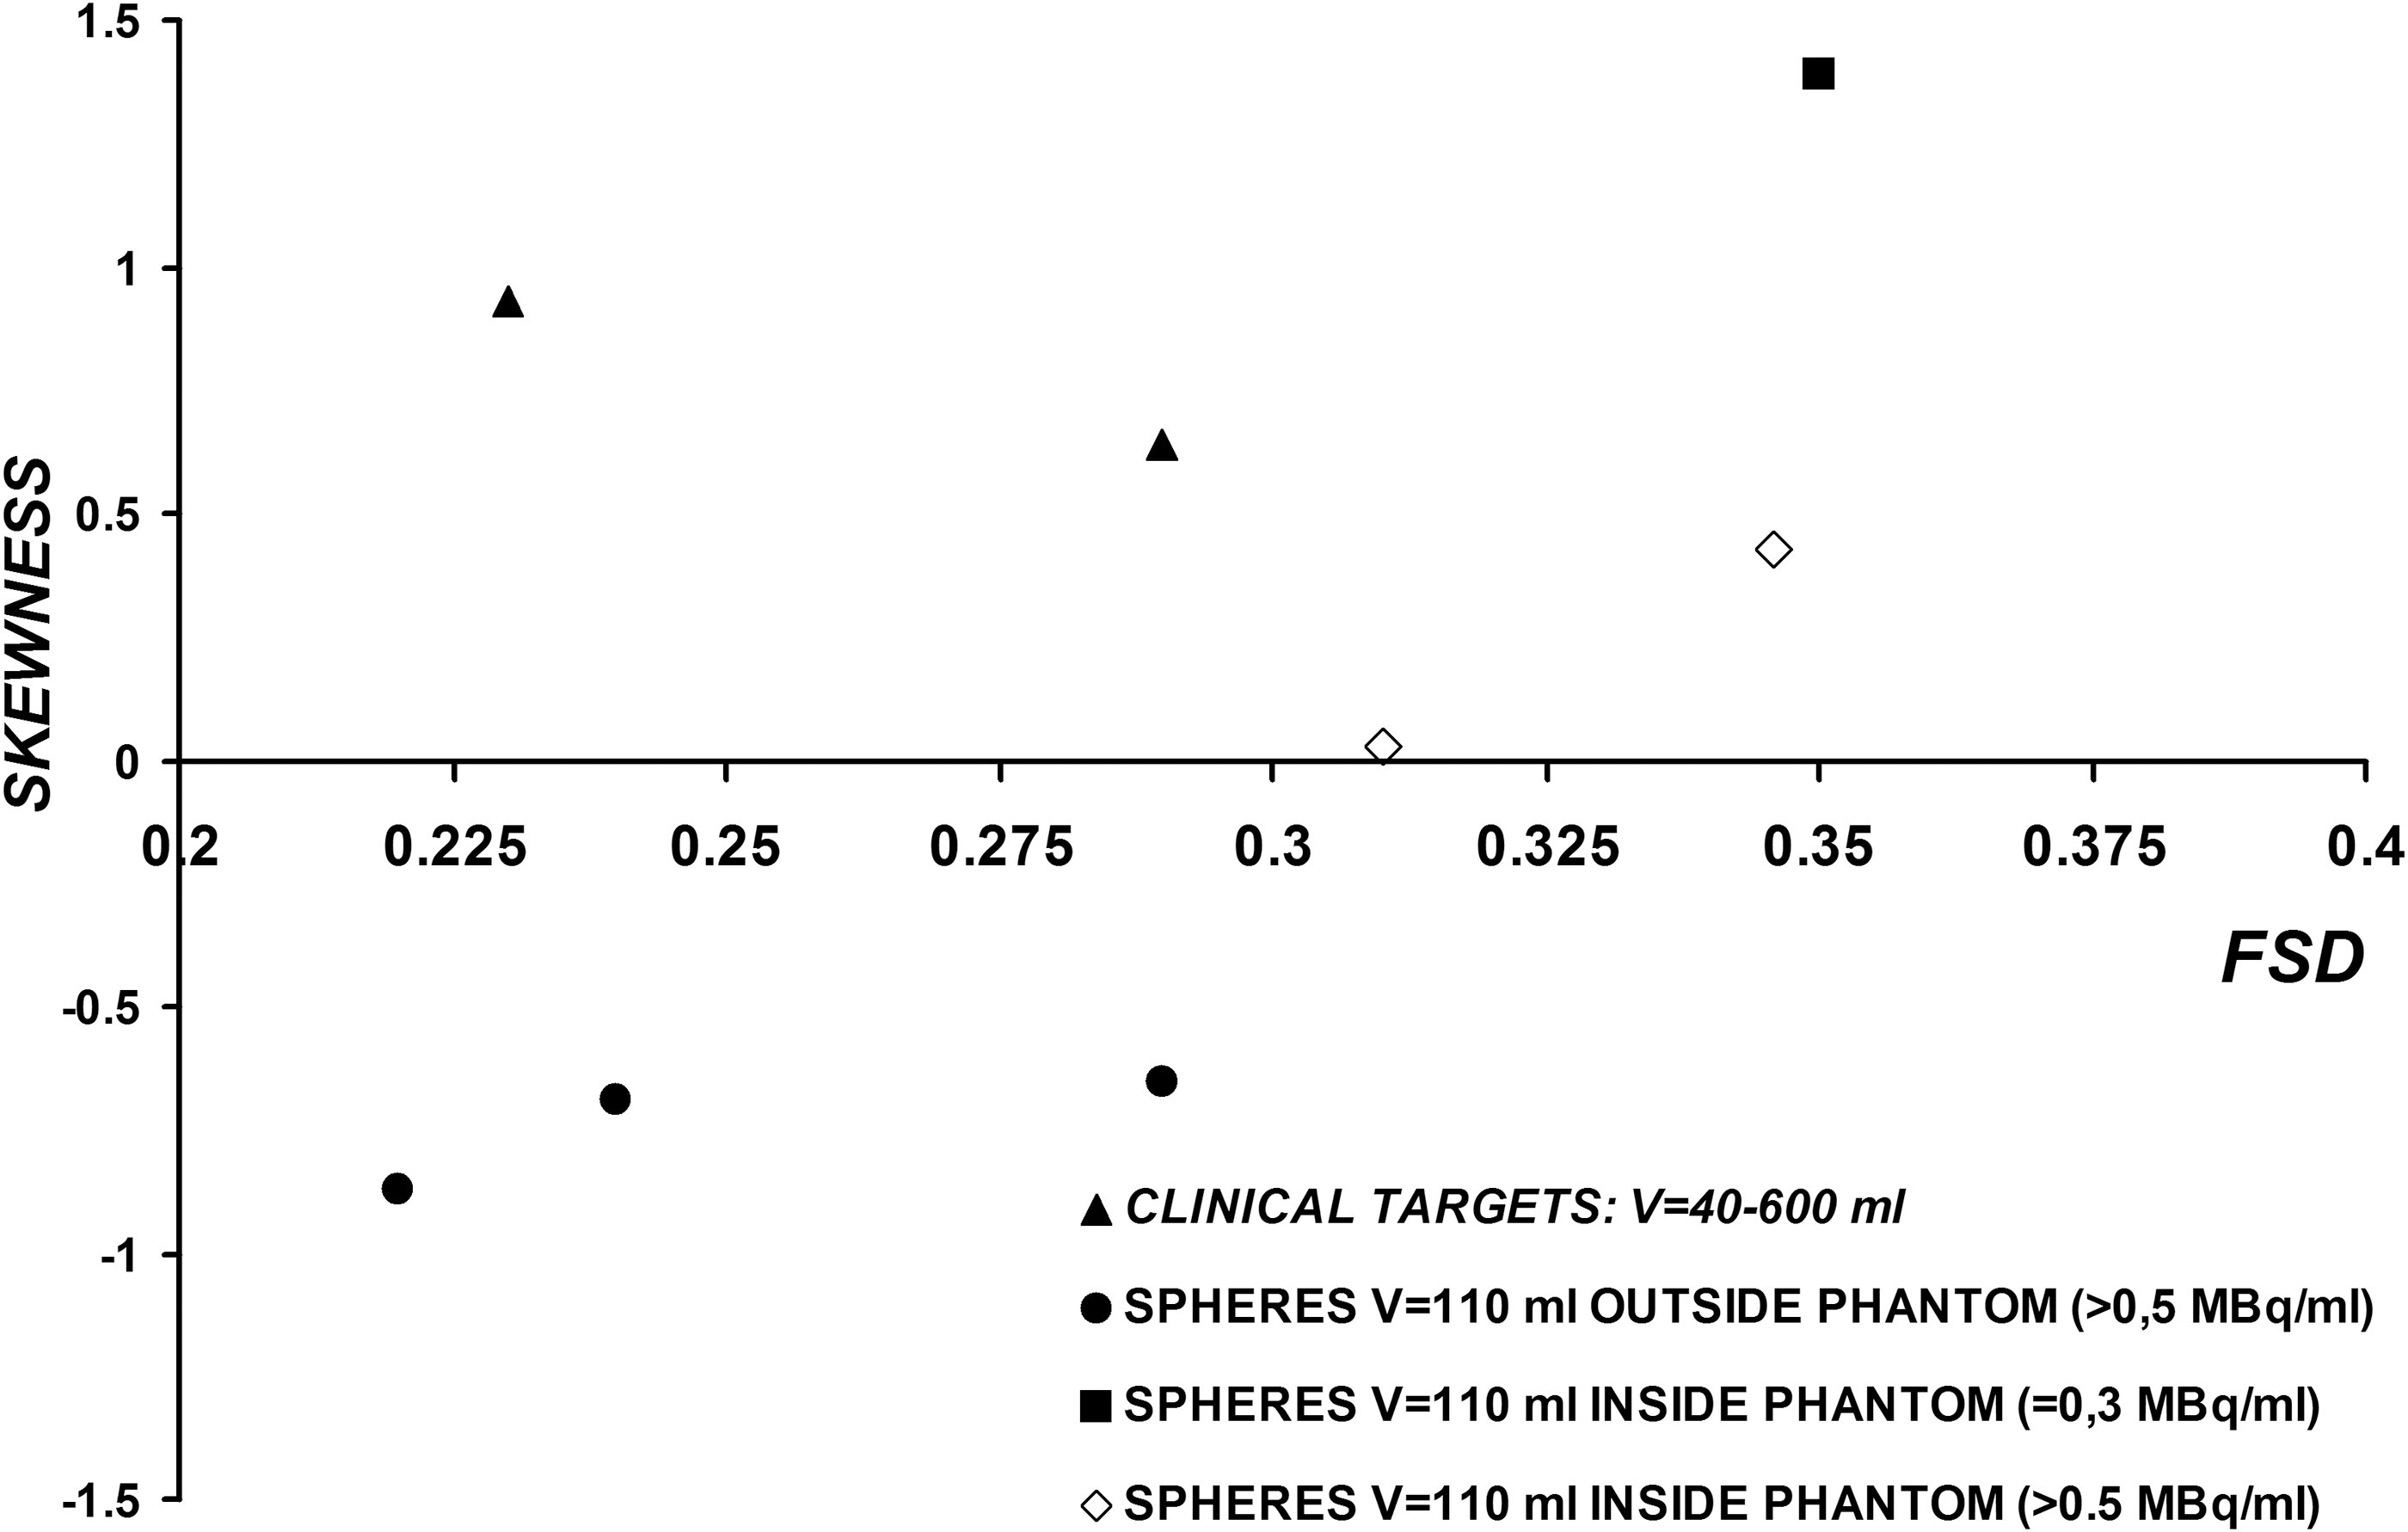
Plot of Skewness versus FSD based on cluster volume of interest (VOIs) in radioactive spheres and clinical targets. Four series of data were reported in the figure: (▲) volume targets in patients; (●) spheres outside the phantom with activity concentration (AC)>0.5 MBq/mL; (■) sphere inside the phantom with AC=0.3 MBq/mL and (◊) spheres inside the phantom with AC>0.5 MBq/mL.
Finally, the Kurtosis resulted lower than 1.5, if the sphere was located outside the phantom, while it ranged from 1.5 and 3 and equal to 3 when the source with an AC>0.5 MBq/mL was placed inside the phantom and in clinical targets, respectively (Fig. 9).
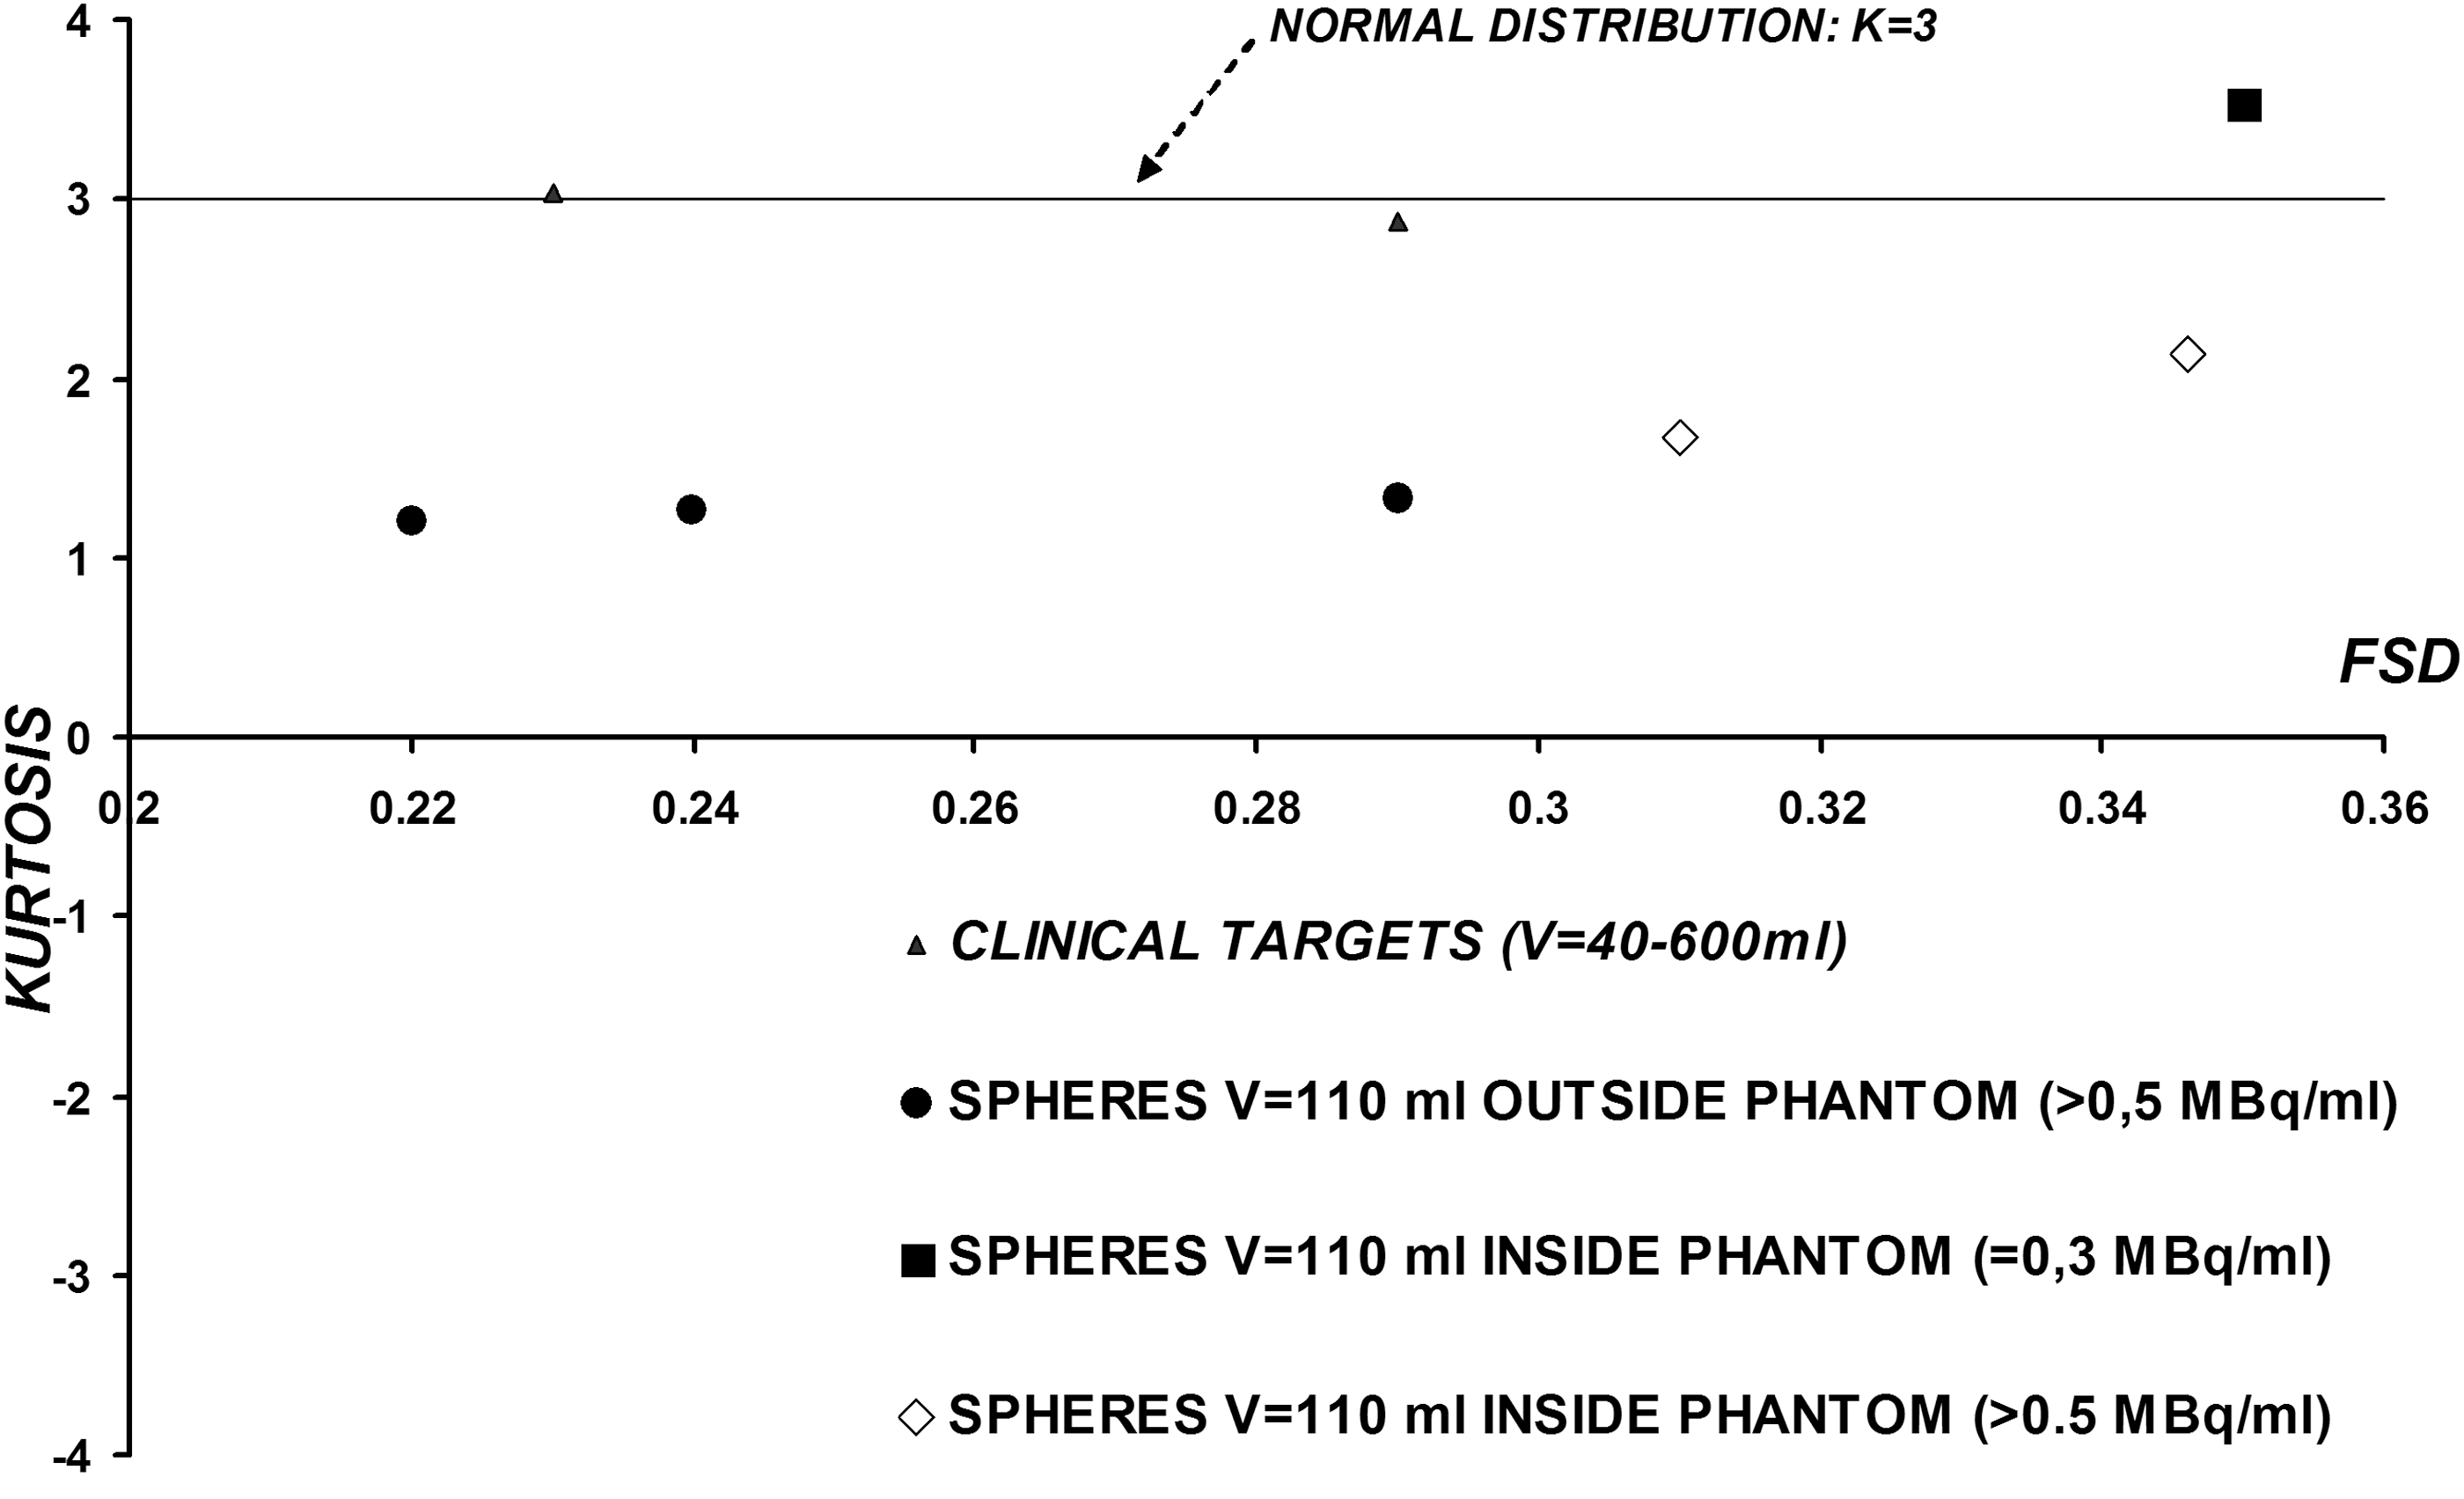
Plot of Kurtosis versus FSD based on cluster VOIs in radioactive spheres and clinical targets. Four series of data were reported in the figure: (▲) volume targets in patients; (●) spheres outside the phantom with AC>0.5 MBq/mL; (■) sphere inside the phantom with AC=0.3 MBq/mL and (◊) spheres inside the phantom with AC>0.5 MBq/mL. For a normal distribution kurtosis is equal to 3 (solid line).
The statistical analysis relative to the volumes lower than 40 mL did not show significant differences in terms of SK(I) and K(I) between the spherical sources filled with uniform AC located inside the phantom and the clinical targets.
Conclusions
90Y-PET/CT imaging quantification based on the hypothesis of an uniform AC within the targets was carried out in phantom tests and in clinical studies in the presence of an MDA concentration equal to 0.2 MBq/mL (NO BKG) and 0.5–0.7 MBq/mL with S/N ranging from 3 to 6.
Isovolume-RCs curve was applied to correct the PVE in the presence of different S/N and adaptive segmentation threshold curves were adopted for the identification of the real volume of the targets.
The dosimetric verifications relative to the analyzed images of the patients confirmed the suitability of the planning treatment for the targets.
The texture analysis showed that it is not possible to recognize real heterogeneity in the clinical targets if the FSD assumes value up to 0.4.
Nevertheless, a higher spatial resolution, if compared with 90Y-Bremsstrahlung SPECT/CT imaging, could be exploited to better define the metabolic changing of the lesion during therapy.
Further clinical cases are necessary to verify the real possibility to use the 90Y-PET/CT acquisitions in the management of the patients during 90Y-PRRT.
Footnotes
Acknowledgment
We thank Valia della Valle for the editorial revision of the article.
Disclosure Statement
No competing financial interests exist.
References
Supplementary Material
Please find the following supplemental material available below.
For Open Access articles published under a Creative Commons License, all supplemental material carries the same license as the article it is associated with.
For non-Open Access articles published, all supplemental material carries a non-exclusive license, and permission requests for re-use of supplemental material or any part of supplemental material shall be sent directly to the copyright owner as specified in the copyright notice associated with the article.