
Abstract
Pancreatic cancer is one of the leading causes of cancer-related death in the United States. Gemcitabine is a common treatment, but response rates are low, perhaps due in part to tumor hypoxia. We utilized 14C-labeled gemcitabine to map distribution of the drug with respect to perfused and hypoxic regions of the tumor microenvironment in two orthotopic xenograft models of pancreatic cancer. There was only a slight reduction in gemcitabine in hypoxic areas, with ∼78% of the drug present in hypoxic compared to perfused areas. In addition, only a 4% reduction in gemcitabine was measured at >100 μm from perfused blood vessels. Thus, despite significant areas of hypoxia in these tumors, gemcitabine distribution is relatively homogenous. Ours is the first study to directly measure gemcitabine distribution within tumor tissue, demonstrating that in these models, tumor tissue does not represent a barrier to gemcitabine penetration.
Introduction
Pancreatic cancer is the fourth-leading cause of cancer-related death in the United States, with a 5% survival rate at 5 years. 1 The primary tumor is usually nonresectable at the time of diagnosis, and gemcitabine is frequently given as a first-line therapy in these patients. However, response rates are low, with a 1 year survival rate of only 18% for locally advanced pancreatic cancer. A clinical response to gemcitabine is only seen in 24% of patients with advanced pancreatic cancer. 2 In addition, gemcitabine is the only approved single agent for metastatic disease, where it has a median survival time of just under 6 months. 3
One factor that has been increasingly proposed to correlate with metastatic potential and poor prognosis in pancreatic cancer is hypoxia. The relationship between tumor hypoxia, metastases, and clinical prognosis is currently under investigation. 4 Direct intraoperative measurements have confirmed that significant hypoxia is common in human pancreatic tumors, 5 and this is a feature that has been reproduced in orthotopic mouse models of disease. 6 As it is well established that hypoxia reduces the efficacy of both radiation therapy and chemotherapy in a variety of cancers, 7 it is logical to assume that it may be compromising chemotherapy for pancreatic disease.
There are at least two mechanisms by which tumor hypoxia may promote resistance to gemcitabine. As gemcitabine is a cytidine analog that targets dividing cells, 8 hypoxic cells, which are presumably not proliferating, would likely be protected. Another possible problem is drug delivery, as pancreatic tumors are often poorly vascularized with areas of dense, fibrotic stroma, 9 and hypoxia arises in tissue that is distant from blood vessels. Therefore, it is possible that therapeutic concentrations of gemcitabine may not actually reach the hypoxic areas of the tumor. To differentiate these possibilities and prioritize them as therapeutic targets, it is necessary to understand how gemcitabine is distributed throughout the microenvironment of pancreatic tumors.
We have used radiolabeled gemcitabine to directly measure drug distribution within the tumor microenvironment in two xenografted orthotopic models of pancreatic cancer. This has allowed us to relate the distribution of gemcitabine to perfused vessels and areas of hypoxia. We hypothesized that gemcitabine distribution would be heterogeneous, with a significant reduction in the concentration of gemcitabine in hypoxic regions when compared to perfused regions.
Materials and Methods
Cell culture and gemcitabine uptake in vitro
AsPC1 and Capan-1 cells were obtained from American Type Culture Collection (Manassass, VA), and cultured as recommended. For uptake experiments, cells were grown in 24-well plates. Hypoxia was induced in cell cultures using a hypoxia workstation (InVivo 400; Baker Ruskinn, Sanford, ME), delivering 0.1% O2, 5% CO2, in N2 at 37°C. 3H gemcitabine, specific activity of 12 Ci/mmol was purchased from Moravek Biochemicals (Brea, CA).
Cells were incubated under hypoxia for 24 hours, before being labeled with 3H gemcitabine (0.2 μCi/mL in a total volume of 1 mL), and solubilized with 1% sodium dodecyl sulfate, 0.3% sodium hydroxide. Samples were counted on a PerkinElmer Tricarb liquid scintillation counter (PerkinElmer, Waltham, MA). Parallel wells were set up to allow cell numbers to be established. For this, wells were trypsinized and cells counted by hemocytometer.
Animals
Six- to 8-week-old female athymic nude mice (Hsd:Athymic Nude-Foxn1nu ) were obtained from Harlan Laboratories (Indianapolis, IN). Animals were maintained in accordance with the Guide for the Care and Use of Laboratory Animals in an AAALAC-accredited facility. All procedures were approved by the Memorial Sloan Kettering Cancer Center IACUC.
Orthotopic tumor implantation
Animals were acclimated after arrival in the facility for at least 3 days before surgery. The animals were anesthetized with inhaled isoflurane to effect, and carprofen (5 mg/kg subcutaneously) was given for pre-emptive analgesia. A left flank incision was made into the peritoneal cavity, and the spleen identified and gently retracted to expose the pancreas. Approximately 106 AsPC1 or Capan-1 tumor cells in 50% Matrigel (BD Biosciences, Franklin Lakes, NJ) were injected into the pancreatic parenchyma (volume=30 μL). Routine two-layer closure was performed with absorbable suture in the muscle and wound clips to appose skin edges.
Tracer administration
Experiments were conducted when tumors reached ∼1 cm in diameter, as measured by ultrasound (Vevo2100; FujiFilm VisualSonics, Inc., Toronto, Canada), corresponding to 3–4 weeks following tumor implantation for AsPC1 tumors and ∼6 weeks for Capan-1 tumors. 14C-gemcitabine (specific activity 58.8 mCi/mmol; Moravek Biochemicals) was administered at 5 μCi/animal. Pimonidazole (Hypoxyprobe; H&I, Inc., Burlington, MA) was given at 100 mg/kg. Both agents were administered in sterile saline by intraperitoneal (IP) injection. Hoechst 33342 (100 mg/kg, 200 μL; Sigma, St. Louis, MO) was intravenously given in the lateral tail vein 1–5 minutes before sacrifice. Animals were euthanized via CO2 overdose, and tumors were harvested and processed within 30 minutes of sacrifice.
Tissue processing and image acquisition
Tumor tissues were frozen in Tissue-Tek embedding medium (Sakura Finetek USA, Torrance, CA) and sectioned to a 10 μm thickness on a cryotome. Tumors were sectioned at four depths, each separated by ∼1 mm. Autoradiographs of tumor sections were exposed for 7 days and read with the Typhoon FLA 7000 laser scanner (GE Healthcare Life Sciences, Pittsburgh, PA). Before exposure, slides were marked with clear nail polish containing 14C and Hoechst 33342 to serve as fiduciary markers for registration of autoradiographic and microscopic images. The absolute amount of activity in tumor sections was quantified by use of 14C standards (ARC, St. Louis, MO) in terms of μCi/g. A subset of tumor sections was washed in phosphate-buffered saline (PBS) after autoradiography, and a second exposure was performed. Immunofluorescent microscopic images were obtained using an Olympus BX60 microscope and Microsuite Biological Suite imaging software (Olympus America, Center Valley, PA). Hoechst 33342 images were captured before fixation and pimonidazole staining. Slides were then fixed for 30 minutes in cold methanol, blocked in 10% goat serum, 10% bovine serum albumin in PBS for 1 hour followed by FITC conjugated antipimonidazole antibody (H&I, Inc.) diluted 1:20 in blocking solution for 1 hour. Slides were rinsed in PBS, air-dried, and imaged for pimonidazole as described above.
To verify gemcitabine was active in AsPC1 tumors, tumor-bearing animals were treated with 50 mg/kg gemcitabine IP and sacrificed 6 hours later. 0.5 mg 5-ethynyl-2-deoxyuridine (EdU; Invitrogen, Eugene, OR) was administered IP 1 hour before sacrifice to stain for dividing cells. Control animals received EdU but no gemcitabine treatment. EdU-positive cells were imaged by click chemistry addition of Alexa Fluor 555 azide (Invitrogen), according to manufacturer's instructions.
Image analysis and statistics
Images were analyzed using ImageJ and Photoshop software (Adobe, San Jose, CA). For comparison of autoradiographic signal in hypoxic and nonhypoxic tissue, Hoechst, pimonidazole and 14C gemcitabine images were registered. Regions of interest (ROIs) were drawn on Hoechst-positive areas of tumor (blood vessels and adjacent tissue), and on pimonidazole-stained (hypoxic) tissue. The signal in the corresponding area of the autoradiograph was obtained using the ImageJ ROI manager. A total of 140 hypoxic ROIs and 168 vessel ROIs were analyzed, taken from four AsPC1 tumors cut at eight different depths (total, with a minimum of 1 mm separation, as described above). The change in 14C gemcitabine activity with distance from vessel was measured using Photoshop. Registered Hoechst and autoradiographic images were overlaid; Hoechst-images were binarized dividing the tumor section into regions that are well and poorly perfused. The positive pixels areas corresponding to vessels and the peri-vascular tissue were selected. The selected area was expanded and brightened. This procedure was iterated to yield zones as follows: all tissue within 20 μm of a perfused vessel; tissue between 20 and 60 μm from a perfused vessel; tissue between 60 and 100 μm from a perfused vessel; and tissue greater than 100 μm from a perfused vessel. The iterative brightening procedure resulted in each band being progressively darker, and the autoradiographic signal strength associated with each gray value was collected.
For EdU analysis, images were counted using ImageJ in a total of sixty-seven 20× fields. Three tumors per treatment group were examined, and each tumor was sectioned at three different depths, separated by 1 mm. Field area was normalized on the basis of DAPI staining to exclude necrotic portions. Statistics were calculated using a two-tailed t-test. To determine the 95% confidence interval on a ratio, Fieller's theorem was used, implemented by a web calculator supplied by GraphPad (San Diego, CA).
Results
Gemcitabine tumor tissue kinetics
To determine the appropriate time point for analyzing gemcitabine distribution, animals were injected with 1 μCi each of 14C gemcitabine and clearance of gemcitabine from the tumor tissue over time was established. Autoradiographs of tumors harvested 2 hours after 14C gemcitabine administration demonstrate that the drug is well-distributed throughout the tumor by this time (Fig. 1A). The amount of gemcitabine present in tumor tissue decreases in a relatively linear fashion from 2 hours postadministration to 24 hours postadministration, when it is indistinguishable from background levels of radiation (Fig. 1B). Mean 14C activity was 0.067 μCi/g tumor tissue at 2 hours, 0.042 μCi/g at 6 hours, and 0.028 μCi/g at 12 hours. 14C activity at 24 and 48 hours postadministration were indistinguishable from background levels. A subset of tumor sections harvested 2 hours postgemcitabine administration were washed in PBS and reexposed. There was no measurable 14C activity in any of the washed tumor sections (data not shown), suggesting that the amount of gemcitabine irreversibly trapped by incorporation into host DNA was an extremely small fraction of the total tissue concentration. This was surprising, given that gemcitabine toxicity is at least partly based on drug incorporation into DNA. However, gemcitabine was clearly active in AsPC1 tumors, as it repressed DNA synthesis as measured by EdU incorporation (Fig. 2). Based on these results, all subsequent experiments analyzing microdistribution were performed at 2 hours after gemcitabine administration.

Gemcitabine clearance from tumor tissue over time.
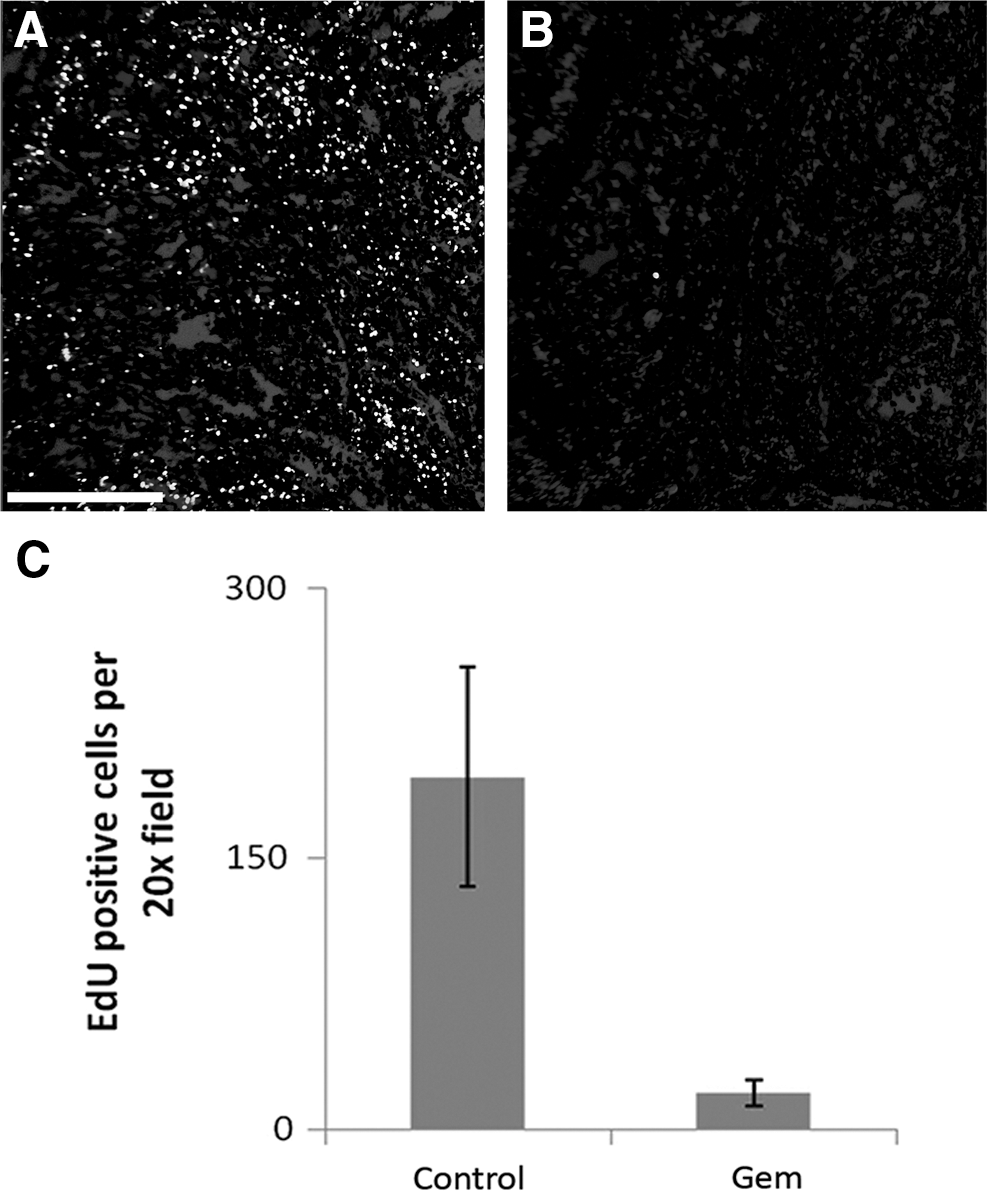
EdU-positive cells after gemcitabine (50 mg/kg) treatment.
Gemcitabine microdistribution
A representative immunofluorescent image of an AsPC1 tumor section stained for perfused vessels (Hoechst 33342, blue) and hypoxic areas (pimonidazole, green) is shown in Figure 3A. Figure 3B shows an autoradiograph of gemcitabine distribution for the same tumor section. There is a slight but significant reduction in 14C radioactivity in hypoxic areas with respect to perfused areas, indicating slightly less gemcitabine present in hypoxic compared with normoxic regions of the tumor. Activity in hypoxic regions is ∼78%±3% of activity in perfused regions (Fig. 3C). Although the difference in activity between vascularized and hypoxic tissue is slight, it is statistically significant. Nine tumor sections were analyzed from four separate AsPC1 tumors. For each section a minimum of 22 blood vessel ROIs were drawn, and 10–25 hypoxic ROIs, depending on the extent of the hypoxia. The p-values (hypoxia vs. vascularized) for each tumor range from 0.001 to 5×10⁻¹¹.
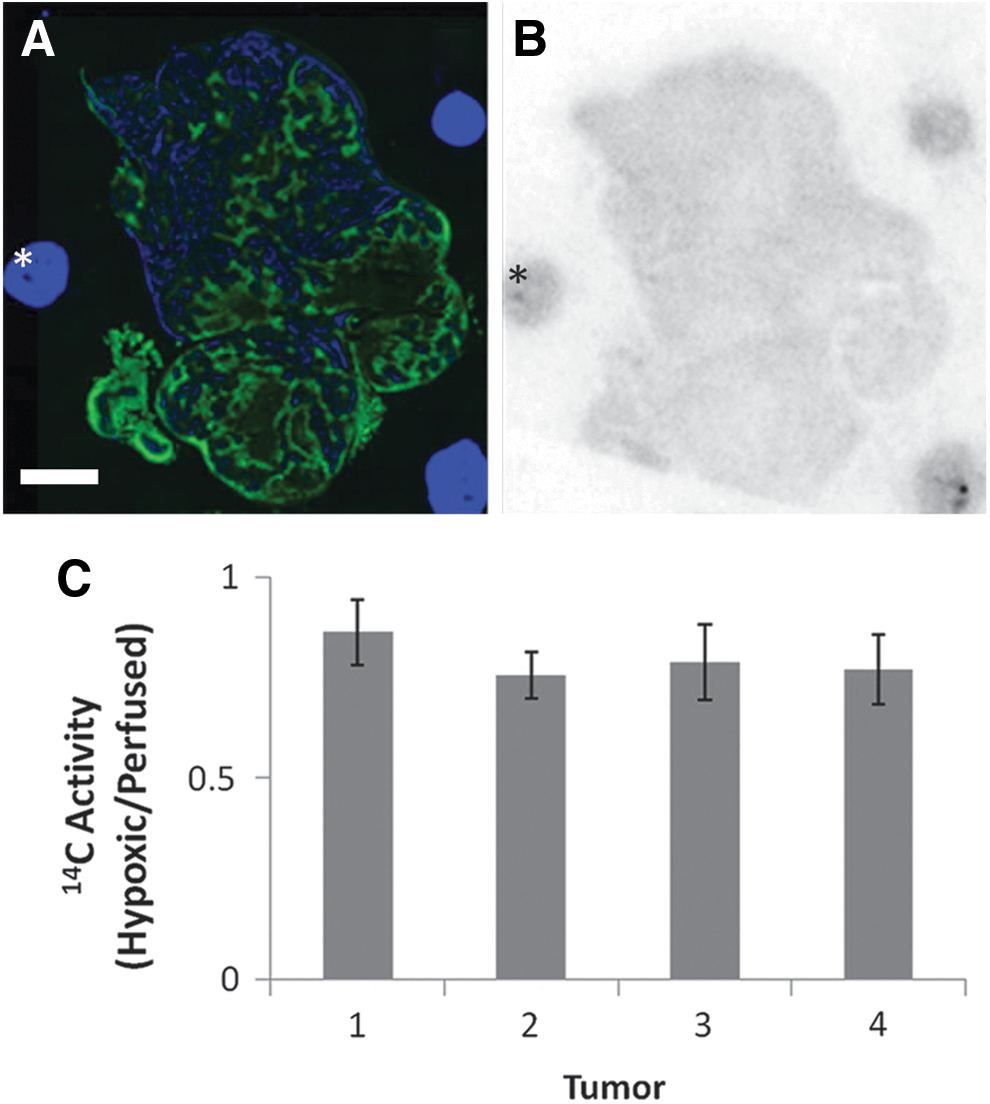
Quantitation of 14C gemcitabine relative to hypoxia.
We further examined how 14C activity was related to distance from perfused vessels. As illustrated in Figure 4, it is possible to use Photoshop to create bands at defined distances from the vessels and then analyze the autoradiographic activity associated with each band. This analysis was applied for the AsPC1 tumors and for a second line, Capan-1, also grown orthotopically. (The Capan-1 tumors we examined showed no apparent hypoxia, so pimonidazole analysis could not be performed.) As seen for AsPC1 in Figure 4E, 14C activity does not significantly decrease as distance from a perfused blood vessel increases, up to 100 μm from the vessel. Virtually identical results were obtained with Capan-1 tumors (Fig. 5), though in all the Capan-1 sections there were small hotspots where activity accumulated. These were neither highly perfused nor hypoxic, so the cause of the inhomogeneity, though obviously interesting, is beyond the scope of this report. The fact that there appeared to be no decrease in gemcitabine with distance from the blood vessel is in some disagreement with the slight, but significant reduction in gemcitabine in hypoxic tissue. This may be due to hypoxic tissue accumulating less gemcitabine, rather than drug delivery.
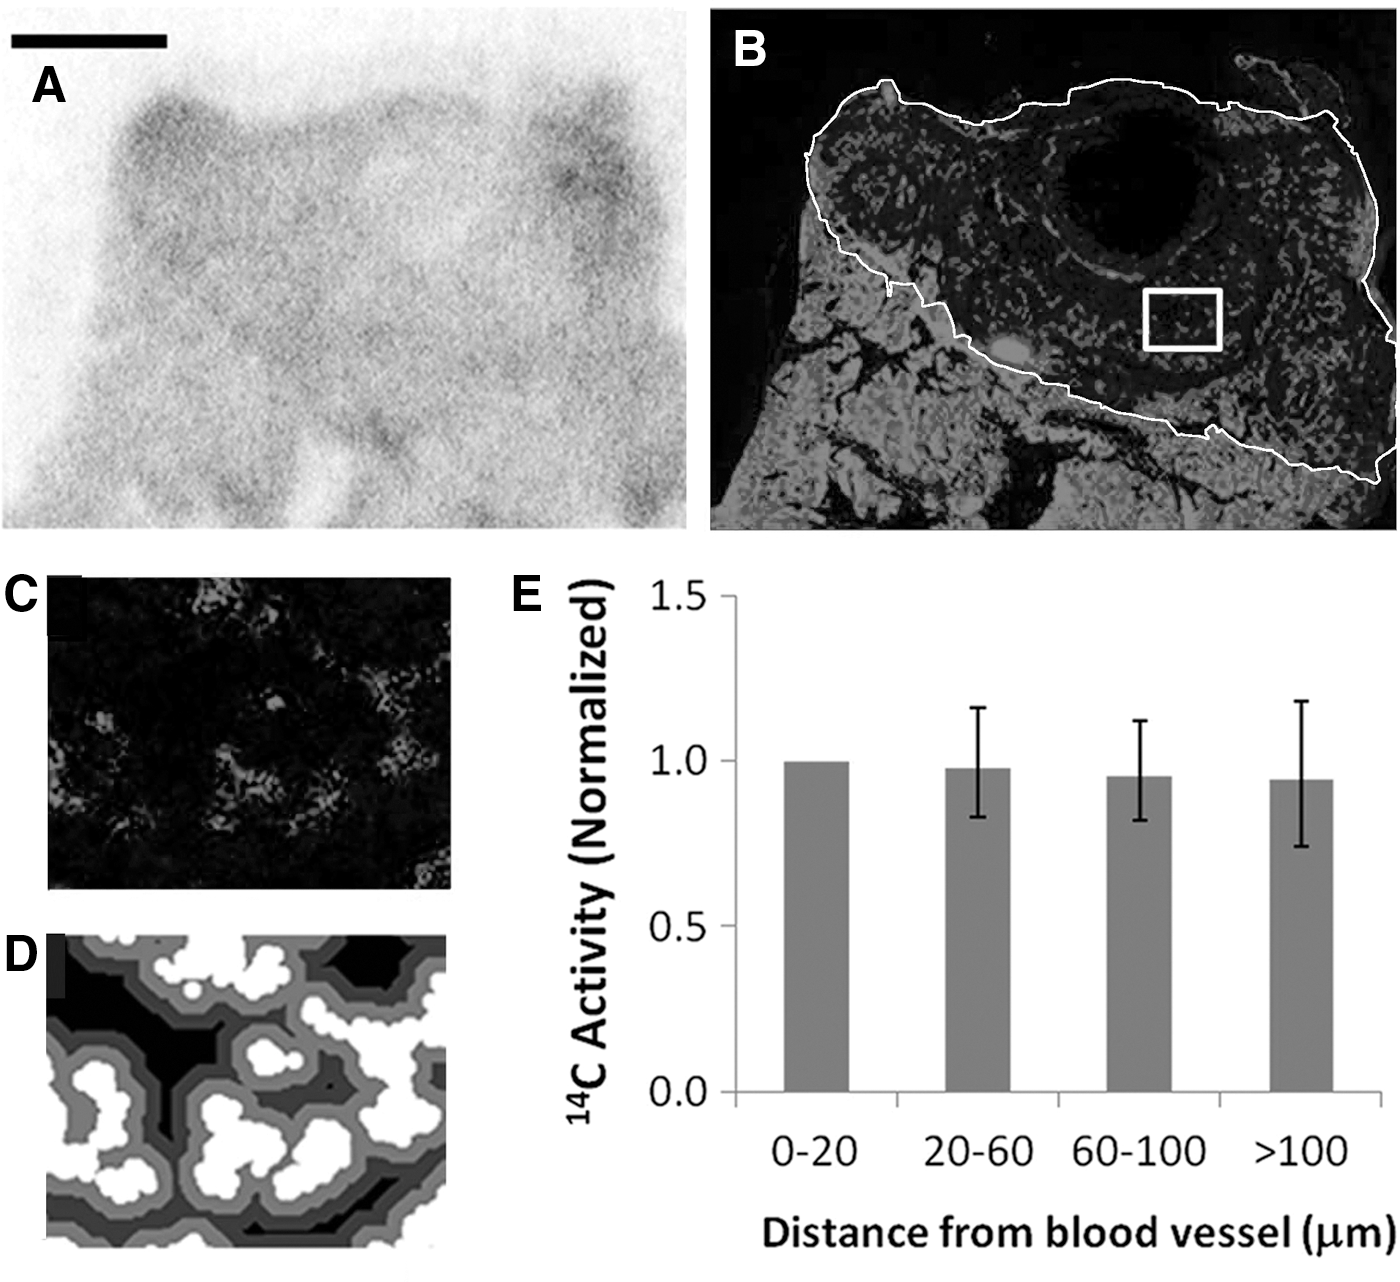
Quantitation of 14C gemcitabine relative to blood vessels.

Quantitation of 14C gemcitabine relative to blood vessels.
Gemcitabine uptake in hypoxic cells
To test this hypothesis, we exposed AsPC1 cells to 0.1% O2 for 24 hours, and added 3H gemcitabine for 1 hour. The results are shown in Figure 6. Compared to cells in air, uptake in the chronically hypoxic cells was 60%, and this difference was highly significant (p=0.005, two-tailed t-test).

Effect of chronic hypoxia on gemcitabine uptake in vitro. Cells were made hypoxic for 24 hours before 3H gemcitabine administration. Cells were exposed for 1 hour. Uptake is expressed as a percent of the total activity in the well per million cells. Error bar represents 1 SD, n=3.
Discussion
We have shown that gemcitabine distribution is relatively homogenous in an orthotopic murine model of pancreatic adenocarcinoma. The drug does not localize solely in well-perfused areas, but is distributed to both hypoxic and normoxic regions. While there is a significant reduction of gemcitabine in hypoxic regions compared with perfused regions, the magnitude of this difference is much less than we expected; hypoxic regions contain about 80% of the drug that is found in normoxic regions. This is probably due to hypoxic cells having decreased uptake of gemcitabine, since there is virtually no decrease in the amount of gemcitabine present when the regions are analyzed by distance from a perfused blood vessel. While hypoxia appeared to have a larger effect on gemcitabine uptake in vitro than in vivo (60% vs. 80%), we have no knowledge of how hypoxic the cells in vivo were, nor how long they had been hypoxic.
Interestingly, Raykov et al. found that the angioarchitecture of orthotopic pancreatic adenocarcinoma in mice and rats was abnormal. 10 Though we did not specifically characterize the angioarchitecture of AsPC1 tumors, our results demonstrate that the vasculature was functional enough to permit effective drug delivery throughout the tumors. Thus, gemcitabine is able to pass freely through tumor tissue. This is not the case for all antineoplastics: for example, doxorubicin poorly diffuses through tumor spheroids and xenografts. 11 –13
To our knowledge, this is the first study to directly examine the tumor distribution of gemcitabine. The closest examination of the issue to date was by Huxham et al., 14 who observed gemcitabine-induced suppression of BrdU uptake relative to distance from blood vessels. They found that while gemcitabine suppressed cell division at all depths in the tumor, regrowth commenced at points distal from the vessel and spread gradually to perivascular regions. Having carefully excluded the possibility of oxygen-related effects, the authors interpreted this as evidence of a gemcitabine concentration gradient. However, inferring a drug concentration gradient from an effect gradient is problematic: one possibility is that cancer stem cell cells reside primarily in poorly vascularized regions and are more refractory to treatment. 15,16 Thus, we feel confident in the methodology outlined here, of direct visualization of drug distribution via autoradiography, and in our observation that gemcitabine is evenly distributed throughout the tumor.
In the context of pancreatic cancer, we need to emphasize the distinction between tumor tissue and normal stroma. Our results do not suggest that penetration through tumor tissue limits gemcitabine efficacy. However, in pancreatic tumors drugs face an additional barrier in the form of desmoplastic stroma, bands of extracellular matrix, and collagen that run through the tumor. These features are not found to any significant extent in the orthotopic models employed here. However, KPC mice, which have been genetically engineered to develop spontaneous pancreatic tumors have been shown to recapitulate the desmoplastic stroma seen in clinical specimens. 17 The results presented here do not address whether stroma (rather than tumor) represents a barrier to gemcitabine penetration, although there are several reports showing that antistromal agents enhance the effect of gemcitabine in KPC animals. 18,19 However, this is indirect evidence, which would be enhanced by autoradiographic studies of the sort performed here. Further, we note that gemcitabine is also approved for use in non small cell ovarian and breast cancer where the effect of pancreatic stroma is not relevant.
There is also the related issue of vascular density: unlike the orthotopic models used here, pancreatic cancer is known to be hypovascular. 20 Vessel density will affect total drug uptake, though paradoxically reduced vascularity can result in increased drug uptake. 21 However, our central finding is the absence of a drug concentration gradient from perfused vessels, and we would predict that this finding should be independent of vessel density. However, we note that drug concentration gradients might be generated in tumors if the constituent cells have an especially rapid uptake of gemcitabine.
Another micro-environmental concern is hypoxia: while hypoxic tissue accumulated gemcitabine, there is no guarantee that hypoxic cells are susceptible to gemcitabine toxicity. However, resolving this issue will be complex, particularly quantifying the relative levels of cell kill in hypoxic and oxygenated components of the tumor.
Because of the low clinical efficacy of gemcitabine monotherapy and the advanced stage at which most pancreatic cancer patients are diagnosed, radiation therapy is often added to gemcitabine therapy in patients. Our study can also inform orthotopic murine chemoradiation pancreatic cancer models because we have documented the tumor tissue kinetics of gemcitabine in these tumors. Gemcitabine is rapidly distributed throughout the tumor by 2 hours postadministration and falls significantly by 6 hours postadministration. Levels of gemcitabine are undetectable in tumor tissue by 24 hours postadministration. In addition, there is no evidence of incorporation into the DNA in these tumor models. Any murine study investigating the radiosensitizing effects of gemcitabine must take this rapid clearance into account.
Conclusion
Gemcitabine uptake is rapid and almost uniform throughout the pancreatic tumor model within 2 hour postintravenous injection. Clearance is rapid, with gemcitabine falling to imperceptible levels within 24 hours postadministration. We have demonstrated that gemcitabine distribution is nearly homogenous throughout the tumor in an orthotopic murine model of pancreatic cancer. Gemcitabine localization in tumor hypoxic subregions is only about 20% lower than in well-perfused regions of the tumor. Chemoresistance to gemcitabine does not appear to be a consequence of bioavailability, at least in this AsPC1 model.
Footnotes
Acknowledgments
This work was supported through internal funds, MSKCC Core Grant (P30 CA 008748), and Training Grant (R25-OD010447-02).
Disclosure Statement
No competing financial interests exist.