
Abstract
An α-particle irradiator, enabling high-precision irradiation of cells for in vitro studies, has been constructed. The irradiation source was a 241Am source, on which well inserts containing cancer cells growing in monolayer were placed. The total radioactivity, uniformity, and α-particle spectrum were determined by use of HPGe detector, Gafchromic™ dosimetry film, and PIPS® detector measurements, respectively. Monte Carlo simulations were used for dosimetry. Three prostate cancer (LNCaP, DU145, PC3) and three pancreatic cancer (Capan-1, Panc-1, BxPC-3) cell lines were irradiated by α-particles to the absorbed doses 0, 0.5, 1, and 2 Gy. For reference, cells were irradiated using 137Cs to the absorbed doses 0, 1, 2, 4, 6, 8, and 10 Gy. Radiation sensitivity was estimated using a tetrazolium salt-based colorimetric assay with absorbance measurements at 450 nm. The relative biological effectiveness for α-particles relative to γ-irradiation at 37% cell survival for the LNCaP, DU145, PC3, Capan-1, Panc-1, and BxPC-3 cells was 7.9 ± 1.7, 8.0 ± 0.8, 7.0 ± 1.1, 12.5 ± 1.6, 9.4 ± 0.9, and 6.2 ± 0.7, respectively. The results show the feasibility of constructing a desktop α-particle irradiator as well as indicate that both prostate and pancreatic cancers are good candidates for further studies of α-particle radioimmunotherapy.
Introduction
Based on the legendary work on radioactivity by Antoine Henri Becquerel published in Comptes Rendus in 1896, Ernest Rutherford discovered the α-particle in 1899 during his famous study of the radiation emitted from uranium and the electrical conduction produced by it. 1,2 This type of radiation has ever since been under investigation regarding its various characteristics and possible applications. Especially during the last two decades, focused attention in the field of therapeutic nuclear medicine has been directed toward α-particle emitters intended for targeted α-therapy (TAT) against disseminated microscopic cancer. In such studies, α-particle emitters such as 225Ac, 223Ra, 211At, 213Bi, and 212Bi have been used. 3 –8 The distinctive features of α-particles, compared to, for example, γ-radiation or β-particles, are their ability to create densely ionizing tracks when passing through tissue. 9 This is often expressed as the linear energy transfer (LET) and is a measure of the radiation's ability to transfer energy to the surrounding media per unit length travelled by the particle. 10
α-Particles have a mean LET in the range of 100 keV/μm. The LET varies along the Bragg curve, depending on the initial energy of the α-particle, from initially ∼50 to ∼250 keV/μm at the Bragg peak. By comparison, γ-rays from 137Cs or β-particles from 177Lu, 131I, or 90Y have a LET in the range of 0.3 keV/μm. Auger electrons, emitted from, for example, 111In or 125I, have a LET range in the order of 10−25 keV/μm during their cascade decay. 11 Another feature that differs between α-, β-particles and Auger electrons is the range. In tissue, α-particles have a range in the order of 50−100 μm, while β-particles and Auger electrons have an average range at the millimeter and nanometer scale, respectively. Hence, α-particles have certain special features and are therefore a useful alternative when evaluating new radioimmunotherapeutic treatment strategies against cancer in vivo or in the clinic, or when investigating the inherent radiation sensitivity of different cells in vitro.
Radioimmunotherapy (RIT) has developed during the past decades resulting in two FDA-approved drugs using β-particle emitters, Zevalin® and Bexxar® (i.e., 90Y Ibritumomab and 131I Tositumomab, respectively), both used to treat refractory low-grade B-cell non-Hodgkin's lymphomas. 12 –15 Another newly FDA-approved drug is Xofigo®, which is based on an α-particle emitter. 16 Although strictly speaking not an RIT approach, it is a targeted treatment against metastatic bone-localized prostate cancer. This drug consists of 223Ra-dichloride that is used to treat the symptomatic bone metastases of castration-resistant prostate cancer. The targeting is achieved because the substance is mimicking calcium and, therefore, selectively targets high metabolic bone structures with involved bone metastases by complex formation with bone minerals.
In this study, the authors have developed a benchtop easy to use external α-particle irradiator and, thereby, enabled the inclusion of α-particles during studies of inherent radiation sensitivity of cancer cells. The design of the irradiator is relatively low cost and could be implemented in almost any laboratory. Another advantage of this irradiator is the detailed description of the Monte Carlo (MC) modeling for the dosimetry and the usage of the open source MC code GATE, using the well validated and documented GEANT4 physics. To construct such an irradiator, which once calibrated can be used over a long time period, the authors have chosen the α-particle emitter 241Am. This radionuclide has a half-life of 432.6 years and emits α-particles of energies 5.48 MeV (84.5%), 5.44 MeV (13.1%), 5.39 MeV (1.6%), 5.54 MeV (0.3%), and 5.51 MeV (0.2%), with a weighted energy average of 5.46 MeV. The nuclide also emits several γ-rays, for example, 59.5 keV (35.9%), enabling activity calibration measurements using high-purity germanium (HPGe) detectors.
The rather compact design of the α-particle irradiator makes it easy to move between different locations. It also makes it possible to perform irradiation experiments under, for example, different temperatures by placing it in an incubator or refrigerator during the irradiation of cells. The latter is important if studies of the temperature dependence of high-LET irradiations are to be performed, investigating bystander signaling or DNA repair under such conditions. Examples of other α-particle irradiators that have been constructed earlier include the bench-top system developed in J. Little's laboratory at the Harvard School of Public Health and the system built in R. W. Howell's laboratory at the New Jersey Medical School. 17,18 A bench-top α-particle irradiator was also presented at the Massachusetts Institute of Technology by Wang. 19
To investigate the inherent radiation sensitivity of cells exposed to α-particles, the authors irradiated six different types of cancer cells using the above mentioned 241Am source and compared the effect with γ-radiation from a standardized 137Cs source. The cells used in this study were three types of prostate cancer and three types of pancreatic cancer cells, that is, LNCaP, DU145, PC3, Capan-1, Panc-1, and BxPC-3. The results can be used in estimating the potential use of TAT against these different types of cancer. Since the developed α-particle irradiator also can be used for two-compartment systems, studies are now ongoing investigating the bystander effect of α-particles compared to other types of radiation, such as γ-rays, β-particles, and Auger electrons.
Material and Methods
Below is described how the 241Am source was designed, constructed, and calibrated, how the absorbed dose calculations were performed by MC simulations, and how the cancer cells were grown, irradiated, and evaluated for radiation sensitivity.
Americium-241 α-particle source
A custom-made α-particle source was ordered from Eckert & Ziegler Isotope Products GmbH, Braunschweig, Germany (through Gammadata Instrument AB, Uppsala, Sweden). The source was produced under ISO standards 2768-m/8769/2919 by electroplating 241AmO2 onto an aluminum backing to a final effective circular source size of 11.8 mm in diameter. The activity of the source was determined through a reference measurement using an HPGe detector and a small (Ø = 2 mm) calibration source of 241Am. The distance from the detector was 60 cm, and 10,000 pulses were recorded in the 59.5 keV γ-peak. The α-particle energy spectra of the source was measured through Passivated Implanted Planar Silicon (PIPS®) detector measurements, see below.
The uniformity of the source was estimated by utilizing the emitted 59.5 keV γ-rays and measuring the variation of the optical density on a Gafchromic EBT3 film (ISP, Wayne, NJ). The uniformity was determined to vary with ±3.5% across 1000 pixels, equal to the diameter of the source. The α-particle energy emitted from 241Am is ∼5.46 MeV. However, since the α-particles emitted from the source will have had some of their energy absorbed before leaving the source, a measurement of the emitted α-particle spectrum was performed using the PIPS detector. The MC model of the americium source was validated against the measured energy spectrum.
Semiconductor detector measurement of the 241Am source
The 241Am source was measured in a vacuum using a PIPS detector of type A300-17AB (Canberra, Meriden, CT). The electronics used were a preamplifier of type 2003BT (Canberra), a voltage supply of type 710 (Canberra), and an all-in-one amplifier/ADC/MCA of type DigiDART (EG & ORTEC, Oak Ridge, TN). The DigiDART was used due to its ability to handle high pulse rates with low dead time. The distance between the 241Am source and the detector surface was set to 36 mm. The measurement time was 180 seconds, and the energy calibration of the system was done using a calibration source electroplated with 242Pu and 243Am.
Defining the 241Am source and simulations of the PIPS detector using MC
The MC simulations were done using GATE v7.0 (GEANT4 Application for Tomographic Emission) using the GEANT4 version 9.6 patch 03 libraries with the QBBC_EMY physics list. 20,21 GATE, which uses the GEANT4 physics libraries for all simulations, was developed especially for MC simulations of medical imaging and radiotherapy.
All detailed information needed for defining the 241Am source in the MC model could not be provided by the manufacturer. Therefore, the energy spectrum was first measured using the PIPS detector as described above. In the MC model, the source was then defined using the available information from the manufacturer, which was further modified until the simulations produced an energy spectrum equivalent to the measured energy spectrum.
The minimum thickness of active area in a PIPS detector is greater than 140 μm, which is sufficient for full-energy absorptions of α-particles up to 15 MeV. Therefore, the detector and its response were not modeled in the simulations. Instead, the detector's active area was defined in the vacuum volume. The simulations scored, using GATEs phase space actor, the α-particles reaching the position of the active area facing the 241Am source. The output from the simulations was further analyzed in MATLAB™ (MATLAB Release 2012b; The MathWorks, Inc., Natick, MA). Events occurring before the α-particles reach the active volume, that is, passing the detector window, result in a decrease of spectrum resolution. This was accounted for by broadening the energy spectrum of the scored α-particles using a Gaussian broadening function with width FWHM/2.335, FWHM = 17 keV. 22
In the simulations, the geometry of the 241Am source included the 241Am source itself and a 0.5 μm thick palladium (12.023 g/cm3) coating. The silver foil, epoxy, and engraving were not included since no exact details about those parameters were available from the manufacturer of the source. The americium layer was modeled as a solid cylinder of AmO2 (11.68 g/cm3), with diameter 11.8 mm and height 0.296 mm. The measured energy spectrum, using the PIPS detector, showed a single broad α-particle peak that could not be explained by the detector energy resolution alone. Therefore, it was assumed that the α-particles were distributed at different depths in the AmO2, and hence, the difference in energy loss before leaving the source resulted in a broadened energy spectrum. The source term in the simulations was therefore divided into 19 circular planar sources, diameter 11.8 mm, and placed at different depths in the AmO2. The uppermost plane source was placed directly below the palladium coating, and the remaining layers were evenly distributed down in the AmO2 layer in steps of 0.15 μm. Each planar source emitted 5.46 MeV α-particles isotropically in the 2π-hemisphere facing the PIPS detector. In total, 10 million α-particles were simulated and the total intensity of the 19 planar sources was set to unity. The intensity of each planar source was adapted until the simulated energy spectrum showed a similar broadening as in the measured energy spectrum.
In the simulations, the definition of the 241Am source was simplified. Hence, the activity determined using the HPGe detector is not applicable for the simulated source. The activity of the simulated source was determined by scaling the simulated energy spectrum for the PIPS detector; the scaling was made with respect to the peak maximum in the simulated and measured energy spectrum, respectively. The scaling factor gave the measurement time represented by a simulation of 10 million α-particles, which also gave the total activity of the simulated source.
Irradiation setup
Figure 1 shows a drawing of the irradiation setup. An image of the complete geometry is shown in Figure 2. The 241Am source was placed in an aluminum holder and covered with a 1 μm protective Mylar® film. Well inserts were placed on top of this film, centered at the source. In the well inserts, cells were grown as monolayers on a 10 μm thick polyester membrane at the bottom of the wells. An acrylic glass lid was placed on top of the well inserts to keep them stable during irradiation.
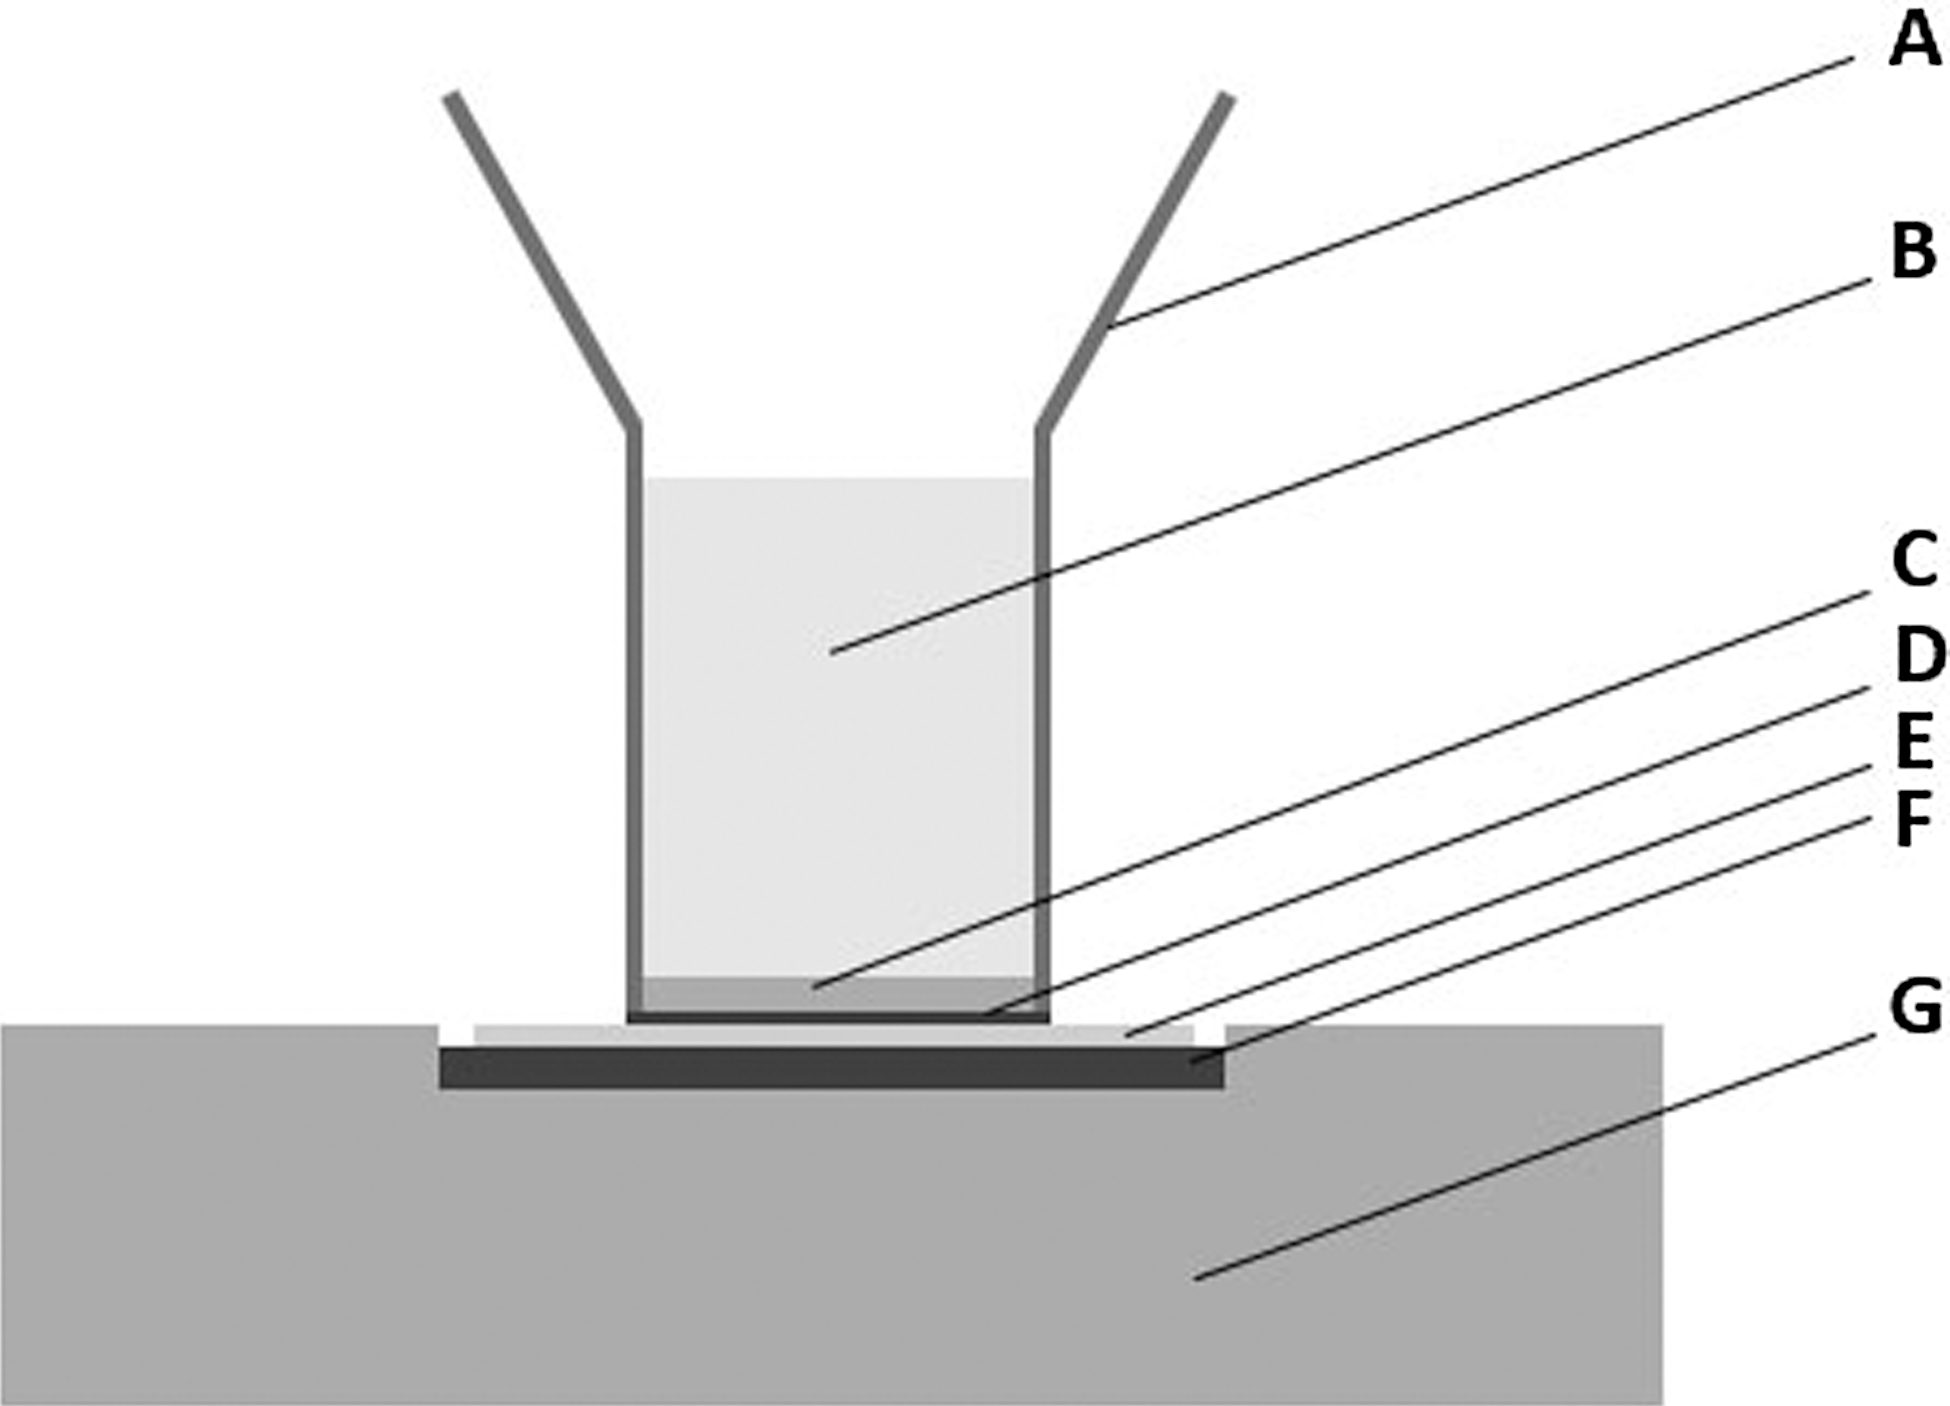
Geometry of the 241Am α-particle irradiator showing the following: well insert

Picture showing the setup during the α-particle irradiations. Shown is the fixture holding the well insert at place during irradiation
MC simulations of absorbed dose to cancer cells
The definition of the 241Am source is described above. The 1 μm thick Mylar (a polyester film) and the 10 μm thick polyester membrane (1.38 g/cm3, C10H8O4) were placed directly on top of the 241Am source. Both layers were modeled as cylinders with a radius of 5.9 and 3.3 mm, respectively, centered above the source. The well inserts, placed directly on top of the polyester layer, were modeled as a polystyrene tube (1.0 g/cm3, C8H8) with a wall thickness of 1 mm and inner radius of 3.2 mm. The cell layers, inside the well inserts, were defined as a water-filled cylinder with a height of 20 μm and radius of 3.2 mm. The height was determined after estimations of the diameter of the cell nuclei for the different cancer cells, which was found to be in the range of 18–22 μm. Hence, 20 μm was used for all computations for all cell lines. The cell layer was placed directly on top of the polyester layer. The cell culture medium was defined as a water-filled cylinder placed directly on top of the cell layer, height 4.98 mm and radius 3.2 mm.
The absorbed dose to the cell layer was simulated for 10 million emitted α-particles. The energy deposition in the cell layer was scored using GATE's sensitive detector, which gives the energy deposition per particle. The absorbed dose was calculated by dividing the sum of all energy depositions with the mass of the cell layer. The energy of the α-particles entering the cell layer was scored using the phase space actor. For 2 million simulated α-particles, the energy of the α-particles entering the Mylar layer (i.e., the α-particles leaving the source) was scored using the phase space actor. Using the SRIM/TRIM software package (which is based on the work on range algorithms by J. P. Biersack) developed by J. Ziegler in the early 80s, the LET spectrum of the α-particles hitting the cell layer was calculated. 23,24
Cancer cells
The prostate cancer cell lines LNCaP, DU145, and PC3 were purchased from the American Type Culture Collection (ATCC®, Manassas, VA) and grown in Roswell Park Memorial Institute (RPMI) 1640 medium, Eagle's minimum essential medium (EMEM), and Kaighn's modification of Ham's F-12 (F-12K) medium, respectively, supplemented with 10% fetal bovine serum (FBS) and 1% penicillin–streptomycin (100 U/mL). The cells were grown in T-75 and/or T-150 flasks as a monolayer and kept at 37°C in a humidified atmosphere in an incubator at 5% CO2. Culturing media were changed at least twice per week and the cells passaged before reaching confluence, using trypsin-EDTA. All experiments were carried out with cells in passage-number intervals 12−26, 12−23, or 12−22, respectively. The cell-doubling times were determined to be 50, 35, and 30 h for the LNCaP, DU145, and PC3 cells, respectively.
The pancreatic cancer cell lines Capan-1, Panc-1, and BxPC-3 were purchased from the American Type Culture Collection (ATCC) and grown in Iscove's modified Dulbecco's medium (IMDM), Dulbecco's modified Eagle's medium (DMEM), and RPMI 1640 medium, respectively, supplemented with 10% FBS and 1% penicillin–streptomycin (100 U/mL). The cells were grown as described above. The cells were passaged before reaching confluence using TrypLE™ Select (10×) or TrypLE Select (1×). All experiments were carried out with cells not exceeding passage number 14, 20, or 28, respectively. The cell-doubling times were determined to 41, 52, and 48−60 h for the Capan-1, Panc-1, and BxPC-3 cells, respectively.
The cell counting was performed using the The Countess™ automated cell counter that utilizes trypan blue staining and image analysis algorithms to identify the total number of cells and the fraction of viable cells (Life Technologies Ltd., Paisley, United Kingdom).
241Am and 137Cs irradiations
The LNCaP, DU145, PC3, Capan-1, Panc-1, and BxPC-3 cells were, at each radiation experiment, each seeded into two removable well inserts of a 24-well plate (Thermo Fisher Scientific Inc., Waltham, MA) at an approximate cell density of 10,000 cells/well in 100 or 200 μL culture medium. Two additional wells were filled with the same amount of medium without any cells present and used as controls. After 2−3 days of recovery, the medium was changed and the cells were irradiated to the desired absorbed dose level. Controls were treated in the exact same manner, without being irradiated. Before each irradiation, it was confirmed that the cells grew in a monolayer by inspection using a light microscopy. For the α-particle irradiations, each removable well insert was placed on top of the 241Am source in the fixture and geometry as described above and irradiated to the desired absorbed dose. For each new irradiation, the sterilized Mylar film was replaced to minimize the risk of contamination. For the 137Cs irradiations, the well inserts were placed in the 137Cs irradiator Gammacell 40 Exactor (Best Theratronics Ltd., Ashford, United Kingdom) and irradiated to the desired absorbed dose. The absorbed dose rate during the 137Cs irradiations was 0.86 Gy/minutes. Regarding 137Cs, some irradiations were also done using 96-well plates, for comparison with those irradiations done using 24-well plates, including subsequent transfer to 96-well plates enabling readout of the surviving fractions.
Radiation sensitivity measurements
After irradiation, the cells were left in an incubator for a time period equal to the specific cell-doubling time plus at least one day. Each well insert was gently washed with cell media twice, and the cells therein were then very carefully trypsinized and transferred to three individual wells on a 96-well plate in 100 or 200 μL of fresh medium, after which the protocol for cell viability measurements was initiated. Cell viability was determined by a tetrazolium salt-based calorimetric assay using the Cell Proliferation Reagent WST-1 (water soluble tetrazolium) Kit (Roche Applied Science GmbH, Pensberg, Germany). The WST-1 kit is especially manufactured for nonradioactive spectrophotometric quantification of, for example, cell viability. The tetrazolium salt in the kit, once added to a cell solution, is reduced to the colored compound formazan by mitochondrial dehydrogenase enzymes and gives a direct correlation to the number of metabolically active or viable cells in the solution. For each 96-plate well, 10% of WST-1 solution was added and incubated for at least 4 h at 37°C in 5% CO2 in a humidified atmosphere. The absorbance of the dissolved formazan product was measured at 450 nm on a Labsystems Multiscan Plus plate reader using the DeltaSoft JV software (BioMetallics Inc., Princeton, NJ). The mean value from measurements of fresh medium containing 10% WST-1 was used for absorbance background correction, and untreated cells were used as control.
Results
This study shows that it is possible to construct a bench-top easy to use external α-particle irradiator for use in radiation sensitivity studies. Once it has been calibrated and the geometry has been fixed, it can be used repeatedly with no extra calibration needed, due to the long half-life of 241Am.
The activity of the 241Am source was found to be 405 ± 10 kBq according to the HPGe detector measurements, which is in good agreement with the PIPS detector-based MC simulations, which resulted in an estimated total activity of 417 kBq if self-absorptions of the γ-rays emitted from 241Am were taken into account. Figure 3 shows the measured energy spectrum and the simulated energy spectrum for the PIPS detector. The MC simulated full-energy peak overlaps with this measured full-energy peek completely. Figure 4 shows the energy spectrum of the α-particles hitting the cell monolayer as calculated by the MC simulations (peak energy = 3.20 MeV) as well as PIPS detector-measured energy spectrum (peak energy = 4.98 MeV). The figure clearly shows that the processes occurring before the α-particles reach the cell layer result in a lowering of the mean energy as well as a greater spread in α-particle energies. Figure 5 shows the LET spectrum of the α-particles hitting the monolayer of cells. As mentioned before, Figures 1 and 2 illustrate the geometry and irradiation setup during the α-particle irradiations. The calculated absorbed dose rate in this setup and under the declared assumptions stated above was 1.05 Gy/min.
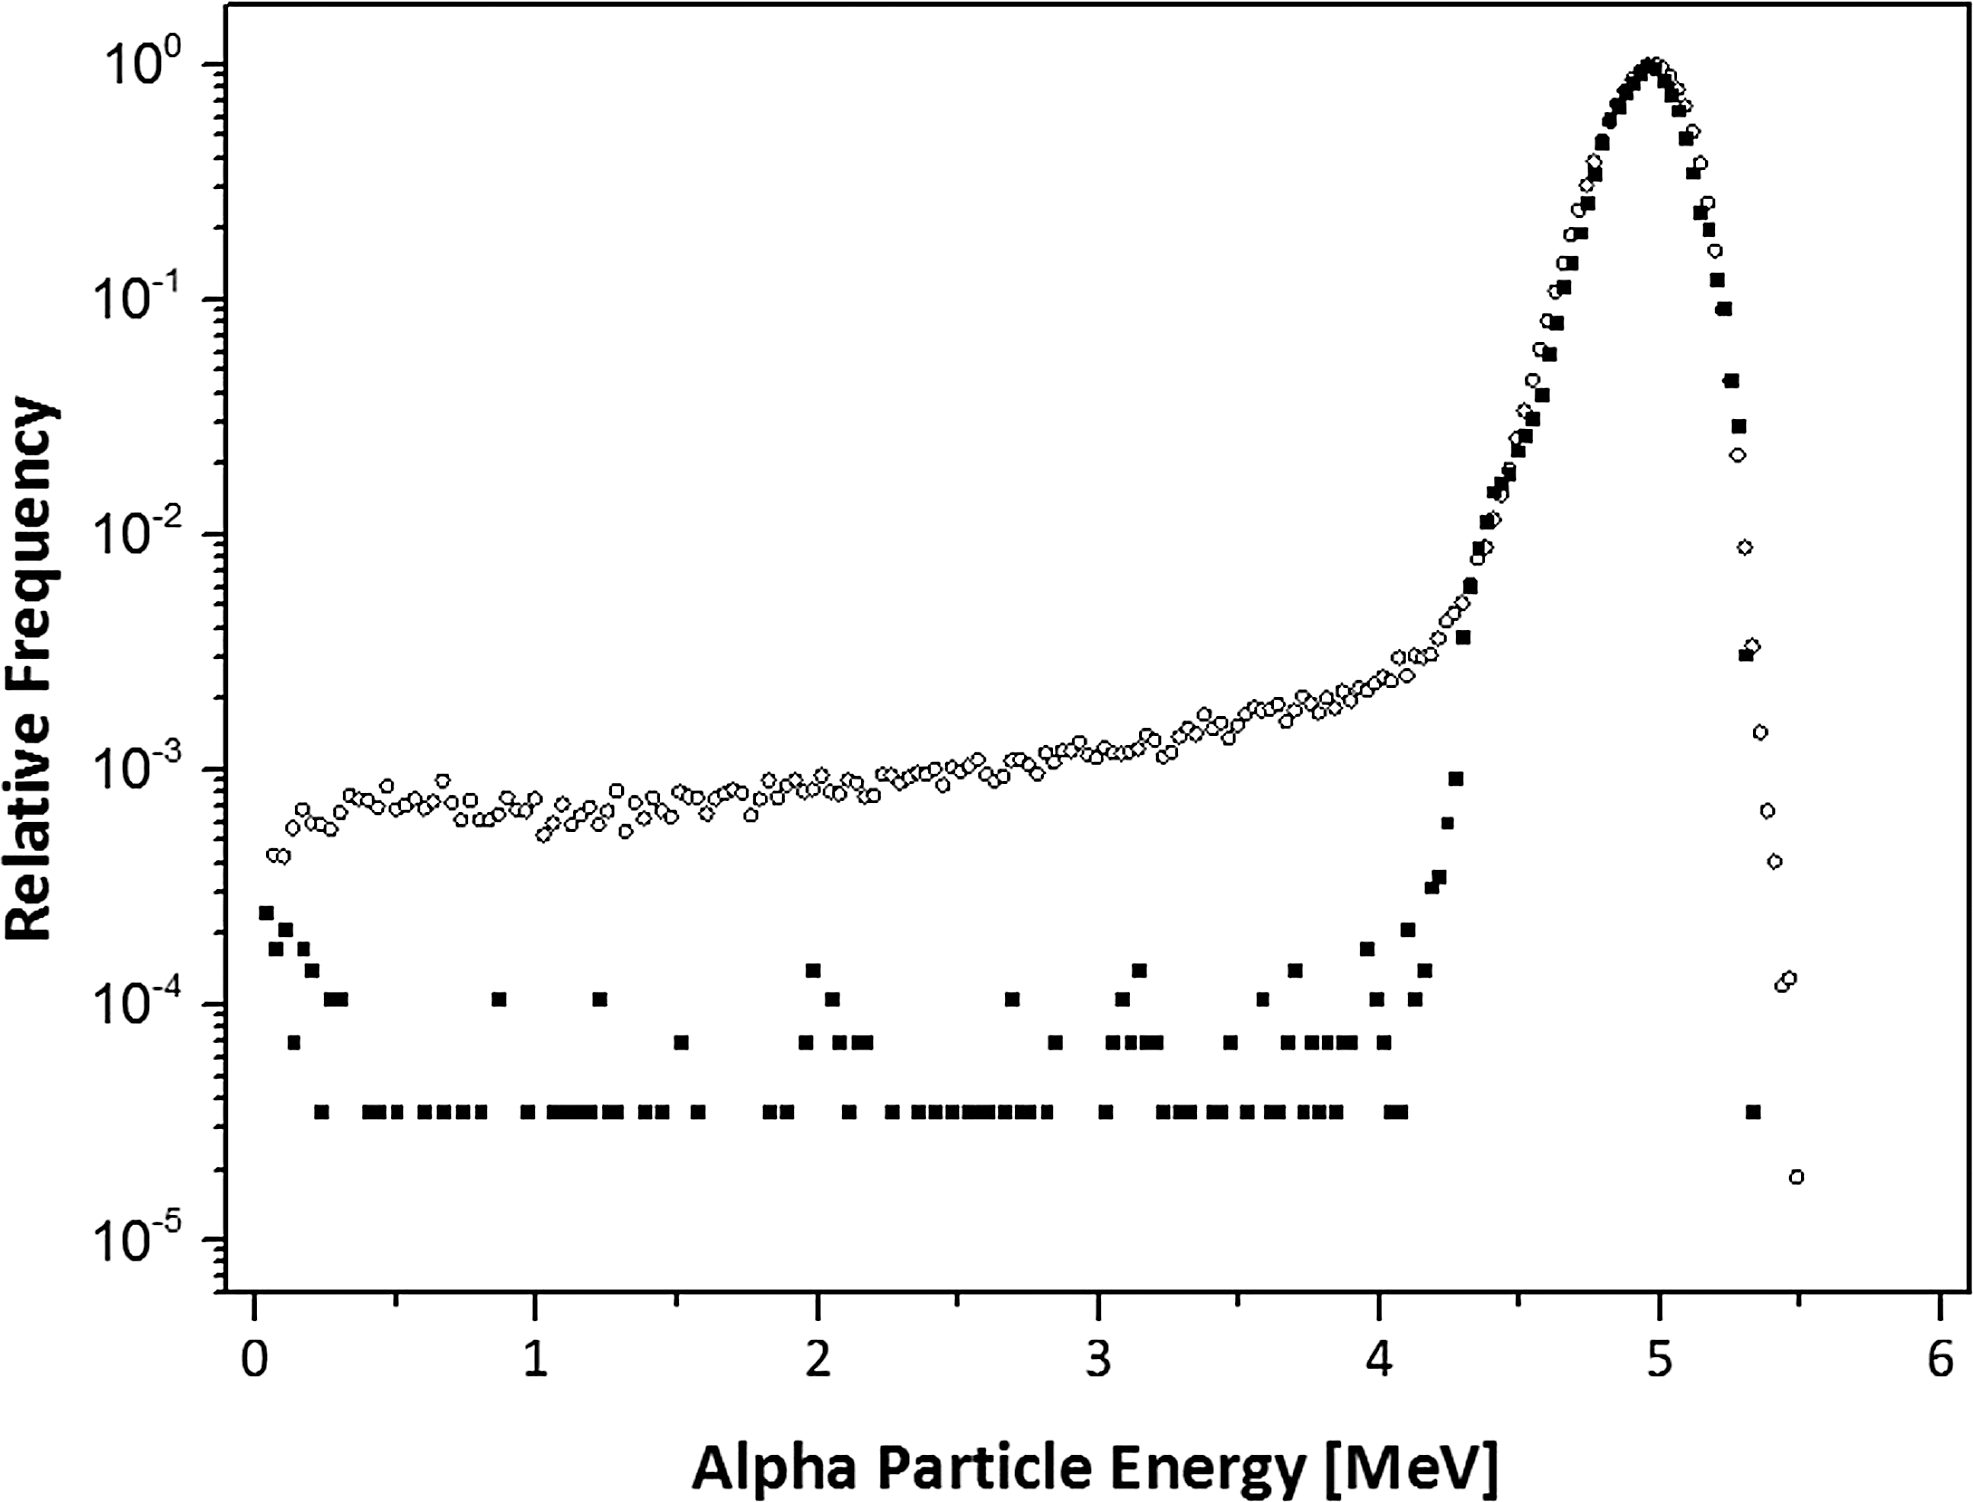
PIPS® detector measured α-particle energy spectrum from the 241Am source in logarithmic scale with peak energy of 4.98 MeV (◯). Shown is also the Monte Carlo (MC)-simulated PIPS detector response (■). The full-energy peak of the measured and the simulated energy spectrum, respectively, overlaps completely.
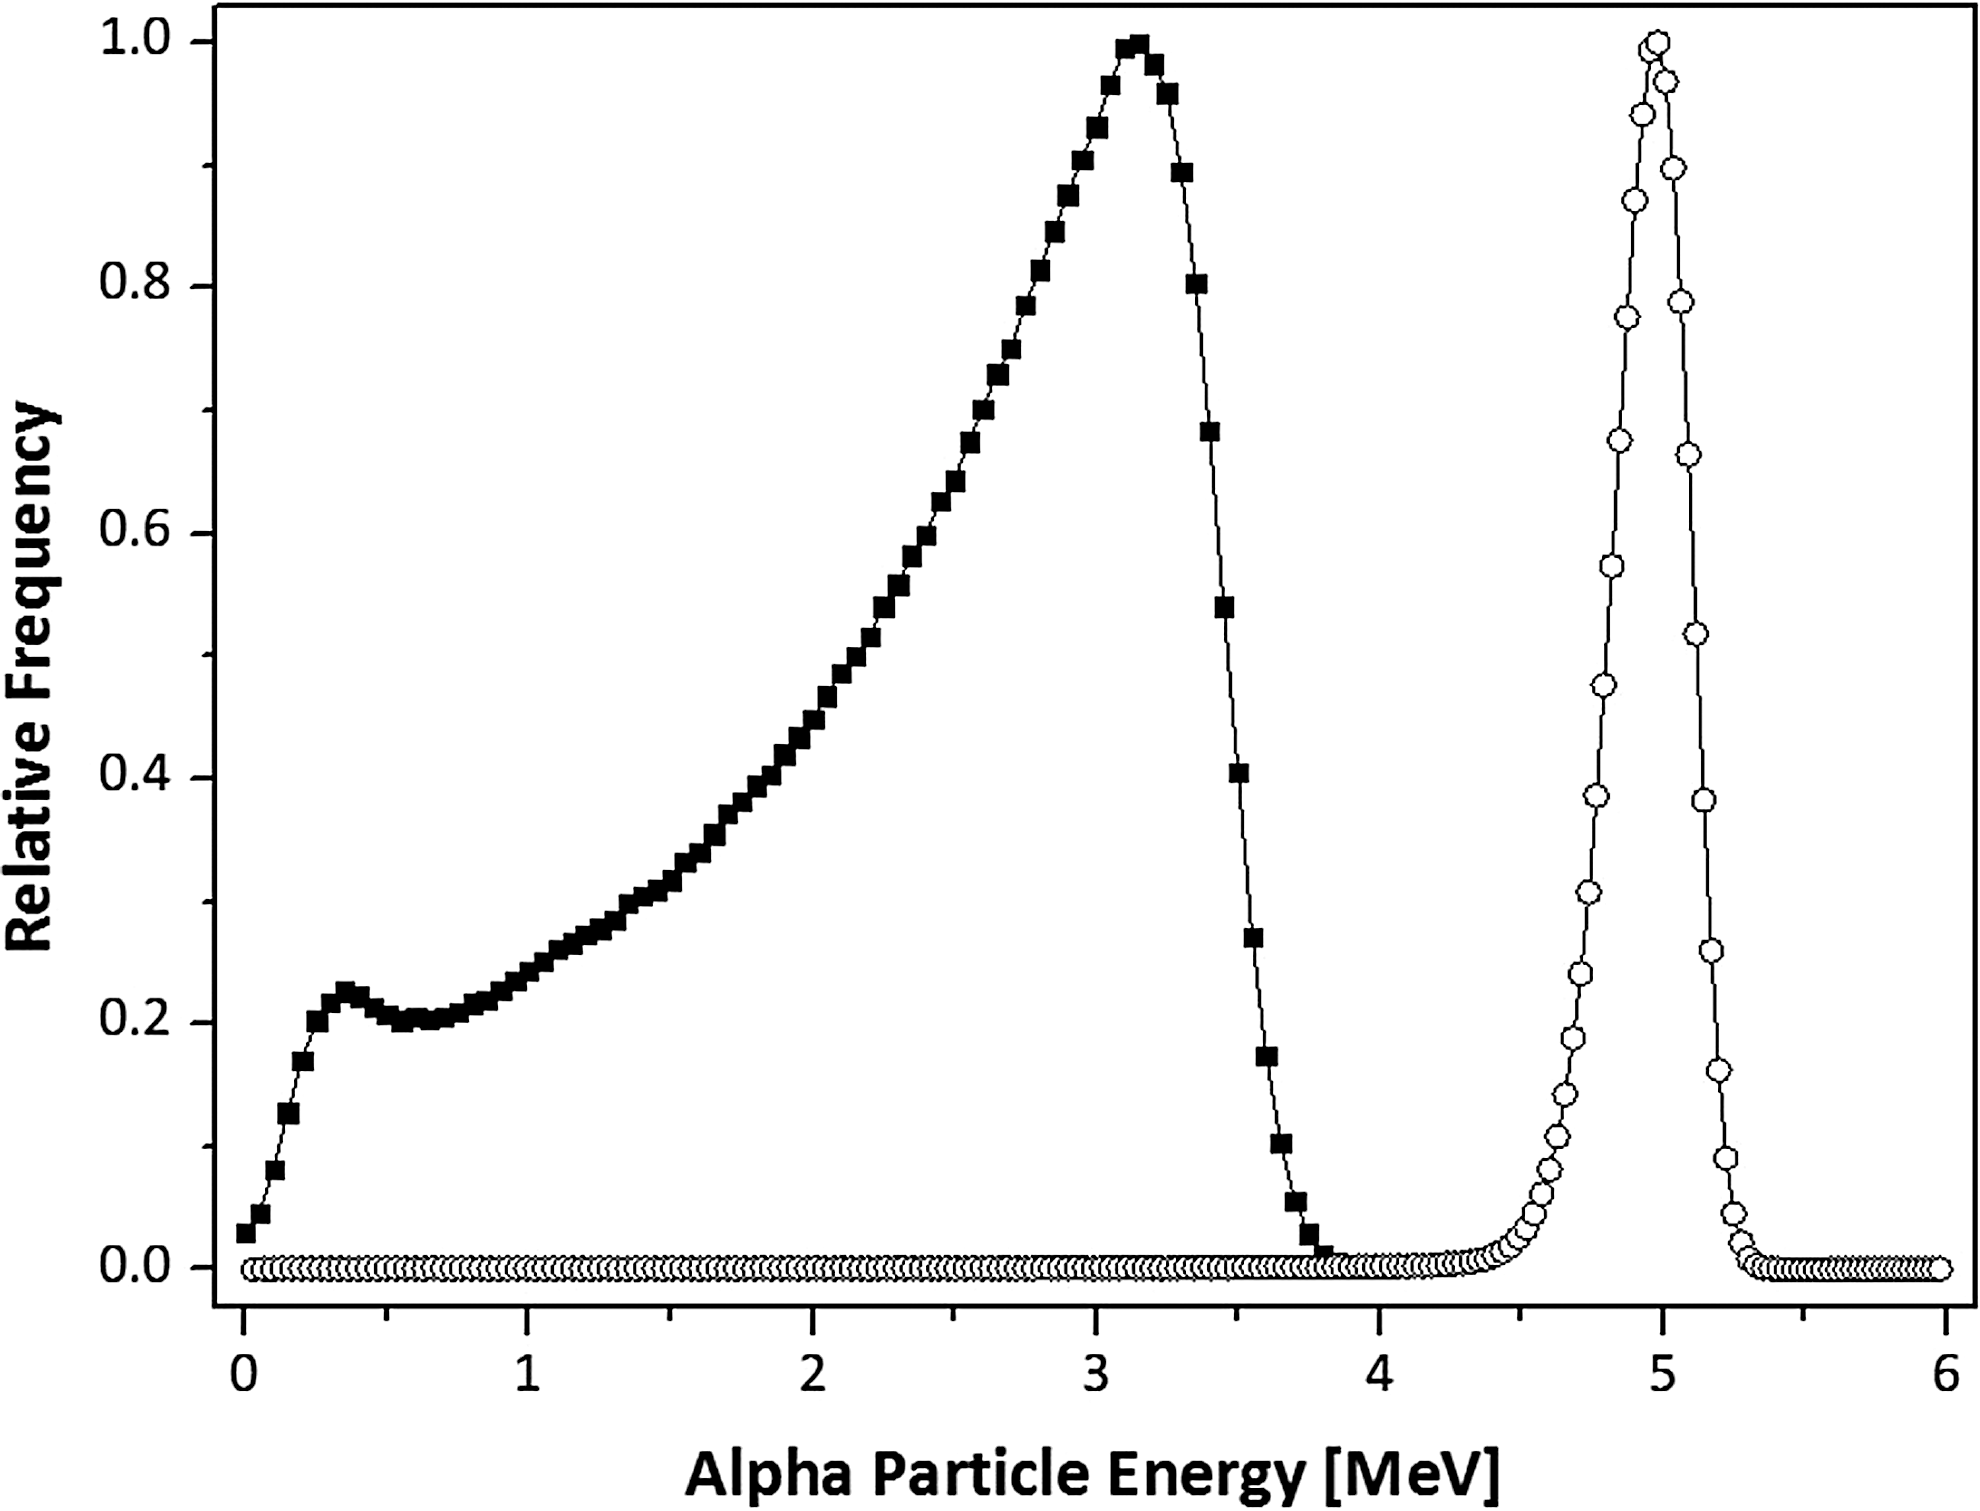
Normalized energy spectra. The MC simulated energy spectrum of α-particles hitting the cell monolayer (■), with peak maximum energy at 3.20 MeV. The PIPS detector measured energy spectrum (◯), with peak maximum energy of 4.98 MeV.
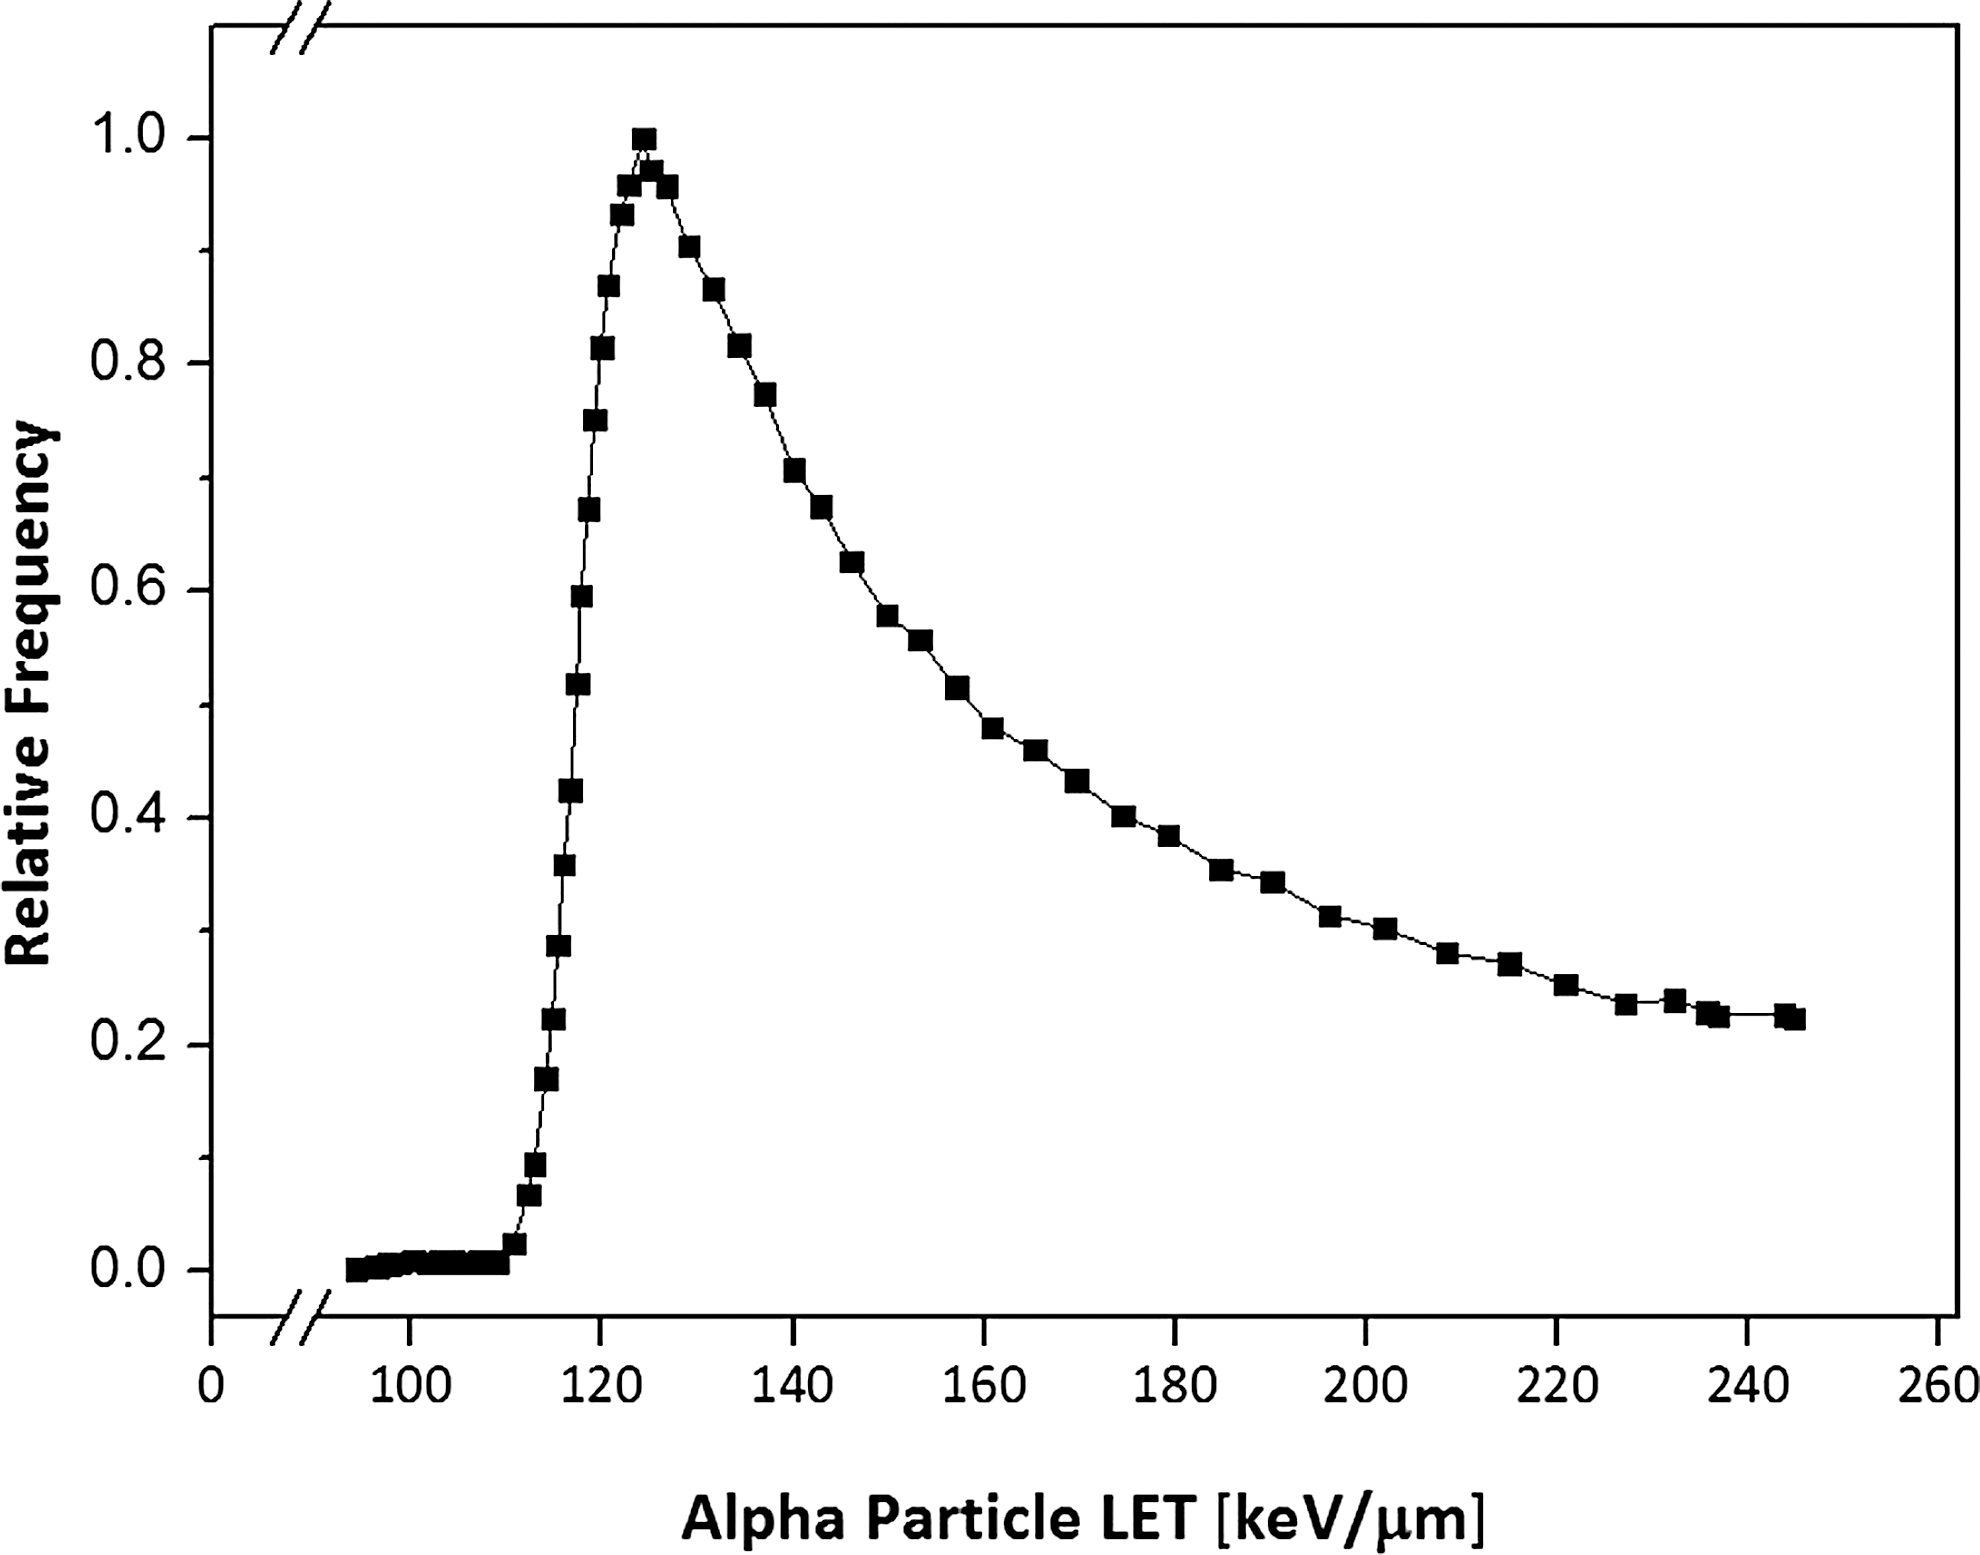
α-Particle linear energy transfer (LET) spectrum of particles hitting the cell monolayer, as calculated by the SRIM/TRIM software package. The peak LET being 124.3 keV/μm.
The study also shows that irradiating cancer cells by α-particles has a significantly more lethal effect compared to 137Cs irradiations. Especially, the relative biological effectiveness (RBE) values for the α-particles, relative to the γ-irradiation from 137Cs at 37% cell survival, for the LNCaP, DU145, PC3, Capan-1, Panc-1, and BxPC-3 cells were 7.9 ± 1.7, 8.0 ± 0.8, 7.0 ± 1.1, 12.5 ± 1.6, 9.4 ± 0.9, and 6.2 ± 0.7, respectively (Table 1 and Fig. 6A–F). For the α-particle irradiations, the survival fractions at 2 Gy (SF2) were 0.03 ± 0.01, 0.02 ±0.01, 0.02 ± 0.01, <0.01, 0.01 ± 0.01, and 0.02 ± 0.01, respectively (Table 1 and Fig. 6A–F). For the γ-irradiations, the SF2 values were 0.66 ± 0.12, 0.65 ± 0.05, 0.62 ± 0.10, 0.61 ± 0.08, 0.72 ± 0.16, and 0.62 ± 0.04, respectively (Table 1 and Fig. 6A–F). The α/ß ratios for the γ-irradiation were 8.7, 14.2, 17.4, 15.7, 5.3, and 17.9, respectively (Table 1 and Fig. 6A–F).
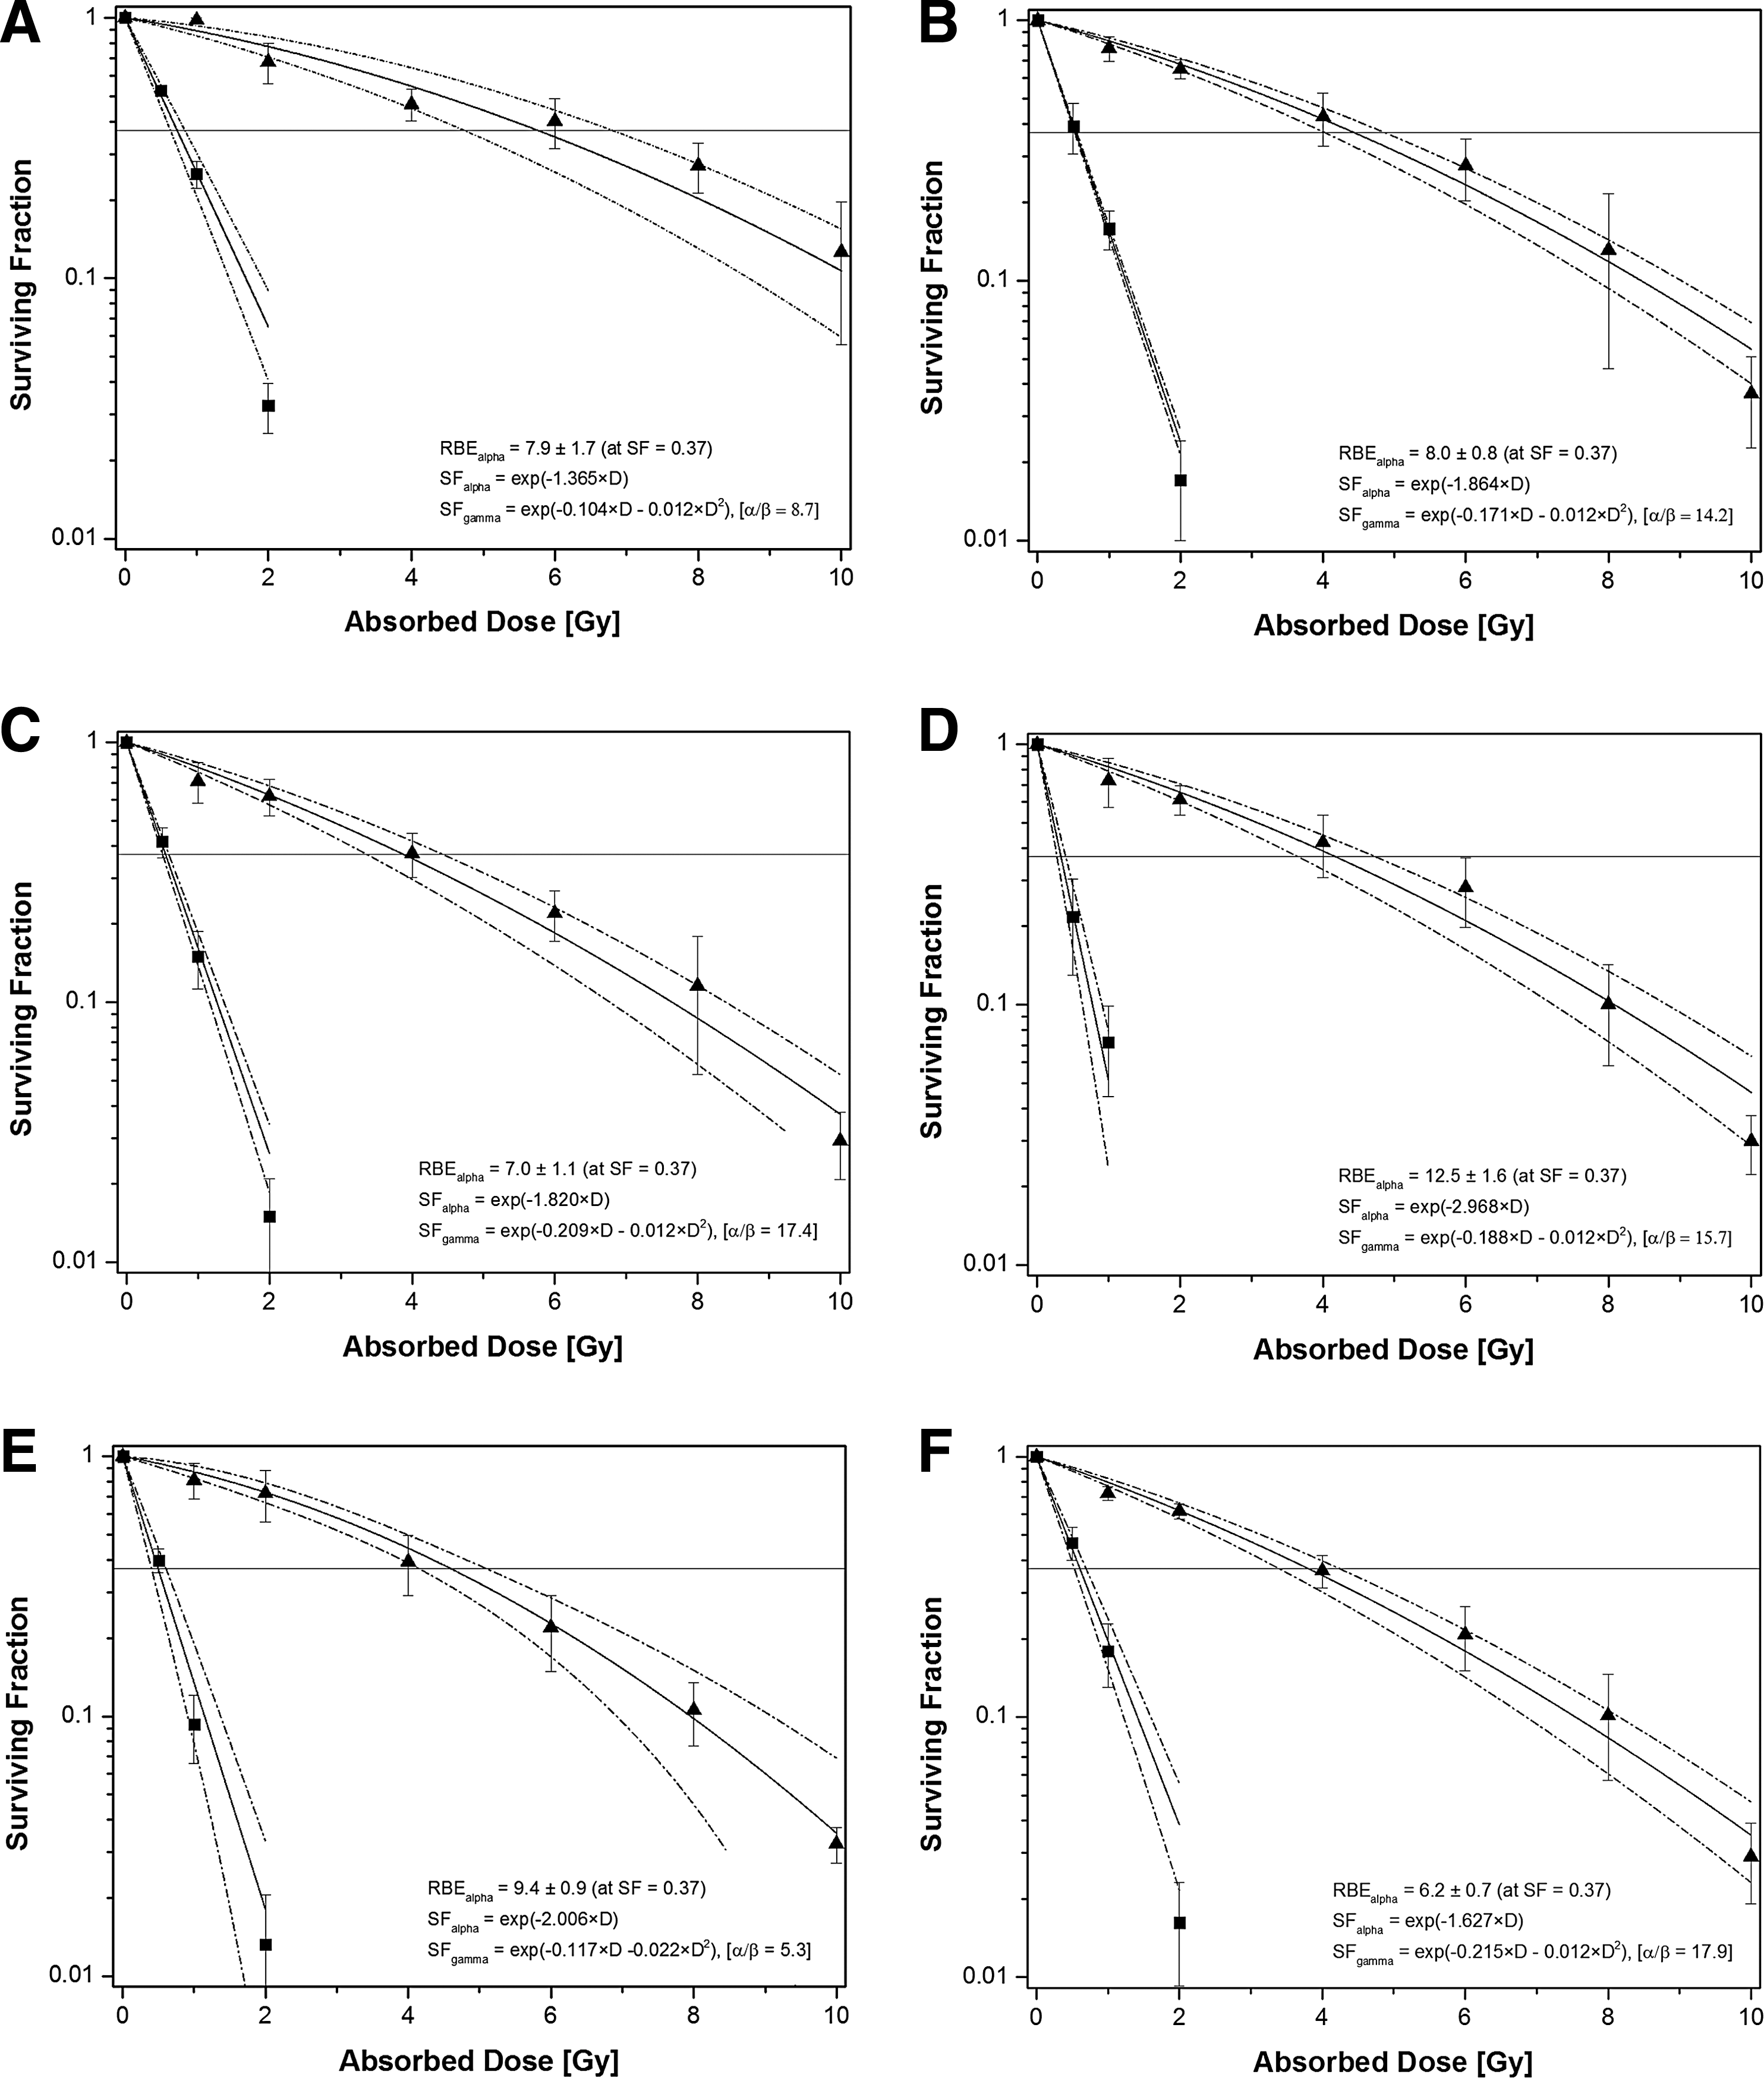
Value not possible to determine since it was lower than the background level.
RBE, relative biological effectiveness (mean ±95% CI) at survival fraction equal to 0.37; SF2 (α), survival fraction at 2 Gy for α-particle irradiation (mean ± SD); SF2 (γ), survival fraction at 2 Gy for a γ-irradiation (mean ± SD); α/β ratio (γ), the α/β ratio for the biexponential curve fit for the γ-irradiations.
Discussion
The present study reports on how to construct and calibrate an easy-to-use and relatively low-cost α-irradiator for establishing a constant broad beam of α-particles to a monolayer of cells. Also is described how with MC technique an accurate dosimetry can be performed. The intention was to create an irradiation geometry that could be available for radiation sensitivity experiments at any time. α-Particles are an important type of radiation to include in such studies, besides the use of γ-rays, β-electrons, or Auger electrons. There are three dominant α-particle energies emitted from 241Am; 5.48, 5.44, and 5.39 MeV. This means that the α-particle energy emitted from the source is almost monoenergetic. However, since the beam of α-particles passes through a Mylar film and a polystyrene membrane before reaching the cell layer, some attenuation of the beam and, hence, broadening of the energy spectra will occur. This is illustrated in Figures 4 and 5, showing the energy and LET spectrum of the α-particles hitting the cells, respectively. An interesting basic radiobiological experiment would be to irradiate cells with a true monoenergetic α-particle beam and investigate the radiation sensitivity for defined values of LET. However, in a clinical situation, the cells will always be hit by α-particles of a wide range of energies and LET values. Since this is a preclinical study, the authors think it is valuable to perform the experiments as presented here.
Semiconductor measurements and MC simulations
Some modifications of the simulated 241Am source were made in the MC model. The exact thickness of stated epoxy and silver layers by the manufacturer could not be provided, and the stated 2 μm palladium coating was set to 0.5 μm; the manufacturer could not verify the exact thickness, and a thicker palladium coating than 0.5 μm resulted in too high an energy loss for the α-particles. The discrepancies in thickness might be explained by the following: the coating is thinner than that stated by the manufacturer, the thickness is nonhomogenous, or the coating is an alloy of palladium and an additional element not stated by the manufacturer.
The measured energy spectrum in Figure 3 shows a single broad peak. The PIPS detector has a high-energy resolution (FWHM = 17 keV), and the broad peak must therefore be caused by the source geometry. A homogenous distribution of α-particles in the AmO2 layer did not produce a similar broadening, regardless if the energy of the α-particles was defined as the mean energy or using all α-particles emitted (and their respective intensities) in a 241Am decay. The shape of the measured energy spectrum suggested that a heterogeneous distribution of α-particles could create a similar broadening. Therefore, 19 circular planar sources were defined and placed at different depths in the AmO2 layer. The tail on the left side of the full-energy peak in the measured energy spectrum is not seen in the simulated energy spectrum. The tail can be divided into two parts. The first part starts at where the measured values differ from the simulated and ends at ∼4.1 MeV. The difference between measurement and simulation can be explained by the following factors in the measurement setup: a heterogeneous depth distribution of the americium in the source, an uneven detector dead layer, not high enough vacuum reached in the vacuum chamber, and geometrical effects. The americium distribution is most likely the most important factor, and in future works, more attention should be given to the definition of source in the MC model. The second part of the tail, from ∼4.1 to 0 MeV, cannot be explained by the already mentioned factors. This part of the tail is probably caused by an insufficient piled-up rejection in the detector electronics and electronic noise, both caused by the high count rate. However, the entire left-side tail of the measured spectra in Figure 3 contains only ∼1‰ of the total number of counts and gives, therefore, a very limited contribution of the total number of particles, and hence, absorbed dose.
Modeling the PIPS response would require exact knowledge about the detector design (which is not possible) and validation measurements. The authors believe that the approximation used in this work, that all α-particles reaching the active volume deposits their entire energy and the energy straggling is accounted for using the Gaussian broadening function, is a reasonable simplification. The MC model of the source is not an exact replica of the real source, and it is therefore not expected that the simulated energy spectrum and activity would exactly match the measured energy spectrum and activity. However, a large deviation between simulations and measurements would imply that the MC model is not sufficient. Since there is a good agreement between simulated and measured activity, as well as between simulated and measured energy spectrum, it can be assumed that the MC model gives a good estimation of the absorbed dose, given that the cells can be modeled as a homogenous water layer with a thickness of 20 μm.
Another possibility of modeling the α-particle source is to use a measured energy spectrum as the definition of a source spectrum in the simulations. The angular distribution, and hence, the energy of the α-particles, reaching the detector volume changes with source detector distance. The PIPS detector would therefore have to be placed at the same position as the cell layer, which however was not possible in this study due to high dead times.
Absorbed dose to cancer cells
Calculating the absorbed dose from the α-particles as a mean dose, especially when considering low absorbed doses, can induce statistical uncertainties. Depending on initial α-particle energy, where on the Bragg curve the α-particle is when it enters the cell, and how large the cell nucleus is, the energy imparted by a single α-particle traversal through a cell nucleus differs, but could be in the order of 0.2 Gy. In addition, the statistical uncertainty at low absorbed doses could be considerable with respect to how large fractions of the cells have received, for example, 0, 1, 2, or 3 hits by α-particles. Such situations could in some cases be dealt with using microdosimetry. 25 However, to have complete control over the statistics, microbeam studies have to be performed, in which full control over which cells have received hits and how many hits they have received is made possible. 26 Such studies are possible only at a handful of research facilities around the world. The authors are now planning for both a microdosimetric analysis of the irradiation setup presented in this article and for microbeam experiments for some of the cell lines studied here. Contribution of γ-radiation from 241Am to the absorbed dose to the cells was in the order of 10−5 to that from the α-particles and could therefore be ignored.
Radiation sensitivity measurements
Regarding the radiation sensitivity measurements, using the WST-1 assay has some advantages, but also some drawbacks. On the positive side, it is easy to use, it is possible to repeat measurements on the same well insert several times without killing the cells, and it gives a result regarding the radiation sensitivity fairly quickly, with a limited amount of work. The authors also believe that it is more operator independent than, for example, the colony-forming assay. On the negative side, the WST-1 assay is not as sensitive as the colony-forming assay for high absorbed doses, that is, small surviving fractions under one percent. This applies to all tetrazolium-based assays (e.g., the MTT assay) in comparison to colony forming.
It has previously been shown that tetrazolium-based assays to some degree overestimate the surviving fraction for absorbed doses over ∼8−10 Gy. 27 However, since they limited this study to maximum 10 Gy and also used the WST-1 assay for all the evaluations, they believe that the effects of γ- and α-particle irradiations are comparable. It is also important to have control of the cell number and time of measurement when using a tetrazolium-based method. 28 In this study, where the absorbed doses for several cell lines were examined, they chose the WST-1 assay instead of colony forming because it was relatively easy to use and also more operator independent. By using a tetrazolium assay, it was possible to obtain survival fraction data for a large sample throughput in less time, and with less effort, compared to a colony-forming assay.
Repair of double strand breaks
Regarding the results of the inherent radiation sensitivity and levels of surviving fractions for different levels of absorbed dose, it is interesting that the cells' ability to deal with the damages caused by the α-particles seems to differ to some degree between the cell lines used in this study (Fig. 6a–f). When α-particles pass through a cell, double strand breaks (DSBs) in the cell's nucleus are supposed to be the major cause of cell death. The two major mechanisms by which mammalian cells are able to repair such DSBs are through homologous recombination (HR) or nonhomologous end joining (NHEJ). A deficiency in promoting HR and/or NHEJ would mean a decreased ability to deal with DSBs. In this study, DU145, Capan-1, and Panc-1 were the least radio-resistant cells when exposed to α-particles, with RBEs (and coefficients in the monoexponential equations in parenthesis) equal to 8.0 ± 0.8 (−1.864), 12.5 ± 1.6 (−2.968), and 9.4 ± 0.9 (−2.006), respectively. For at least one of the cell lines (Capan-1), a plausible explanation for this is that a mutation in BRCA2 influences the cells' ability to promote HR. 29 At the same time, BRCA2 promotes the HR pathway (through the effector protein Rad51), but has no impact on NHEJ (unlike BRCA1, which is involved in both the HR and NHEJ pathways), and has also been shown to be mutated in ∼10% of pancreatic cancers. 30 In addition, regarding prostate cancer mutations in BRCA2, it has previously been shown to be present as well as influencing early-onset prostate cancer. 31 –33 An interesting follow-up study would be to quantify the level of mutations in BRCA2 in the cell lines used in this article and to correlate the level of mutation with the cell lines' sensitivity to α-particle irradiation.
Conclusions
This study shows that it is possible to construct a bench-top easy to use external α-particle irradiator for use in radiation sensitivity experiments. Once calibrated, the α-particle irradiator can be used repeatedly with no extra calibration needed, due to the long half-life of 241Am. Furthermore, dosimetry can be performed with MC simulations. The results clearly show that irradiating cancer cells by α-particles has a significantly more lethal effect compared to 137Cs irradiations. Especially, Capan-1 cells show a particularly high sensitivity for α-particle irradiation, with an RBE = 12.5 and a coefficient in the monoexponential function describing the effect of this type of radiation equal to 2.97. Although it is difficult to draw any conclusions regarding the α/β ratio in the bi-exponential curve fit for the 137Cs irradiations and compare with clinical values defining early and late responding tumor tissues, the authors still believe it is valuable to state these ratios as a comparison between the cells in this study.
There are always uncertainties accompanied with these kinds of studies. With respect to uncertainties in the measured exposure time during the α-particle irradiations, estimations of the diameter of the cell nucleuses, and fluctuations in the uniformity of the α-particle source, the authors estimate that the calculated absorbed dose varies at a maximum of ±10% from a true value. Hence, they believe the conclusions drawn from the experiments are still valid under the circumstances stated. The overall results indicate that both prostate and pancreatic cancer are very good candidates for further studies of RIT using specific mAbs labeled with relevant α-particle emitters. Interesting potential upcoming studies include investigating the role of BRCA2 for HR after α-particle exposure and also performing microbeam studies for the cell lines investigated here.
Footnotes
Acknowledgments
Crister Ceberg is acknowledged for help with the dosimetry film during the uniformity measurements of the 241Am source. Erik Larsson is acknowledged for help during the HPGe measurements of the source. The fixture and source holder were skillfully constructed by Sven Brink. This study was performed with generous support from the Swedish Cancer Foundation, Mrs. Berta Kamprad's Foundation, and Gunnar Nilsson's Foundation.
Disclosure Statement
No competing financial interests exist.