




Abstract
We aimed to determine the effects of the inhibition of enhancer of zeste homolog 2 (EZH2) gene expression on the cisplatin resistance of the human ovarian cancer cell line, SKOV3/DDP, and to identify the underlying mechanisms. SKOV3/DDP cells were stably transfected with pSUPER-EZH2 (EZH2 RNA interference plasmid) or pcDNA3.1-EZH2 (EZH2 gene overexpression plasmid) using the lipofection method. Real-time fluorescence quantitative reverse transcription polymerase chain reaction and western blotting confirmed that EZH2 expression was downregulated in pSUPER-EZH2-transfected cells. Flow cytometry revealed that EZH2 inhibition did not induce apoptosis, but significantly inhibited autophagy. In addition, it significantly increased the expression of the cellular senescence-signaling proteins p14ARF, p16INK4a, p53, pRb, and p21, and significantly decreased the expression of cyclin-dependent kinase (CDK)1, CDK2, and H3K27me3. Cellular senescence was characterized by a significant increase in the G0/G1 ratio and the restoration of sensitivity to cisplatin in the drug-resistant cells. These findings suggest that interfering with EZH2 expression can inhibit SKOV3/DDP cell autophagy and reverse resistance to cisplatin. The underlying mechanisms could be associated with the regulation of the cellular senescence-signaling pathway.
Introduction
Autophagy is the process of cell degeneration through lysosomal damage to the macromolecular substances or organelles within cells. One of the major roles of this process is to maintain a precise balance of synthesis, degeneration, and recycling in cells. The association between autophagy and the development/progression of malignancy is a hotspot research topic all over the world. Recently, some studies have shown that abnormal autophagy is responsible for the resistance of tumors to chemotherapy. 1,2 Thus, the regulation of autophagy may be a novel strategy for tumor treatment.
Ovarian cancer, a common gynecological malignancy, has the highest mortality rate among all female reproductive-system tumors. A gradual increase in the chemotherapeutic resistance of ovarian cancer cells is an important cause of tumor progression. The first choice of treatment for ovarian cancer is aggressive surgical cytoreduction along with cisplatin-based chemotherapy. Enhancer of zeste homolog 2 (EZH2), a key member of the polycomb group family of proteins, plays a vital role in gene silencing and transcription inhibition through the trimethylation of H3 (Histone3) on K27 (Lysine27). 3 EZH2 is highly expressed in several malignant tumors and has been considered to be a cancer-promoting gene that stimulates the development and progression of cancers. 4,5 Some studies have previously demonstrated that EZH2 is essential for chemotherapy resistance in cisplatin-resistant cancer cells and EZH2 knockdown can enhance chemosensitivity. 6,7 However, whether EZH2 can reverse the cisplatin resistance of ovarian cancer is unclear. This study aimed to determine the effects of EZH2 on cisplatin resistance through RNA interference to further explore the underlying mechanisms.
Materials and Methods
Materials and reagents
The cisplatin-resistant human ovarian cancer cell line SKOV3/DDP was purchased from Beijing Cancer Hospital. RPMI-1640 culture medium was bought from Gibco. G418, Lipofectamine 2000, and Trizol were obtained from Invivogen. Rabbit antihuman EZH2 and H3K27me3 monoclonal antibodies as well as goat antirabbit IgG secondary antibody were purchased from Cell Signaling Technology. Rabbit antihuman p14 polyclonal antibody was obtained from Santa Cruz BioTechnology, whereas monoclonal antibodies such as rabbit antihuman p16, p21, p53, pRb, cyclin-dependent kinase (CDK)1, CDK2, and β-actin were obtained from Abcam. The BCA protein quantification kit was purchased from Pierce. A reverse transcription kit and SYBR Green Real-time polymerase chain reaction (PCR) Master Mix were obtained from Toyobo Company. PCR primers were synthesized by Yingjun Biotechnology Co. Ltd.. The Senescence β-galactosidase staining kit was bought from Biyuntian Biotechnology Co. Ltd.. Monodansylcadaverine (MDC, an autophagosome-specific fluorescent dye), 3-(4,5-dimethylthiazol-2-yl)-2,5-diphenyltetrazolium bromide (MTT), and dimethyl sulfoxide (DMSO) were bought from Sigma. Annexin V/propidium iodide (PI) apoptosis and cell cycle kits were purchased from Kaiji Biotechnology Co. Ltd. Cisplatin was procured from Qilu Pharmaceutical Factory.
Culture of SKOV3/DDP cells and transfection
We cultured SKOV3/DDP cells in RPMI-1640 medium supplemented with heat-inactivated 10% fetal bovine serum, 100 U/mL penicillin, and 100 μg/mL streptomycin at 37°C in an atmosphere containing 5% CO2. The cells were seeded into 6-cm Petri dishes (5 × 10⁵ cells per well) and stably transfected at 80% confluence with either pcDNA3.1-EZH2 (EZH2 gene overexpressed) or pSUPER-EZH2 transfectants (EZH2 gene partially silenced) using Lipofectamine 2000 reagent, as described by the manufacturer. At 1 day, we used 600 μg/mL G418 to screen for positive colonies. Selection was continued for 7 days, with the medium refreshed every other day. The pSUPER-EZH2 vector presents green fluorescence, and cells carrying green fluorescence were regarded as positive, indicating successful transfection. Clones were isolated and EZH2 expression was confirmed by western blot analysis. Several clones were created by transfection in a manner similar to pcDNA3.1 (empty vector) and pSUPER (scramble RNA); the parental SKOV3/DDP cells were used as controls. Two plasmids encoding the human EZH2 gene, pSUPER-EZH2, and pcDNA3.1-EZH2 were synthesized by Ruibo Biotechnology Co. Ltd.. pcDNA3.1 and pSUPER were also obtained from Ruibo Biotechnology Co. Ltd. The recombinant vectors were confirmed by digestion analysis of restriction endonuclease, and all the constructed plasmids were confirmed by DNA sequencing.
Detection of EZH2 mRNA
We extracted total RNA by using Trizol, and used 2 μg of the extracted RNA for reverse transcription (RT)-PCR. The RT-PCR experiments were performed in triplicate. The following primers were used: EZH2, 5′-GTTGGCGGAAGCGTGTAAAATC-3′ (forward), and 5′-TCCCTAGTCCCGCGCAATGAGC-3′ (reverse). The internal reference was β-actin, and the primers used were 5′-TGAACGGGAAGCTCACTGG-3′ (forward) and 5′-TCCACCACCCTGTTGCTGTA-3′ (reverse). PCR was performed under the following conditions: predenaturation at 94°C for 2 minutes; 45 cycles of denaturation at 94°C for 20 seconds, annealing at 55°C for 30 seconds, and extension at 60°C for 40 seconds; and a final extension at 72°C for 5 minutes. The increase in fluorescence intensity was measured and used to delineate the amplification curve, according to which the Ct value (which reflects fluorescence intensity) and ΔCt (Ctsample—Ctβ-actin) were determined. This was followed by analysis by the 2−ΔΔCt method. Target gene expression was normalized to the expression in the cells transfected with the empty control plasmid. The data represented the relative expression of the target genes.
Measurement of protein expression
Cells transfected with pcDNA3.1-EZH2, pSUPER-EZH2, pcDNA3.1, or pSUPER as well as untransfected cells were washed twice with precooled phosphate-buffered saline (PBS) and transferred to six-well culture plates. Cells in each well were lysed and collected with 100 μL radioimmunoprecipitation assay buffer and 1 μL phenylmethylsulfonyl fluoride, placed on ice for 30 minutes, and centrifuged at 4°C for 30 minutes. The supernatant, crudely named “total protein extract,” was assessed using the BCA method. Next, 50 μg total protein lysate was resolved using sodium dodecyl sulfate polyacrylamide gel electrophoresis and transferred onto polyvinylidene fluoride membranes by the semidry electrotransfer method. The membranes were blocked with 5% skimmed milk and 0.1% Tris-buffered saline (TBS) containing Tween 20 (TBST) for 1 hour, incubated overnight with the primary antibody at 4°C, and washed three times. Then, the membranes were incubated with the secondary antibody at room temperature (RT) for 1 hour and washed thrice with TBST and once with TBS. The membranes were developed by enhanced chemiluminescence on an X-ray film, and the band intensity was assessed using a gel imaging analysis system. The experiment was repeated three times.
Apoptosis measurement
Cells from each of the four transfection groups and the untransfected group were collected, washed twice with precooled PBS, and stained with annexin V/PI at RT for 15 minutes in the dark, according to the manufacturer's instructions. Cells positive for annexin V and fluorescein isothiocyanate were analyzed using the FACScan™ flow cytometry system (Becton Dickinson), and the apoptosis rate was calculated using WinMDI2.8 software. The experiment was repeated three times.
Autophagy measurement
The cells in the six-well plate were incubated for 60 minutes with 0.05 mmol/L MDC at 37°C, fixed for 15 minutes with 4% paraformaldehyde, and washed twice with PBS. The cells were imaged with a fluorescence microscope. The intensity of fluorescence was measured using flow cytometry.
β-Galactosidase staining
Cells from each of the five study groups were collected and washed once with PBS. Then, 1 mL staining-fixation was added into each well. The cells were fixed for 15 minutes at RT and washed thrice with PBS, for 3 minutes each time. They were then incubated overnight at 37°C, and cell senescence was analyzed using an inverted microscope.
Cell cycle analysis
Untransfected cells and stably transfected cells were trypsinized, fixed with cold 70% ethanol, and stored at 4°C. For analysis, the cells were resuspended in 100 μL RNaseA (180 μg/mL) and incubated at RT for 30 minutes. Then, 50 μg/mL PI (final concentration) was added, and the cells were incubated at RT in the dark for a further 15 minutes. Their DNA content was analyzed using the FACScan flow cytometry system. The proportions of cells in the G0/G1, S, and G2/M phases were calculated from the data obtained using flow cytometry.
Cell growth curve
SKOV3/DDP cells in the pSUPER-EZH2, pSUPER, pcDNA3.1-EZH2, pcDNA3.1, and blank control groups were seeded into 96-well plates at a density of l × 105 cells/well. After 24 hours incubation, they were treated with 25.53 μmol/L cisplatin (the concentration known to achieve 50% SKOV3/DDP cell death in 48 hours), 8 and cell proliferation was measured at serial time points (every 12 hours for 48 hours). Four hours before the end of incubation, 20 μL MTT solution (5.0 mg/mL) was added to each well. Resulting crystals were dissolved in DMSO. An ELISA reader was used to measure the absorbance at 492 nm after shaking the cells for 15 minutes. Five replicates were measured in each group, and the mean value was calculated. The experiment was repeated three times.
Statistical analysis
We used SPSS 13.0 software to perform statistical analyses. One-way analysis of variance was used for between-group comparisons. Data are expressed as means and standard divisions. p < 0.05 was considered statistically significant.
Results
EZH2 expression in transfected cells
SKOV3/DDP cells transfected with recombinant plasmids and monoclonal cells with stable expression were screened and then subjected to RT-PCR and western blotting to analyze changes in EZH2 expression. After RT-PCR and delineation of the kinetic curves after PCR amplification, the relative EZH2 expression was calculated. Compared with the blank control group, the pcDNA3.1-EZH2 group showed significantly higher EZH2 expression, whereas the pSUPER-EZH2 group showed significantly lower EZH2 expression (Table 1). Western blot analysis showed consistent results, that is, increased EZH2 expression in the pcDNA3.1-EZH2 group and decreased EZH2 expression in the pSUPER-EZH2 group (Fig. 1).
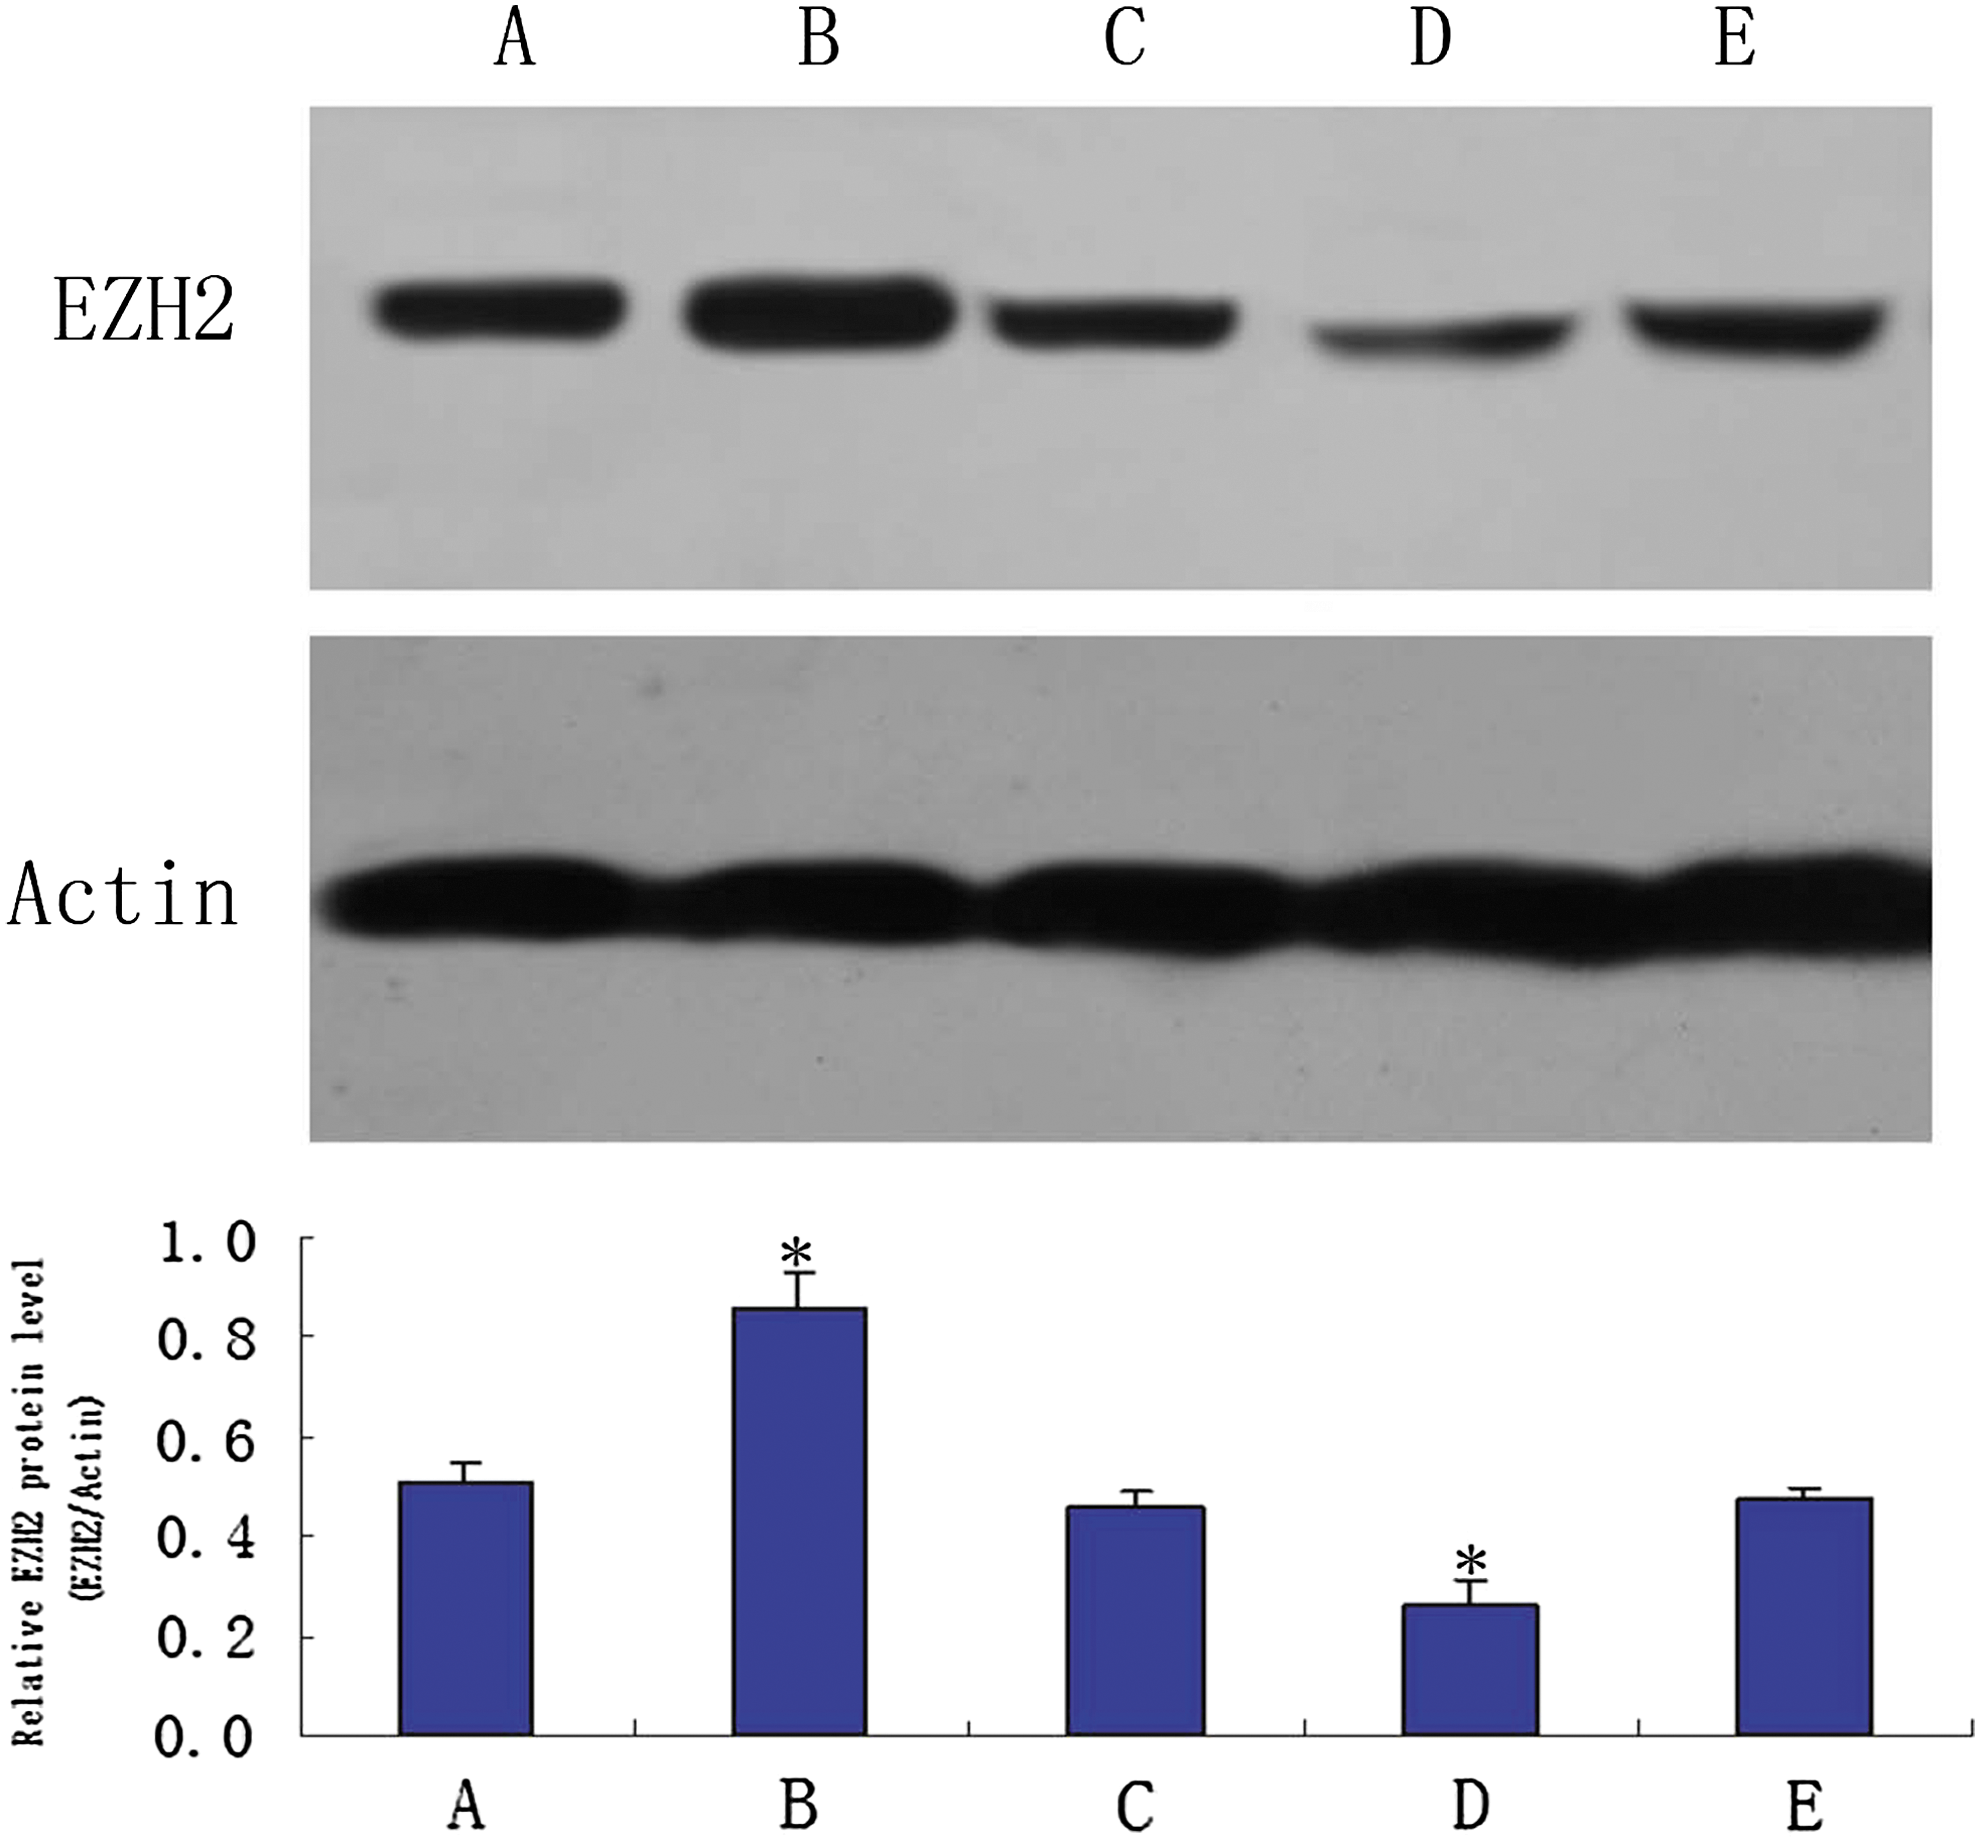
EZH2 protein expression was analyzed in transfected SKOV3/DDP cells. *p < 0.05 compared with the blank control SKOV3/DDP cells. A, SKOV3/DDP; B, pcDNA3.1-EZH2; C, pcDNA3.1; D, pSUPER-EZH2; E, pSUPER. EZH2, enhancer of zeste homolog 2.
Asterisks denote values that were significantly different from the SKOV3/DDP cells (p < 0.01).
EZH2, enhancer of zeste homolog 2; RT-PCR, reverse transcription-polymerase chain reaction.
Relationship between decreased EZH2 expression and SKOV3/DDP cell apoptosis
The rate of cell apoptosis in the pSUPER-EZH2 group (5.3% ± 1.9%) did not significantly differ from the rates in the blank control group (5.1% ± 1.6%) and the pcDNA3.1-EZH2 group (4.6% ± 1.6%) (p > 0.05), suggesting that inhibition of EZH2 expression did not induce apoptosis in SKOV3/DDP cells (Fig. 2).
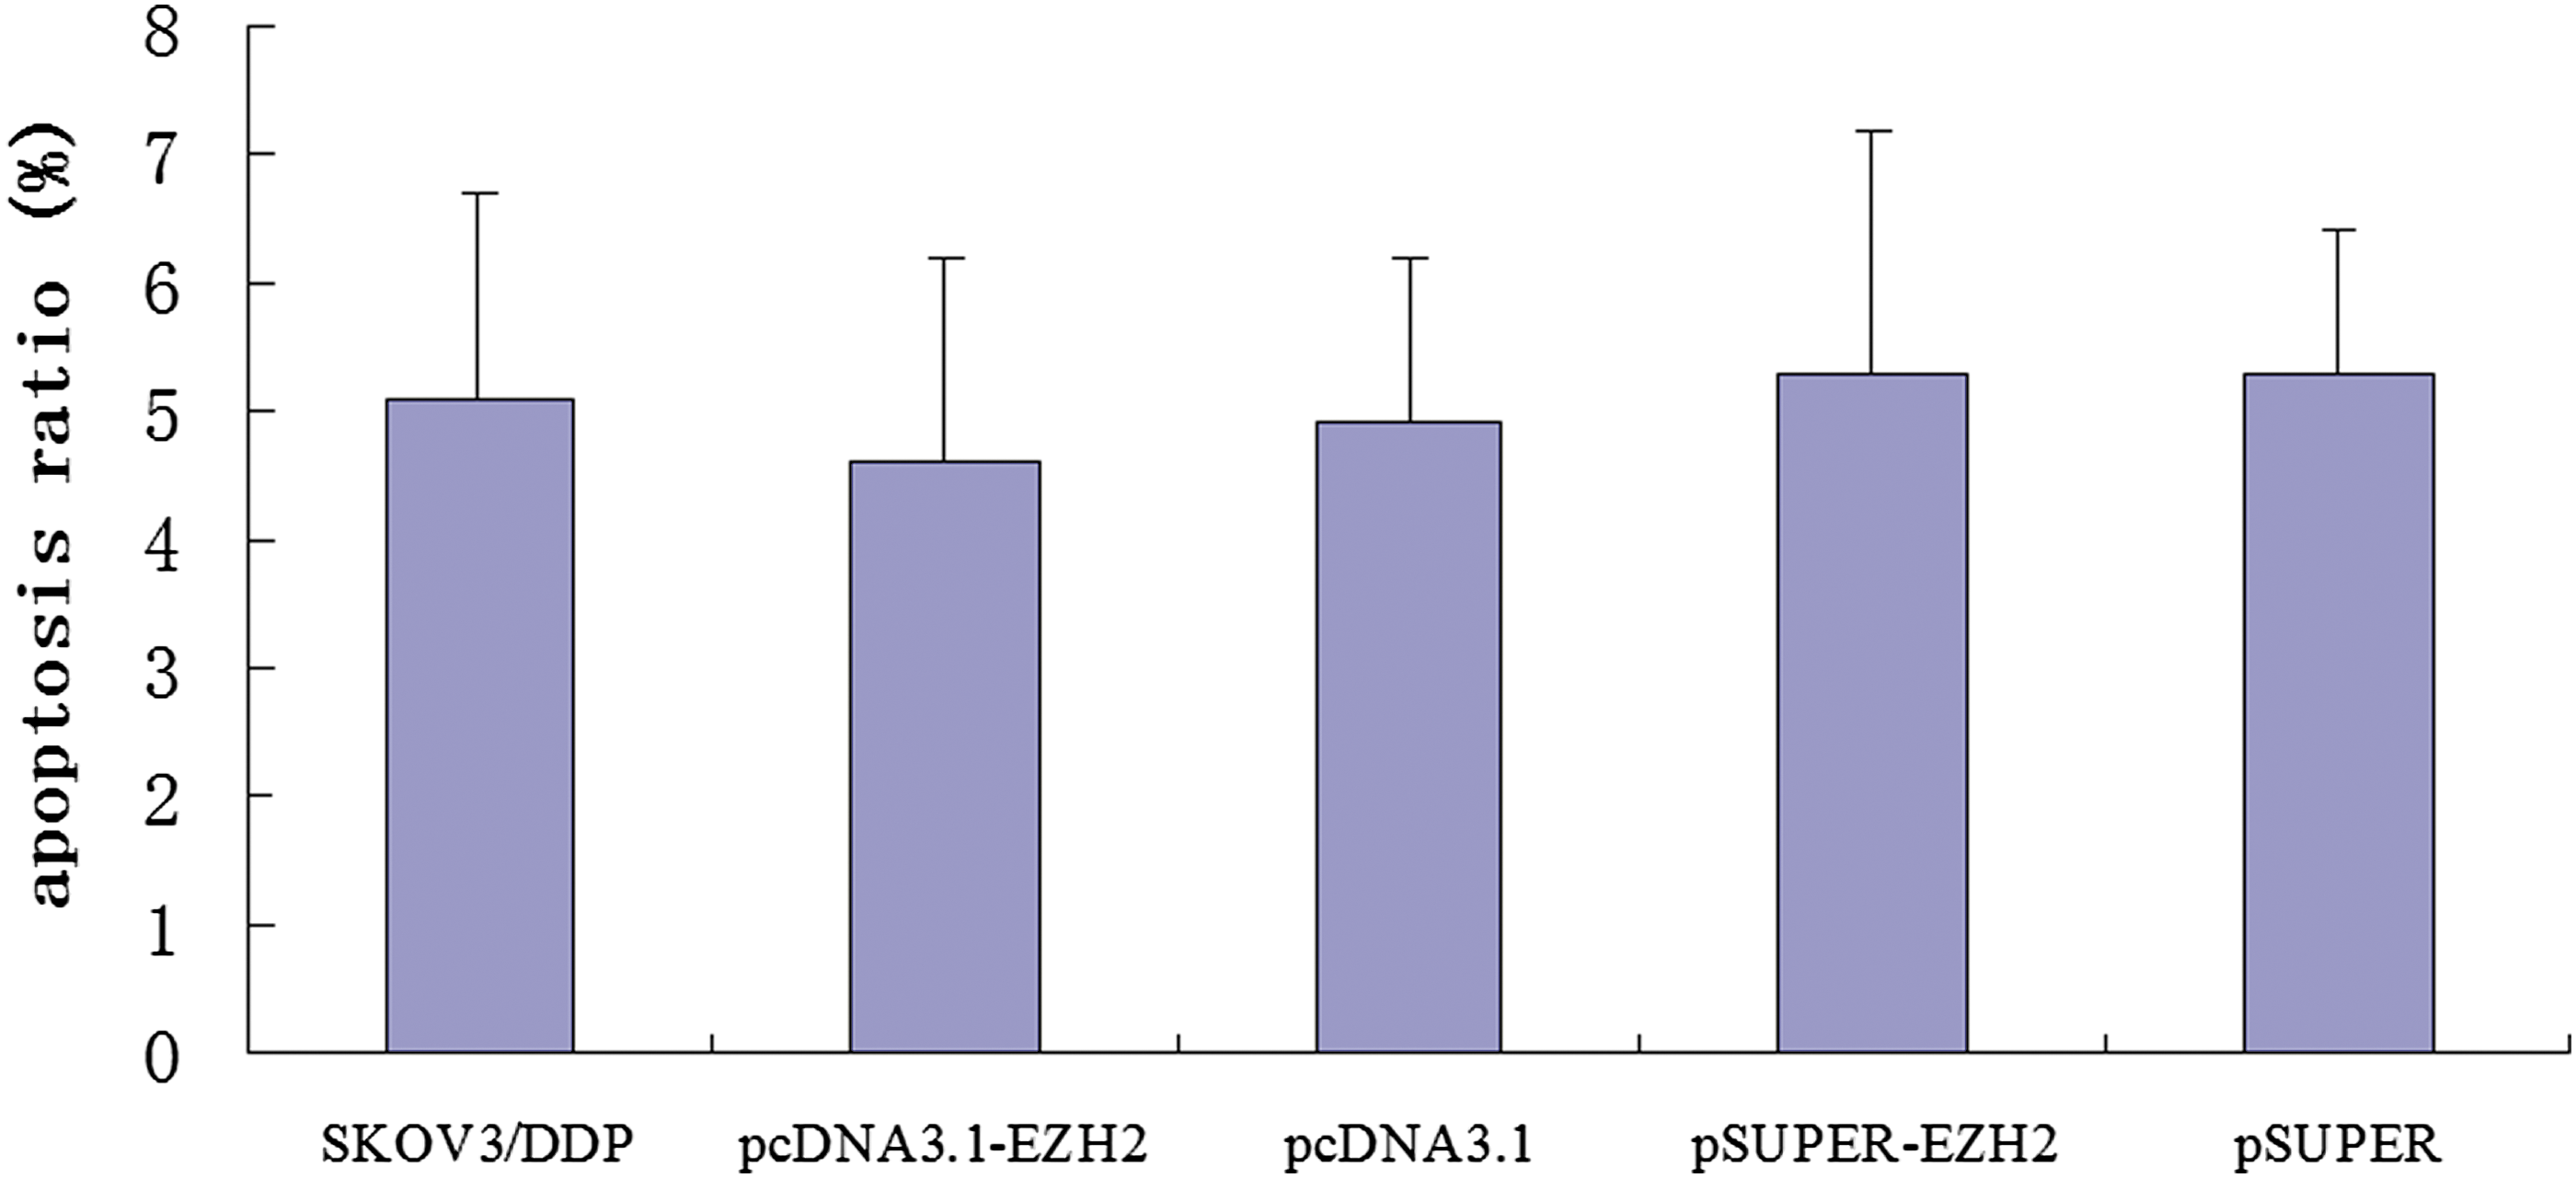
Percentage of apoptosis in transfected SKOV3/DDP cells.
Relationship between decreased EZH2 expression and SKOV3/DDP cell autophagy
Flow cytometric analysis revealed that the rate of autophagy of SKOV3/DDP cells was significantly lower in the pSUPER-EZH2 group (3.3% ± 1.9%) than in the blank control group (6.2% ± 2.2%, p < 0.05), but the differences were not significant in the pcDNA3.1-EZH2 group (6.8% ± 3.1%) and in the blank control group (p > 0.05). This suggested that the inhibition of EZH2 expression reduced autophagy among SKOV3/DDP cells (Fig. 3).
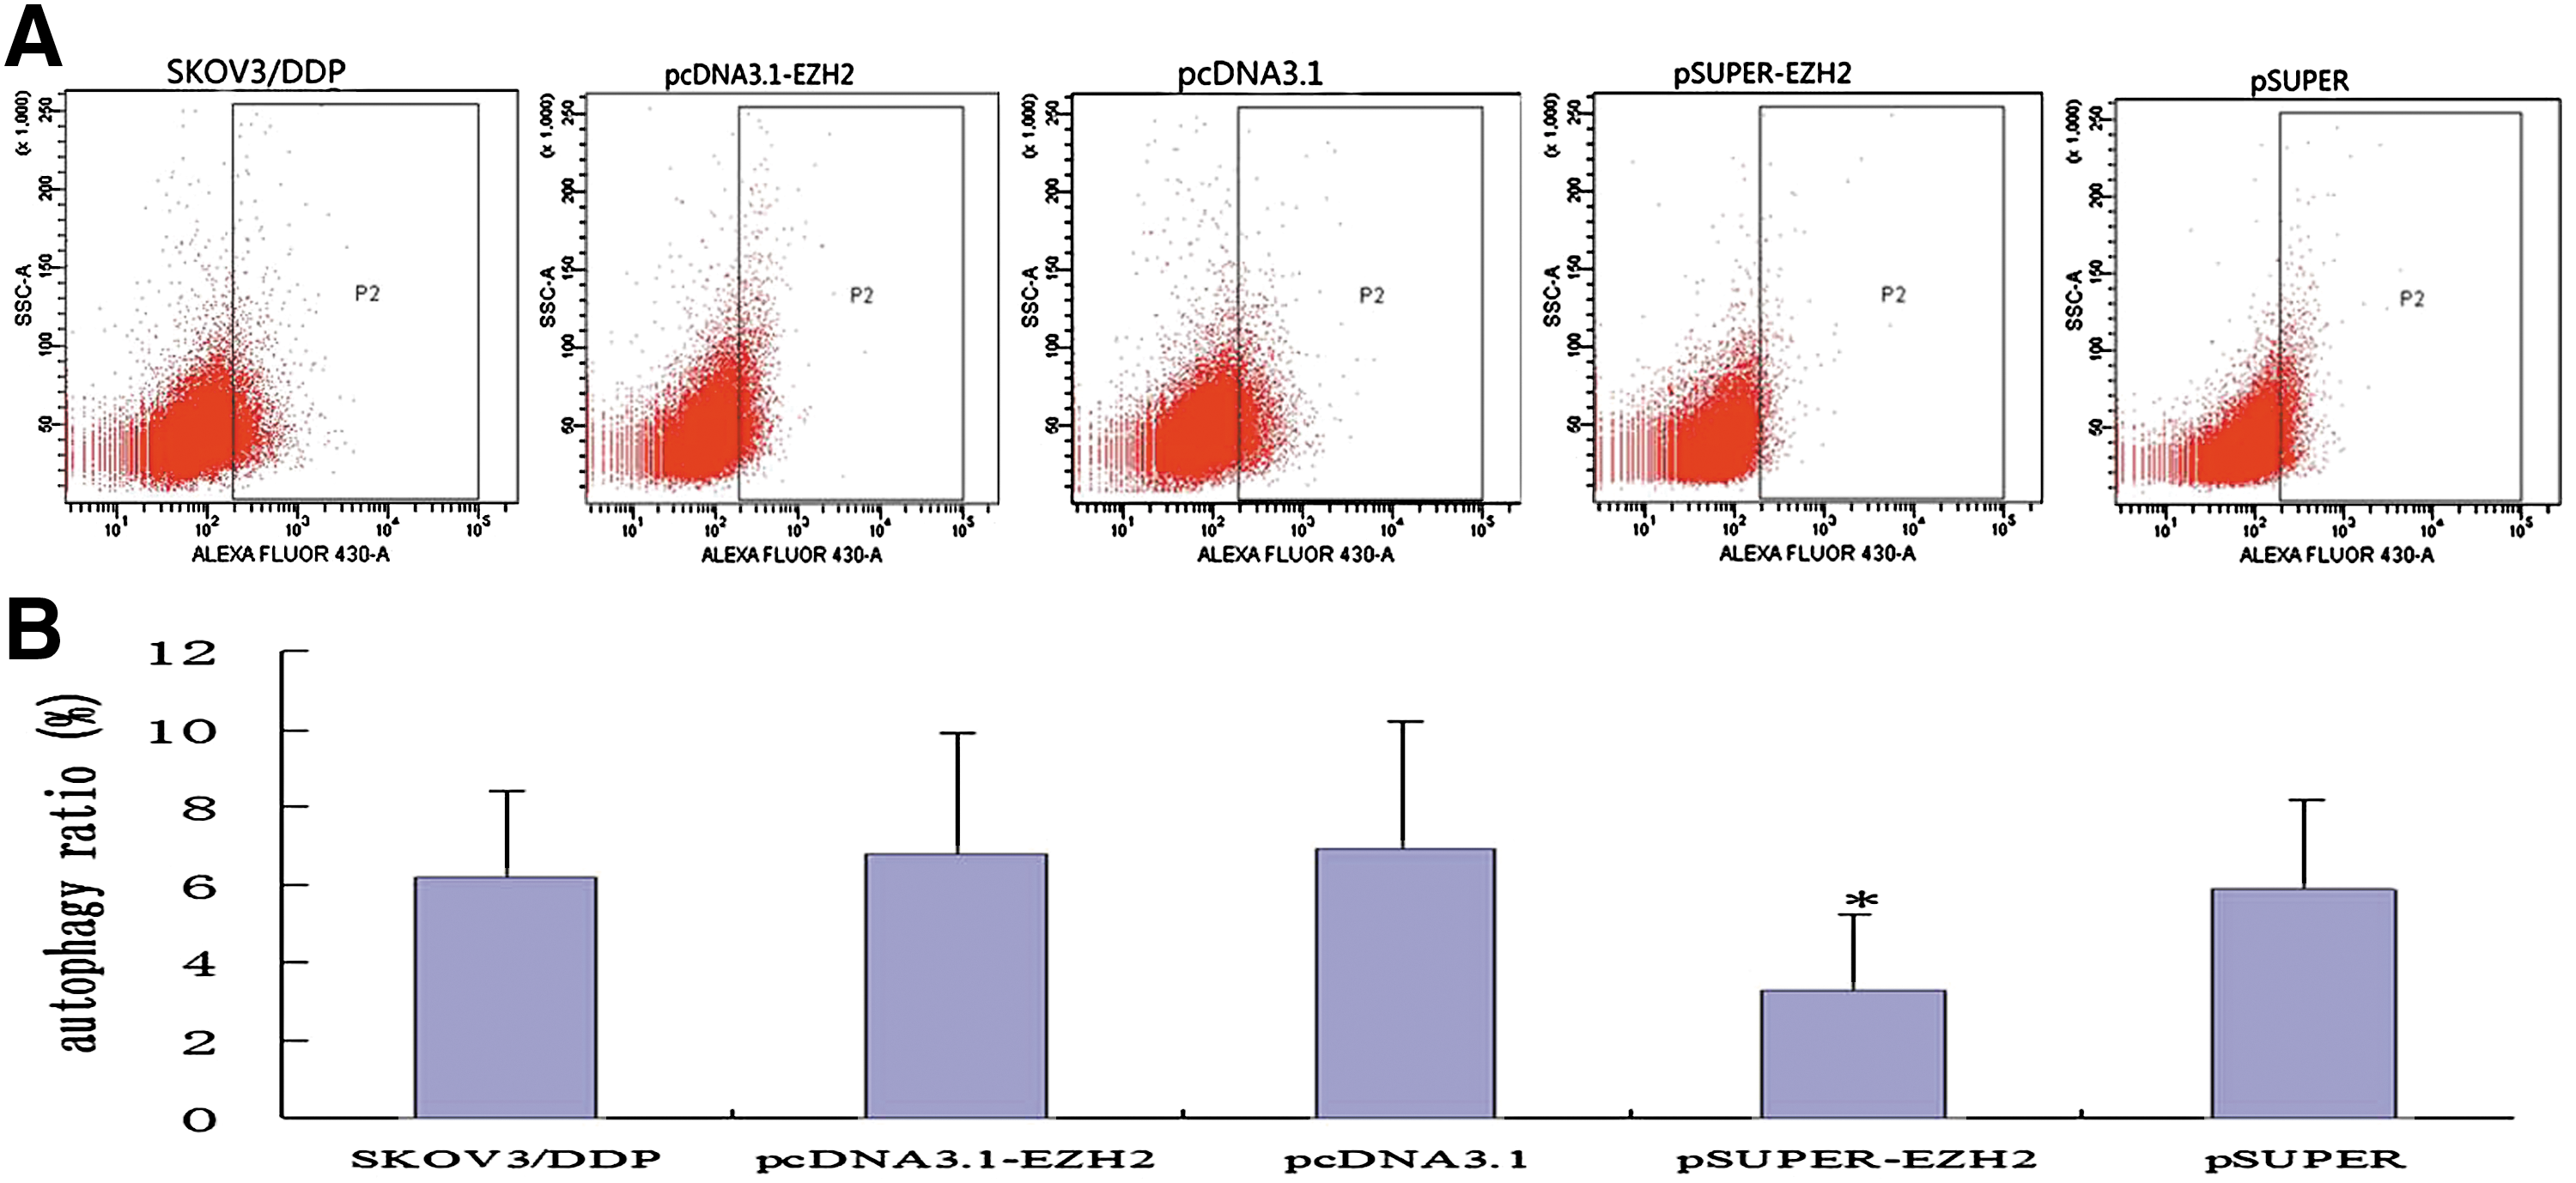
Relationship between decreased EZH2 expression and cell cycle protein regulation
The inhibition of EZH2 expression resulted in decreased CDK1 and CDK2 expression in the G1/S phase and increased p21 expression (Fig. 4). This indicated that EZH2 could regulate cell cycle progression.

Effect of pSUPER-EZH2 transfection on expression of CDK1, CDK2, and P21 in SKOV3/DDP cells. A, SKOV3/DDP; B, pSUPER-EZH2; C, Psuper. CDK, cyclin-dependent kinase; EZH2, enhancer of zeste homolog 2.
Relationship between decreased EZH2 expression and H3K27me3 and cellular senescence-related genes
The inhibition of EZH2 expression significantly downregulated H3K27me3 expression and upregulated p14, p16, p53, and pR protein expression (Fig. 5). This suggested that EZH2 inhibition led to the activation of the INK/ARF/Rb pathway and, thereby, induced cellular senescence. Furthermore, microscopic analyses revealed the following morphological changes in the SKOV3/DDP cells in the pSUPER-EZH2 group: increased cell volume, flat granules, and β-galactosidase staining (blue), which are characteristics of cellular senescence. These changes were not observed in the blank control group (Fig. 6).
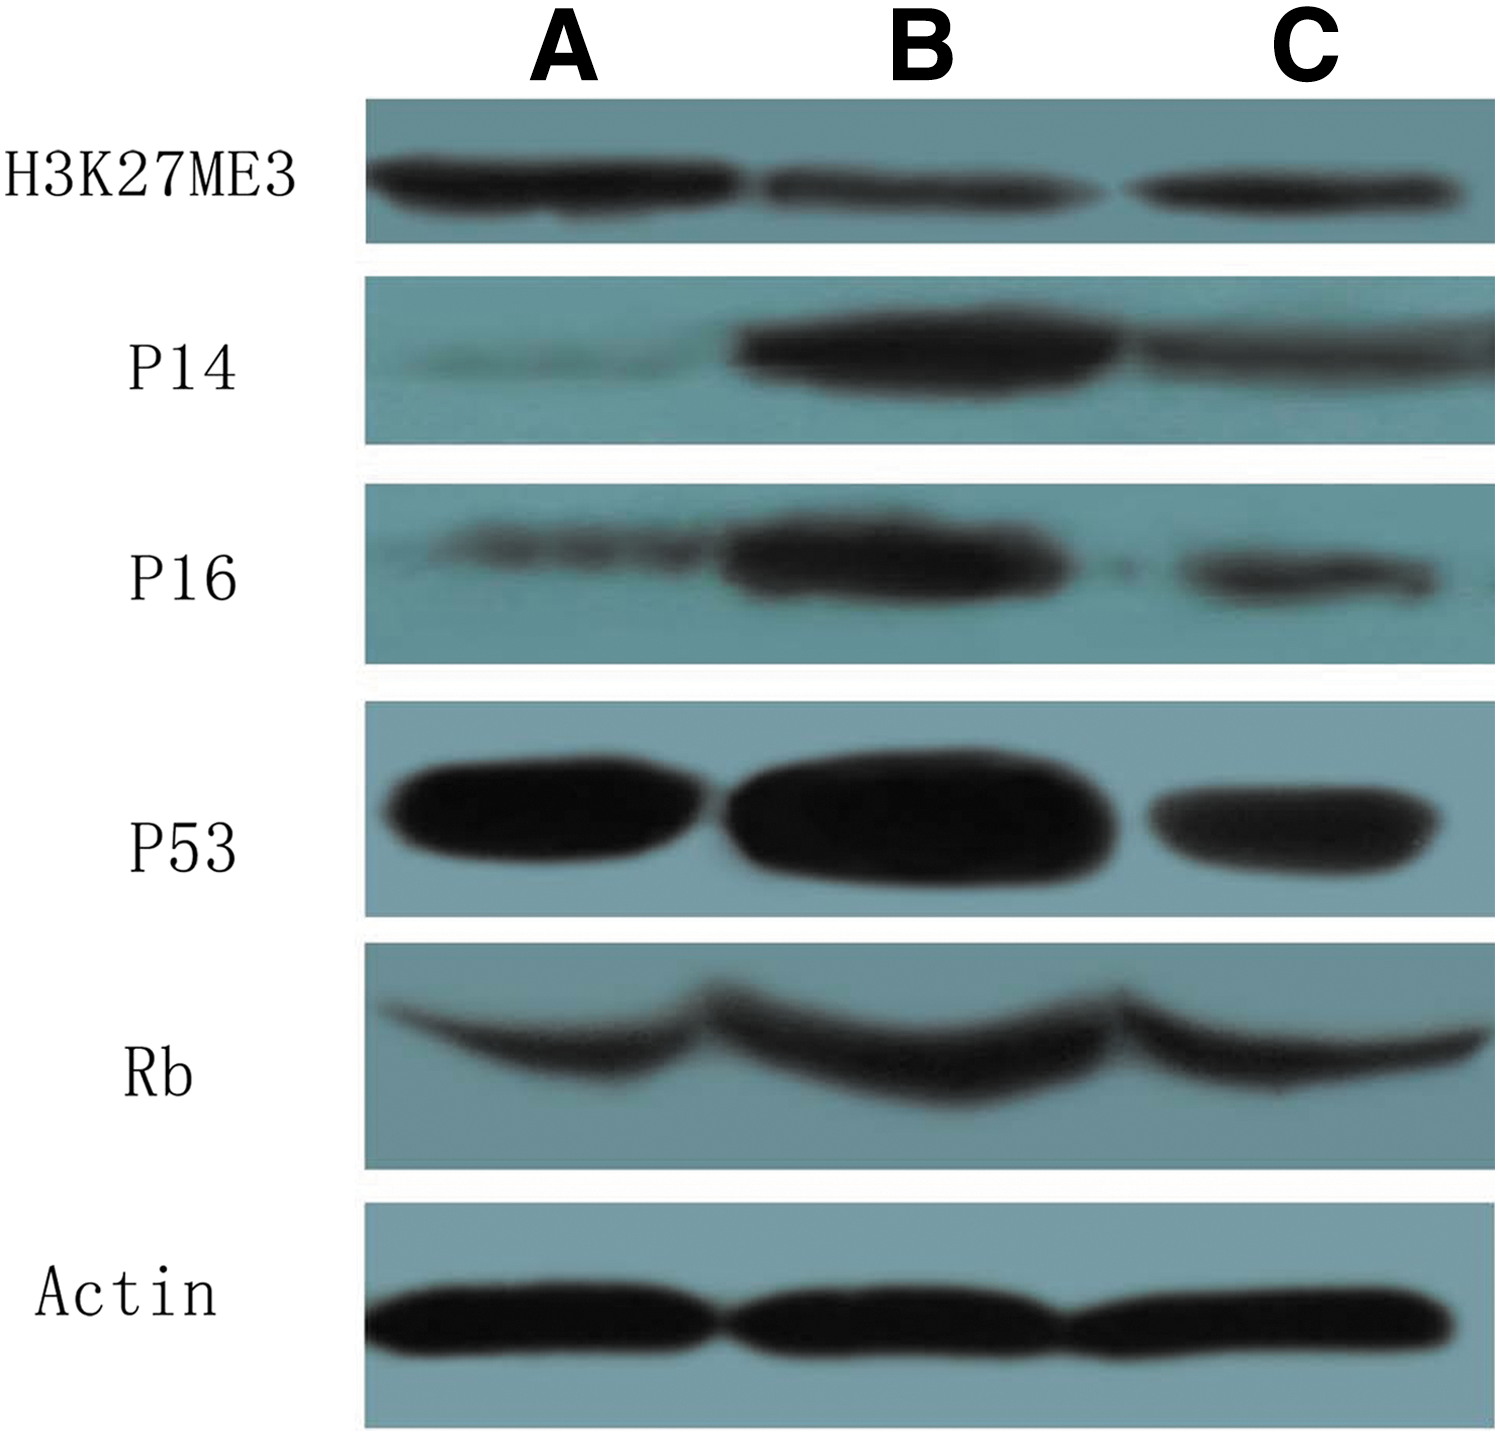
Effect of pSUPER-EZH2 transfection on expression of H3K27me3, P14, P16, P53, and Rb in SKOV3/DDP cells. A, SKOV3/DDP; B, pSUPER-EZH2; C, pSUPER. EZH2, enhancer of zeste homolog 2.
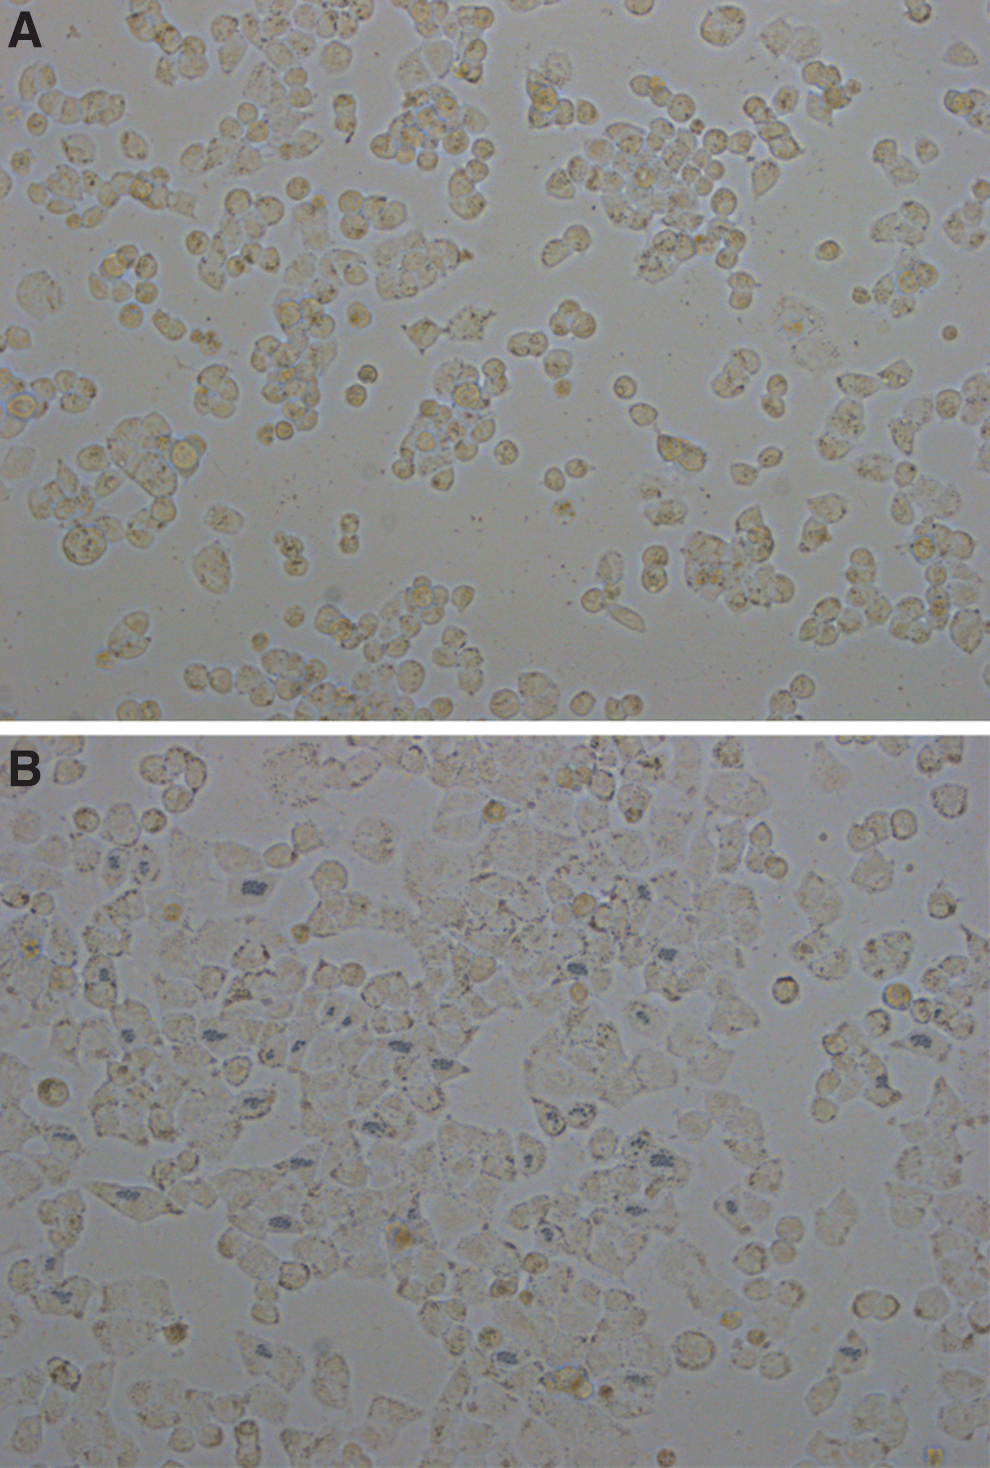
Effect of pSUPER-EZH2 on senescence of SKOV3/DDP cells ( × 200).
Relationship between EZH2 and the SKOV3/DDP cell cycle
We assessed the effects of EZH2 on the SKOV3/DDP cell cycle by performing each assay in triplicate. The percentage of cells in the G0/G1 phase was significantly higher in the pSUPER-EZH2 group (61.3%) than in the blank control group (46.8%, p < 0.05; Table 2). In addition, the percentage of cells in the S phase was significantly lower in the pSUPER-EZH2 group (26.3%) than in the blank control group (37.2%, p < 0.05; Table 2). This indicated that EZH2 downregulation induced cell cycle arrest in the G0/G1 phase.
Asterisks denote values that were significantly different from the SKOV3/DDP cells (p < 0.05).
EZH2, enhancer of zeste homolog 2; SD, standard deviation.
Relationship between EZH2 downregulation and cisplatin sensitivity
The rate of SKOV3/DDP cell proliferation in the pSUPER-EZH2, pSUPER, pcDNA3.1-EZH2, pcDNA3.1, and blank control groups was evaluated using MTT assays. The cells in each group were treated with 25.53 μmol/L cisplatin for 12, 24, 36, and 48 hours. The percentage of viable cells was estimated against the duration of cisplatin treatment on a growth curve (Fig. 7). The cell proliferation rate was significantly lower in the pSUPER-EZH2 group than in the pcDNA3.1-EZH2 and blank control groups (p < 0.05) after cisplatin treatment. The proliferation rates in the pSUPER and pcDNA3.1 groups did not significantly differ from the rate in the blank control group (p > 0.05). The percentages of viable cells in the pSUPER-EZH2, pcDNA3.1-EZH2, and blank control groups were 51.5%, 68.2%, and 65.3%, respectively, after cisplatin treatment for 24 hours. These rates decreased to 38.6%, 50.3%, and 49.2%, respectively, after cisplatin treatment for 48 hours. MTT assay shows that cisplatin 48 hours IC50 value has been decreased to 18.86 μmol/L in the pSUPER-EZH2 cells. The results indicate that cisplatin becomes effective at lower doses after interfering EZH2 expression in SKOV3/DDP cells.
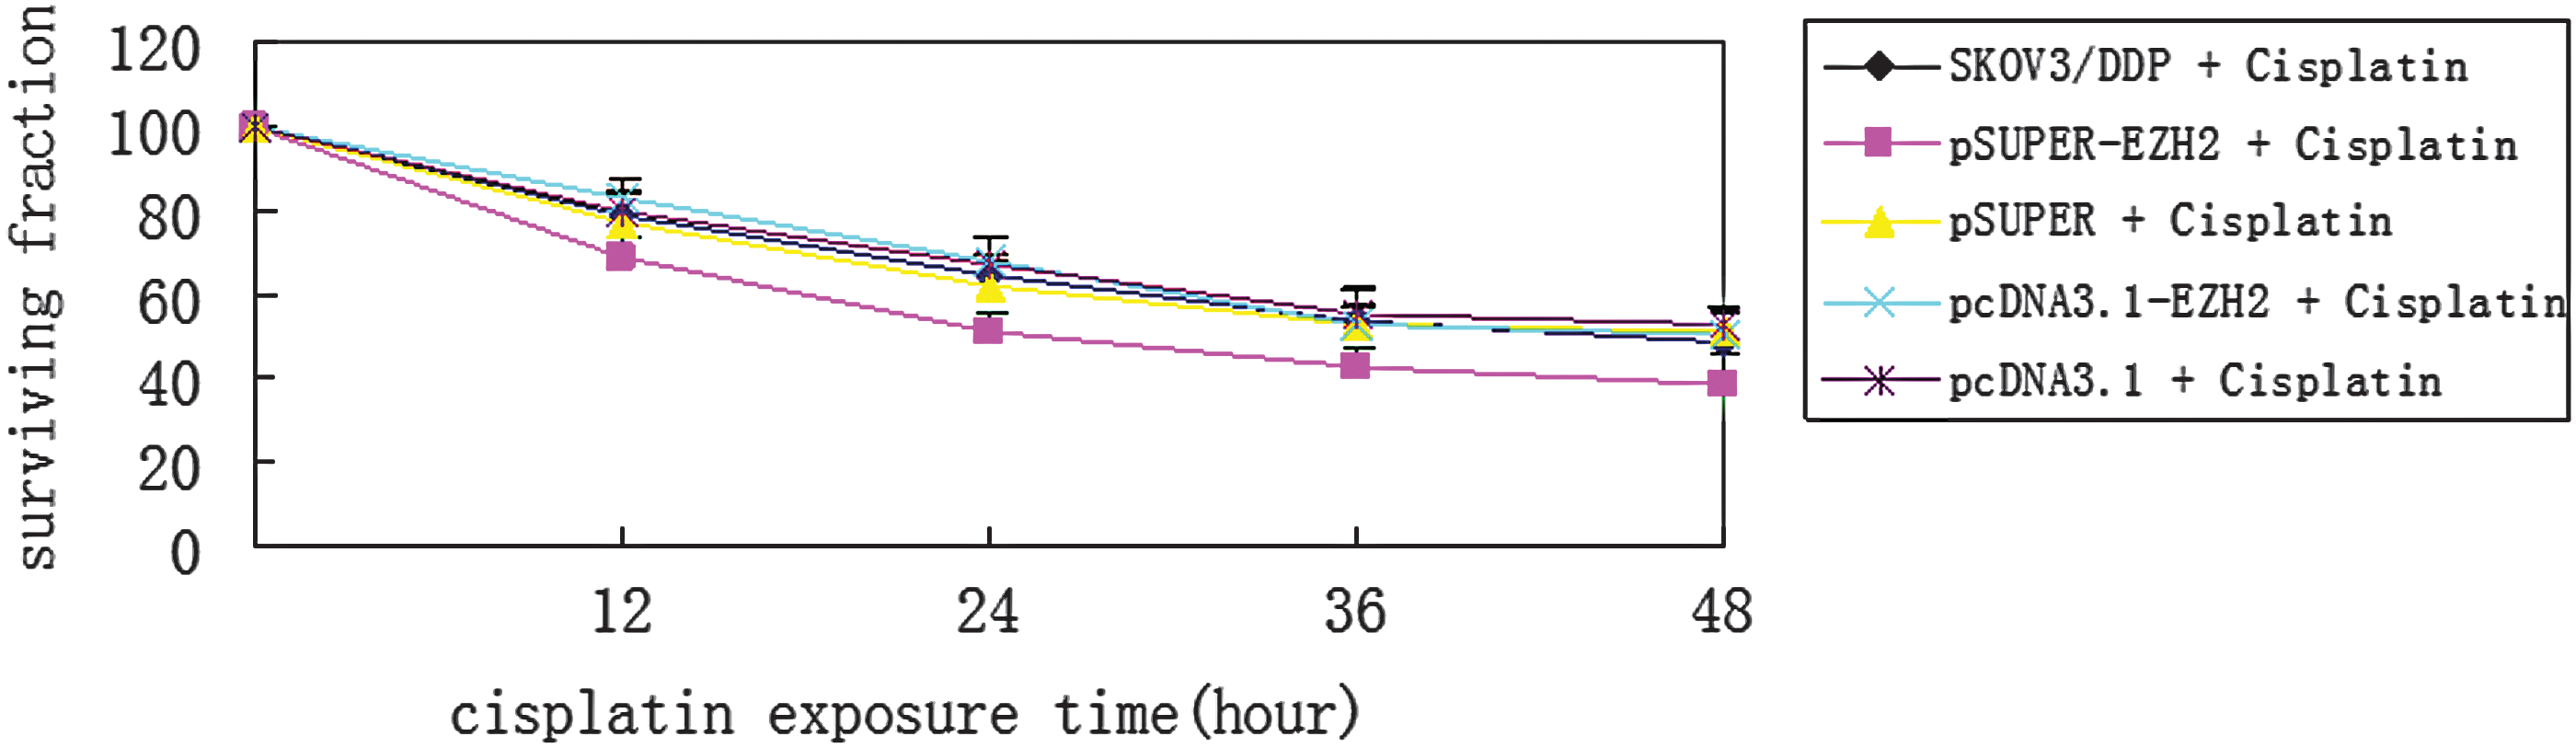
Effect of EZH2 on the cell-surviving fraction of SKOV3/DDP cells. EZH2, enhancer of zeste homolog 2.
Discussion
Cellular senescence is an irreversible biological state wherein cells lose their ability to proliferate owing to the loss of reactivity to mitogens. This is mainly brought about by cell cycle arrest induced by senescence-causing factors. Although the cells retain basic metabolic abilities and can survive for a certain time after aging, their morphology and functions are markedly changed. As the lysosomal content increases in the aged cells, the level of β-galactosidase also increases. Thus, senescent cells can be stained blue by β-galactosidase staining. This feature has been used as a marker for the identification of cellular senescence. Studies have shown that the inhibition of chemotherapy-induced senescence is a major feature of tumor cells, and it is also one of the major mechanisms of multidrug resistance in cancer cells. 9,10 This resistance may be reversed if the ability to reach senescence is restored.
Cellular senescence is mainly induced by the INK4a/ARF/Rb pathway. 11,12 INK4a/ARF encodes two important tumor suppressor genes P16INK4a and P14ARF, which induces the cellular senescence through regulating Rb and P53, respectively. P16INK4a is the suppressor of CDK1 and CDK2. The combination of CDK1 and CDK2 with p16INK4a could result in the allosterism of these two proteins, leading to the loss of cyclin D binding ability and mediating reduced Rb phosphorylation. In addition, p16INK4a promotes Rb and E2F interaction to produce reduced free E2F and, thus, arrests cells in the G1 phase, instigating senescence. p14ARF can bind to MDM2 and inhibit the ubiquitination of p53, thereby inhibiting p53 degeneration and increasing p21 expression, resulting in G1/S phase arrest and inducing cellular senescence. 13
EZH2 is a specific methylation transferase for lysine 27 on histone H3 (H3K27). EZH2 regulates the methylation of this histone, and is thus widely involved in the transcriptional silencing of genes. The most prominent effect of H3K27me3 in the promoter of the INK4a/ARF locus is inhibition of the expression of p16INK4a and p14ARF and maintenance of cell growth and proliferation. This study showed that the partial silencing of EZH2 expression in SKOV3/DDP cells significantly increased their sensitivity to cisplatin, suggesting that increased EZH2 expression is closely associated with cisplatin resistance in ovarian cancer cells. Some other studies have also previously demonstrated the effect of EZH2 silencing on cisplatin-resistant ovarian cancer cells. 6,7 These findings present EZH2 as a new candidate that could possibly reverse the cisplatin resistance of ovarian cancer cells.
Autophagy is an important catabolic process in eukaryotes. It involves the degeneration of damaged macromolecular substances and organelles, and their recycling into energy and other basic substances needed by cells. Studies have shown that in almost all cells and tissues, decreased autophagy is closely associated with the aging phenotype and can aggravate age-related diseases. 14,15 Recent studies 16,17 have also reported that the expressions of multiple autophagy-related proteins are reduced in aged tissues, indicating that the rate of autophagy will further reduce with the progression of aging. These findings show that a decrease in autophagy is closely associated with aging and could result in the early occurrence of senescence.
The findings of this study showed that after partial EZH2 silencing, the percentage of cells in the G0/G1 phase significantly increased, and the percentage of cells in the S phase significantly decreased, suggesting G1/S cell cycle arrest. This could have been caused by the downregulation of p21 on CDK1 and CDK2. In addition, the downregulation of EZH2 expression significantly inhibited cellular autophagy, and the cells in the treatment group showed evident senescence characteristics. These findings suggest that partial EZH2 silencing not only inhibited cell autophagy but also induced cellular senescence.
Our previous studies have demonstrated the importance of abnormal autophagy in the sensitivity of tumors to chemotherapy and suggested that the regulation of autophagy-related proteins could be a new target for tumor treatment. 8,18 The findings of this study further demonstrated that EZH2 silencing not only inhibited cell autophagy but also significantly downregulated H3K27me3 and E2F1 protein expression, and upregulated p14ARF, p16INK4a, p53, and pRb protein expression. In summary, the present findings suggest that partial EZH2 silencing inhibits autophagy, activates the INK4a/ARF/Rb pathway, and induces cellular senescence. This could be an important mechanism through which the silencing of EZH2 expression reverses the resistance of SKOV3/DPP cells to cisplatin.
Footnotes
Acknowledgment
This project was supported by the Young Talents Key Projects of Fujian Provincial Health and Family Planning Commission (no: 2014ZQNZD4).
Disclosure Statement
No competing financial interests exist.