
Abstract
Objective:
This study was aimed to assess the efficacy of 99mTc-3PRGD2 imaging for evaluating both early treatment response to epidermal growth factor receptor tyrosine kinase inhibitors (EGFR-TKIs) and prognosis in advanced-stage lung adenocarcinoma.
Material and Methods:
Eighteen patients with lung adenocarcinoma were enrolled for EGFR-TKIs therapy. 99mTc-3PRGD2 SPECT/CT and planar imaging were performed pre- and post-therapy. The tumor to nontumor (T/NT) ratio and percentage change in T/NT ratio were assessed for the treatment response. Receiver operator characteristic (ROC) analysis was utilized to analyze the power of identifying responders based on the changes in T/NT ratios.
Results:
After treatment, 10 patients had partial response (PR), and 6 patients stable disease (SD), while 2 patients progressive disease (PD). The mean changes in T/NT ratios on SPECT/CT and planar images in PR group were 35.8% and 15.0% and in SD group were 8.9% and 0.7%, while in PD group were 76.1% and 18.7%, respectively. For ROC analysis, using a cutoff value of 23.8% decrease in T/NT ratio on SPECT/CT images, the sensitivity and specificity in identifying responders were 80.0% and 87.5%, respectively. The median progression-free survival (PFS) for patients with responders and nonresponders (on 99mTc-3PRGD2 SPECT/CT) was 18 months (95% CI 5.8–30.2 months) and 7 months (95% CI 5.2–8.8 months), respectively (p = 0.006).
Conclusion:
99mTc-3PRGD2 imaging can evaluate the early response to EGFR-targeted therapy and predict the PFS of lung adenocarcinoma patients.
Introduction
Lung cancer ranks the highest mortality among malignant tumors in the world, and nonsmall cell lung cancer (NSCLC) accounts for 85% of primary lung cancers. Most NSCLC patients are diagnosed at advanced stages and have a very low 5-year survival rate. 1 Epidermal growth factor receptor tyrosine kinase inhibitors (EGFR-TKIs) have become the first-line therapy of advanced NSCLC. EGFR-TKIs can block the tyrosine kinase domain of the EGFR and inhibit downstream signaling pathways involved in angiogenesis, cell proliferation, metastasis, and invasion. 2
Early determination of EGFR-TKIs treatment response can help physicians to make appropriate decisions for further treatment, so that costs of ineffective treatment and unnecessary toxicity can be avoided. CT is the most used conventional imaging modality to evaluate tumor response to EGFR-TKIs. 3 However, it provides only anatomical and morphological data, which often lag behind tumor functional changes. 4 Although 18 F-FDG PET/CT, which has the capability of visualization and quantification of tumor glucose metabolism, plays an important role in evaluation of early response to monitor EGFR-TKIs treatment in NSCLC, 5,6 its high cost and relatively low availability hamper its routine clinical use, especially in developing countries.
Integrins are an important family of cell surface receptors, which regulate cell signal transduction through configuration or expression levels, which influence the interactions between cells–cells and cell–matrix, and ultimately affect the growth, survival, differentiation, angiogenesis, metastasis, as well as apoptosis of tumor cells. 7 –10 Integrin αvβ3 with specifically high expression on tumor vasculature and tumor cells is an excellent target for targeted interventions. 11,12 Prior studies showed that αvβ3 was frequently overexpressed in lung adenocarcinoma and associated with some clinicopathologic variables that were known to have prognostic value in lung adenocarcinoma. 13 It was reported that RGD (Arg-Gly-Asp) peptide had the ability to specifically image αvβ3-positive tumor and monitor therapy response. 14,15
99mTc-3PRGD2 ([99mTc(HYNIC-3P-RGD2)(tricine)(TPPTS)]:HYNIC = 6-hydrazi nonicotinyl; 3P-RGD2 = PEG4-E[PEG4-c(RGDfK)]2; PEG4 = 15-amino-4,7,10,13-tetrao-xapentadecanoic acid; and TPPTS = trisodium triphenylphosphine-3,3′,3″-trisulfonate) was specifically designed to target integrin αvβ3. 16 Previous studies mainly focused on the diagnostic value of 99mTc-3PRGD2 SPECT image in the detection of lung cancer. 17 –22 The aim of this study is to explore the efficacy of 99mTc-3PRGD2 imaging in evaluation of both early response to EGFR-TKIs treatment and prognosis in patients with lung adenocarcinoma.
Materials and Methods
Patients and treatment
From May 2012 to December 2015, eighteen patients with primary lung cancer with lung nodules or masses greater than 1 cm in greatest diameter on CT images, activating EGFR mutations and planning to undergo EGFR-TKIs targeted therapy, were enrolled in this study. Of all patients, seven patients had exon 19 deletions mutations, 10 patients had exon 21 point mutations, and a single patient had both exon 18 and 20 mutations. All procedures of this study were approved by local ethics of The Fourth Hospital of Hebei Medical University, Hebei, China. Written informed consents were obtained from all patients who enrolled in the study. The clinical trial registration number was ISRCTN94329628. All patients were diagnosed with stage IV lung adenocarcinoma based on the pathological findings and clinical presentation according to WHO (World Health Organization) classification. 23 The status of gene detection mutation of each patient was also obtained. All patients did not have previous chemotherapies and started naive with first-line EGFR-TKIs therapy until disease progression. Of all 18 patients, 14 patients received Icotinib (125 mg, three times daily), three patients were treated with Erlotinib (150 mg, once daily), and one patient received Gefitinib (250 mg, once daily). The mean time of treatment between baseline and completion of the imaging procedures was 42.6 ± 4.9 days.
Radiopharmaceutical preparation
The 3PRGD2 kit containing 20 μg of HYNIC-3PRGD2, 6.5 mg of tricine, 38.5 mg of disodium succinate hexahydrate, 40 mg of mannitol, 12.7 mg of succinic acid, and 5 mg of TPPTS in 10 mL vial was produced by Medical isotope research center of Peking University. 99mTc labeling and quality control procedures were performed according the method of Jia et al. 24 The 3PRGD2 kit was kept at 4°C in the refrigerator. Before radiolabeling, the kit was brought to room temperature. One milliliter of Na99mTcO4 solution (1110–1850 MBq) in saline was added to the 3PRGD2 kit vial, after vortexing, the vial was heated at 100°C for 15–20 minutes, and then the vial was kept at room temperature for 5 minutes. The sample of the reaction mixture was analyzed by instant thin layer chromatography. The radiochemical purity was above 95.0%. The resulting solution was diluted to 370 MBq/mL with saline for further use. Each patient in this study was injected with 11.1 MBq of 99mTc-3PRGD2 per kilogram.
99mTc-3PRGD2 imaging
99mTc-3PRGD2 SPECT/CT and planar imaging were performed at baseline (day 0) and the day after 42.6 ± 4.9 days of therapy. The SPECT/CT scanner (NM670; GE Discovery) with dual detectors, equipped with low-energy high-resolution collimators, was used. 99mTc-3PRGD2 SPECT/CT and planar images were acquired with a 20% energy window centered on 140 keV. SPECT/CT scan of the chest and thoracic and whole-body planar scan were obtained at 1 hour after intravenous injection of 99mTc-3PRGD2. SPECT tomography scan (matrix 128 × 128 pixels, zoom 1.0, 30 s/frame/6°) was performed with patient in the arm up position, CT scan (120 kV, 160 mAs) followed with the same scan range of SPECT tomography. Thoracic planar scan was performed with 5 minutes and matrix 256 × 256 pixels. Whole-body planar scan was performed with a speed of 10 cm/minute and matrix 256 × 256 pixels. The imaging of each patient was analyzed using Xeleris 3.0 workstation (GE Healthcare).
Image analysis
Image interpretation was performed by at least two experienced nuclear medicine physicians without the knowledge of patient's clinical information. The largest diameter of primary lung lesions was measured on CT images. The tumor to nontumor (T/NT) ratios of primary lung lesions on 99mTc-3PRGD2 SPECT/CT and thoracic planar images were measured and calculated by the same person with the same standard. Briefly, in the analysis of 99mTc-3PRGD2 SPECT/CT images, a region of interest (ROI) was drawn over the tumor on axial SPECT/CT images and then a mirror ROI was selected in contralateral normal lung tissue as a control. The maximum count of ROI was acquired by Xeleris 3.0 software. The T/NT ratio on 99mTc-3PRGD2 SPECT/CT image was calculated by dividing the maximum count of the tumor ROI by the maximal count of the control ROI. For the analysis of 99mTc-3PRGD2 thoracic planar images, an ROI was set over the tumor and then a mirror ROI was selected in contralateral normal lung tissue as control. The T/NT ratio on thoracic planar image was calculated by Xeleris 3.0 software.
The percentage changes of diameter on CT images were calculated as follows:
ΔD% (CT) = (diameter before therapy − diameter after therapy)/diameter before therapy × 100%.
The percentage changes in T/NT ratio on SPECT/CT images were calculated as follows:
ΔT/N% (SPECT) = (T/NT ratio before therapy − T/NT ratio after therapy)/T/NT ratio before therapy × 100%.
The percentage changes in T/NT ratio on planar images were calculated as follows:
ΔT/N% (planar) = (T/NT ratio before therapy − T/NT ratio after therapy)/T/NT ratio before therapy × 100%.
Evaluation of response to therapy
The Response Evaluation Criteria in Solid Tumors (RECIST) 1.1, including complete response (CR), partial response (PR), stable disease (SD), and progressive disease (PD), were used as the standard for the evaluation of response to EGFR-TKIs. To evaluate the efficacy of 99mTc-3PRGD2 imaging in early response to therapy, patients were divided into two groups: responders (CR and PR) and nonresponders (SD and PD) for receiver operator characteristic (ROC) analysis.
Prediction of prognosis
The progression-free survival (PFS) was analyzed for the purpose of predicting prognosis. In this part, patients were regrouped as 99mTc-3PRGD2 SPECT/CT responders (S1) and nonresponders (S2), 99mTc-3PRGD2 thoracic planar responders (P1) and nonresponders (P2) according the optimal cutoff value obtained from ROC analysis. PFS was defined as the period from initiation of EGFR-TKIs therapy to the date of PD confirmation. Patients were followed up from the first day of therapy and then in 2-month intervals in the following period until progress. The time of endpoint was May 20, 2016 for patients had no progression. The follow-up items included history taking, physical examination, CT scan, and serum tumor markers measuring.
Statistical analyses
All numeric data are expressed as the mean ± standard deviation. The difference of changes in T/NT ratios on SPECT/CT and thoracic planar images between different groups was analyzed using the Student t-test. A self-paired t-test was applied to analyze the largest diameters and T/NT ratios of target lesions obtained from the same patients before and after treatment. ROC analysis was performed to identify an optimal cutoff value of responders, which determined by maximization of the sum of the sensitivity and specificity. The PFS was estimated by the Kaplan–Meier method, and the resulting curves were compared using the log-rank test. 25 Statistical analyses were performed using SPSS 13.0 for windows. p-Value of less than 0.05 was considered significant.
Results
Patients and early response to therapy
The basic information of the patients, including age, gender, tumor stage, treatment, and response to therapy, is listed in Table 1. According to RECIST1.1, none of 18 patients achieved CR, 10 of 18 (55.6%) patients had PR, and 6 (33.3%) patients attained SD, while the other 2 (11.1%) patients had PD. The overall response rate was 55.6% (10/18).
CR, complete response; PD, progressive disease; PR, partial response; SD, stable disease.
Evaluation of 99mTc-3PRGD2 imaging for early response to treatment
All lung lesions of patients were shown clearly visible 99mTc-3PRGD2 uptake on SPECT/CT and planar images (Figs. 1 and 2). The mean largest diameters, T/NT ratios, and the percentage changes in T/NT ratios of lung lesions are shown in Table 2. The mean T/NT ratios of lung lesions on SPECT/CT images were higher than the same lesions on thoracic planar images before and after therapy (t = 7.47 and 7.49, p = 0.000 and 0.000). Of all 18 patients, 3 patients were found with additional lesions outside of the chest on whole-body planar images, including bone and abdominal lymph node metastasis, which were confirmed by follow-up.
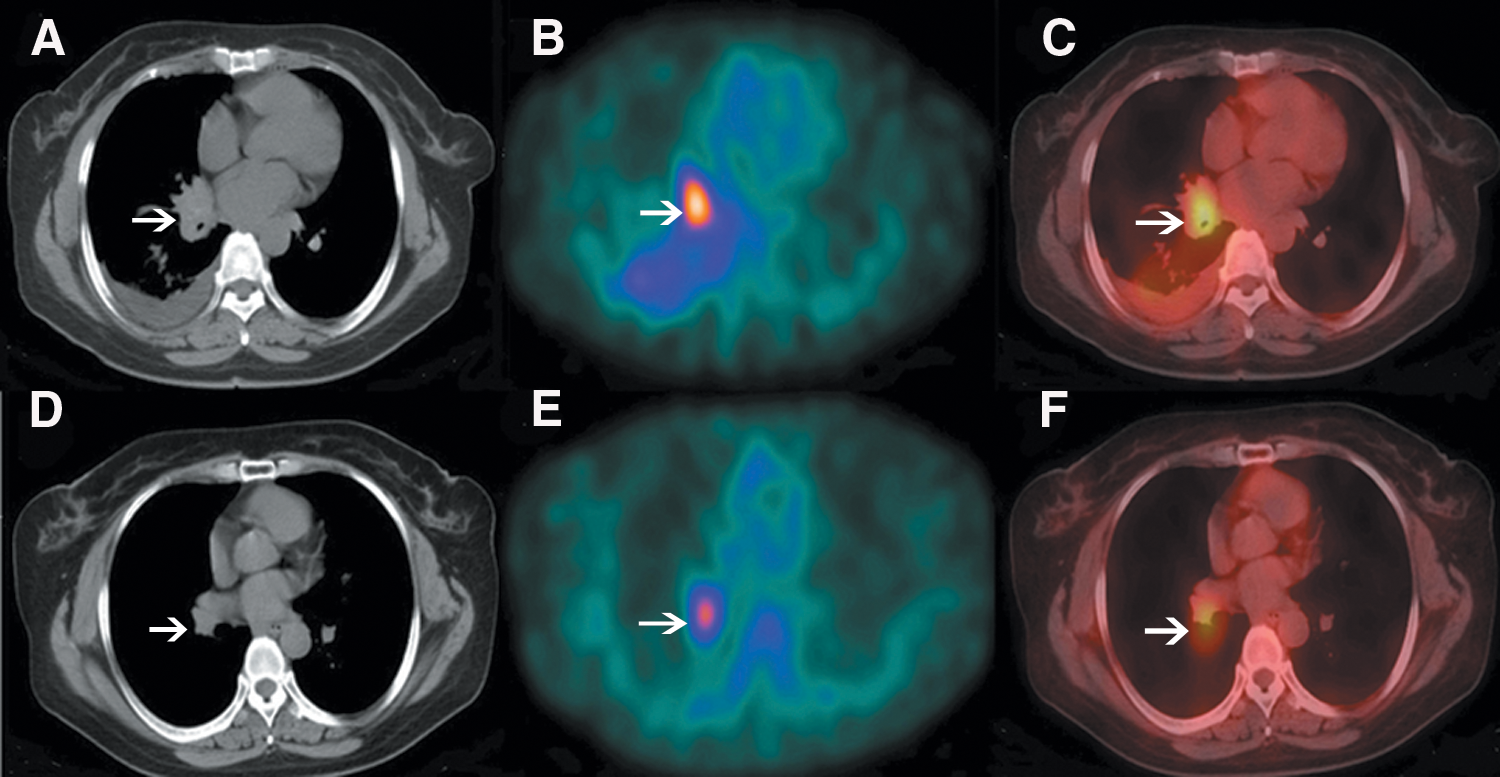
99mTc-3PRGD2 SPECT/CT images. A 51-year-old woman who had a PR, accepts Icotinib therapy for 40 days, CT
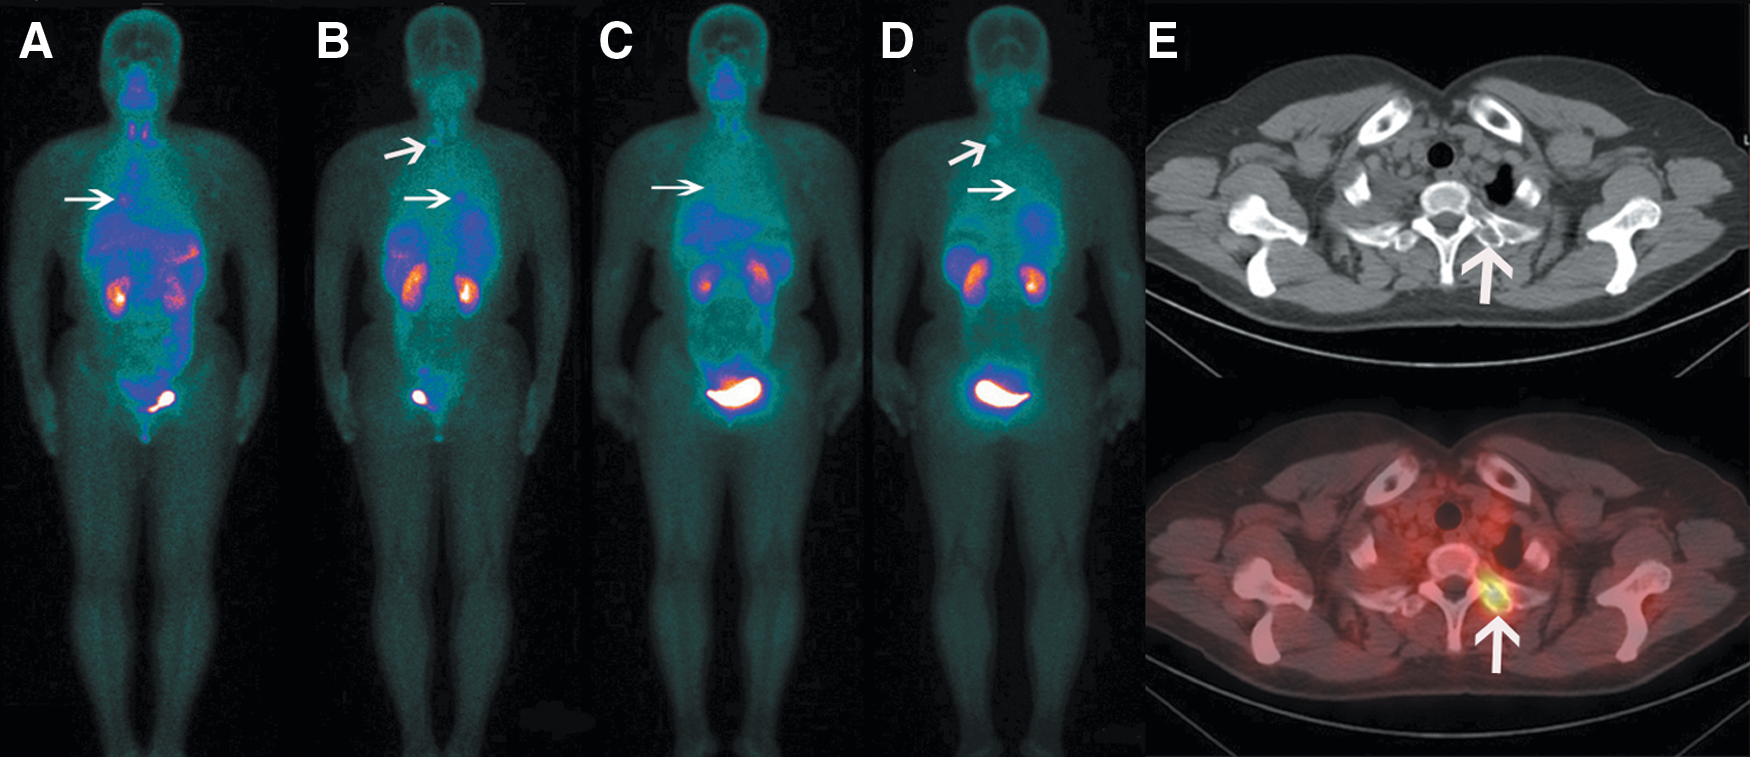
99mTc-3PRGD2 whole-body planar images
After treatment, 10 (100%) patients in the PR group had 99mTc-3PRGD2 uptake decreased, while 2 (100%) patients in the PD group had 99mTc-3PRGD2 uptake increased. In the SD group, there were 3 (50%) patients with the uptake of 99mTc-3PRGD2 increased and 3 (50%) patients decreased. The decrease in diameters on CT images and T/NT ratios on SPECT/CT and thoracic planar images in the PR group had significant differences (p = 0.001, 0.004, and 0.003, respectively). While in SD and PD groups, there were no significant differences (p = 0.062, 0.276, 0.797 and 0.221, 0.122, 0.101, respectively).
Prediction of early treatment response in terms of 99mTc-3PRGD2 uptake
The percentage changes in T/NT ratios on SPECT/CT images had significant differences between PR and SD, PR and PD, SD and PD groups (t = 2.510, 8.054, and 4.313, p = 0.025, 0.000, and 0.005, respectively). On thoracic planar images, the percentage changes in T/NT ratios between PR and PD had significant differences (t = 4.790, p = 0.001), while in PR and SD, SD and PD, there were no significant differences (t = 2.000 and 2.343, p = 0.085 and 0.071, respectively).
ROC analysis (Figs. 3 and 4) demonstrated the optimal cutoff values that can discriminate between responders and nonresponders were 23.8% decrease in T/NT ratios on 99mTc-3PRGD2 SPECT/CT and 11.5% decrease on thoracic planar images after therapy, while the sensitivity and specificity were 80.0% and 87.5%, 70.0% and 75.0%, respectively. Figures 5 and 6 illustrate the thresholds of percentage changes in T/NT ratios between responders and nonresponders on SPECT/CT and planar images.

The ROC analysis with an AUC of 0.838 demonstrated the optimal cutoff value of decrease in T/NT ratio on SPECT/CT images after targeted therapy in identifying responders was 23.8%, while the sensitivity and specificity were 80.0% and 87.5%, respectively. AUC, area under curve; ROC, receiver operator characteristic.

The ROC analysis with an AUC of 0.788 demonstrated the optimal cutoff value of decrease in T/NT ratio on thoracic planar images after targeted therapy in identifying responders was 11.5%, while the sensitivity and specificity were 70.0% and 75.0%, respectively.
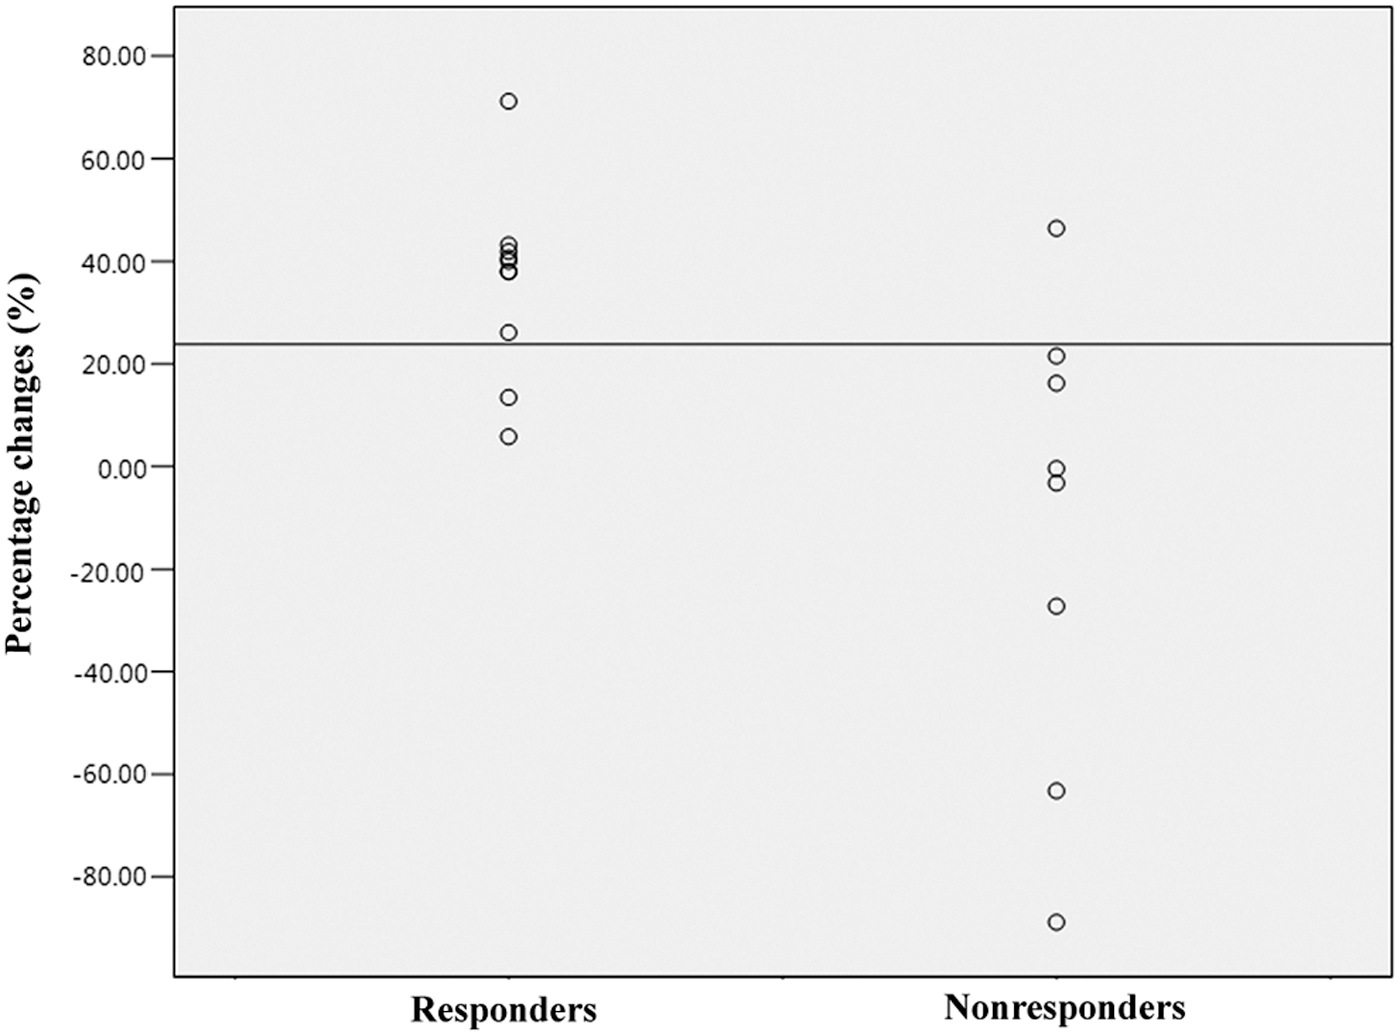
The percentage changes in T/NT ratio between responders and nonresponders on SPECT/CT images.
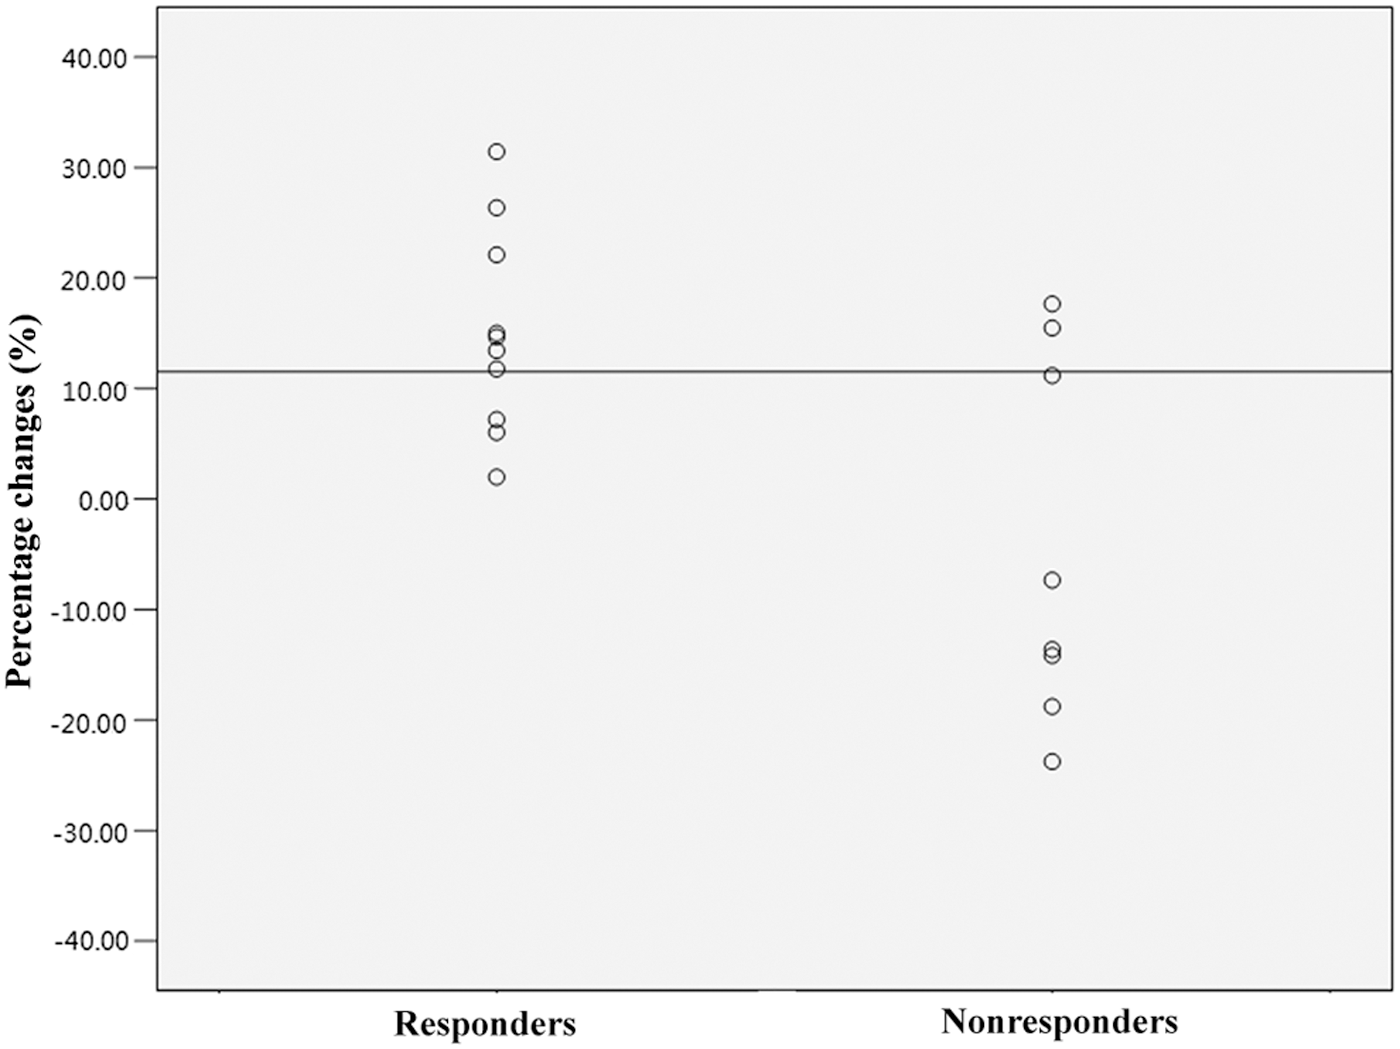
The percentage changes in T/NT ratio between responders and nonresponders on thoracic planar images.
The median PFS for patients with S1 and S2 was 18 months (95% CI: 5.8–30.2 months) and 7 months (95% CI 5.2–8.8 months), while for P1 and P2 was 13 months (95% CI 5.2–20.8 months) and 8 months (95% CI 5.3–10.7 months), respectively (Fig. 7). The log-rank test for PFS between S1 and S2, P1 and P2 showed significant differences (p = 0.006 and 0.017, respectively).
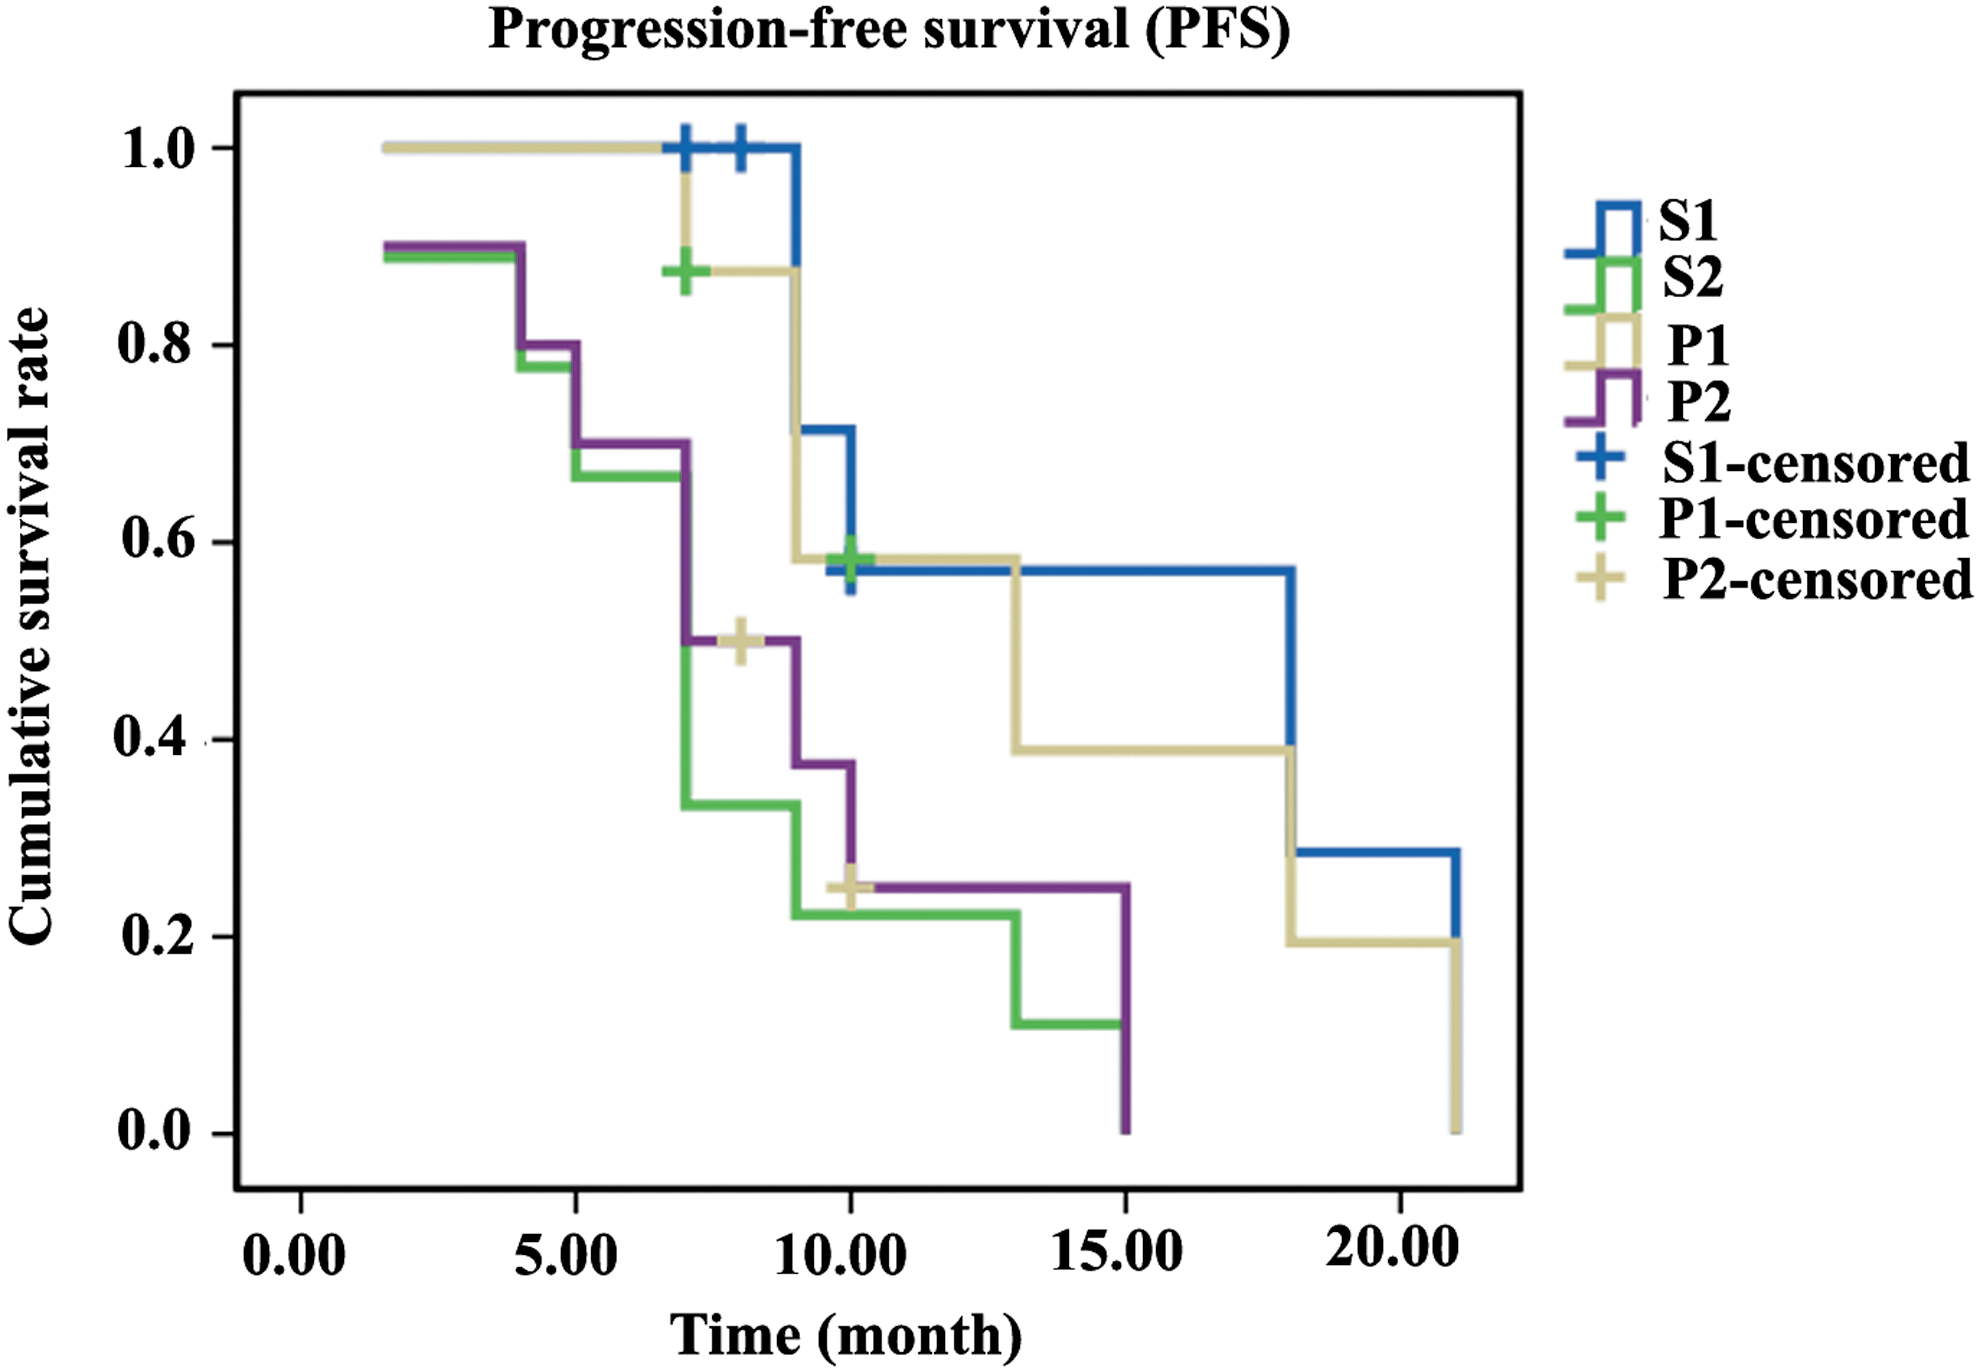
PFS of S1, S2, P1, and P2 was estimated by the Kaplan–Meier method. PFS, progression-free survival.
Discussion
Integrin αvβ3 expressed mainly on activated endothelial cells and malignant tumor cells, but not on normal cells and quiescent vessel cells, 26 which is the basic of RGD-based peptides imaging used in diagnosis and evaluation treatment response of malignant tumors. 27 –30
Previous study 5 had shown that the response of 18 F-FDG PET/CT after EGFR-TKIs treatment was associated with survival and radiologic response. Patients with a cutoff value of 15%–30% decrease in SUVmax (maximum of standardized uptake value) after EGFR-TKIs therapy can benefit from continued treatment. A comparison study between 18 F-galacto-RGD and 18 F-FDG PET had revealed that RGD tracer had the advantage in response evaluation of targeted therapy, while 18 F-FDG PET was better in tumor staging. 31 Compared with 18 F-FDG and other radiolabeled RGD-based peptides imaging, 32 –36 99mTc-3PRGD2 imaging held the advantage of low cost, widespread availability, and favorable physical and imaging characteristics (γ ray = 141 keV, half-life = 6.02 hours). 24,37 Moreover, the preparation of 99mTc-3PRGD2 is efficient, reproducible, and simple, making it easy for clinical use.
Compared to readout of therapeutic efficacy by structural changes in CT scan, which may be retarded, 99mTc-3PRGD2 SPECT scan can reveal the functional status of the tumors, which makes it suitable for obtaining information about the immediate response after therapy. It has been reported that 99mTc-3PRGD2 SPECT can detect the tumor response in patients with breast cancer after chemotherapy. 38 The ability of 99mTc-3PRGD2 SPECT/CT used in predicting the early response to chemoradiotherapy plus bevacizumab in patients with NSCLC has also been confirmed. 39
99mTc-3PRGD2 is an excellent radiotracer for imaging lung cancer. The lower uptake of 99mTc-3PRGD2 in the chest is the guarantee of higher sensitivity for the detection of target lesions in the lung. 17 In this study, the primary lung lesions were displayed clearly using 99mTc-3PRGD2 SPECT/CT and planar scan before therapy. T/NT ratios and changes in T/NT ratio on SPECT/CT images were higher compared with thoracic planar images. In the PR group, the diameter of target lesion, which was shortened, accompanied a decrease in 99mTc-3PRGD2 uptake on SPECT/CT and thoracic planar images. Conversely, in the PD group, the diameter of lung lesion increased with 99mTc-3PRGD2 uptake increased. It should be noted that the SD patients grouped according to RECIST 1.1 had little change in diameter, but 50% had the T/NT ratio increased in this study.
Compared to thoracic planar images, SPECT/CT images were better in displaying lesion and evaluating response to therapy for its higher T/NT ratios and greater changes after treatment. The changes in T/NT ratios on SPECT/CT images between PR and PD, PR and SD, SD and PD had significant differences, and therefore, 99mTc-3PRGD2 SPECT/CT had more potential in the evaluation of early response to treatment. However, it should be noted that planar imaging of whole body had the advantage of displaying additional lesions outside of the chest. 99mTc-3PRGD2 SPECT/CT and whole-body planar scan were complementary in the evaluation of early response to treatment. CT imaging actually played an important role in displaying morphology, adjacent tissue invasion, and location of lesions, which was the shortage of SPECT. SPECT/CT, which combined with the advantages of two modalities, CT and SPECT tomography, may play a greater value in clinical practice for lung cancer diagnosis and evaluation of early response to therapy than using them alone.
ROC analysis has shown that 99mTc-3PRGD2 SPECT/CT and thoracic planar imaging had the ability to identify responders, which can provide important information for clinically determining and adjusting the treatment plan. In the follow-up of this study, it was found that the functional response was significantly associated with clinical outcome. Due to the significant differences in median PFS between S responders–nonresponders, P responders–nonresponders that illustrated continuously high uptake of 99mTc-3PRGD2 by lung cancer were associated with a poor prognosis. The change in T/NT ratio on 99mTc-3PRGD2 SPECT/CT and thoracic planar images after EGFR-TKIs treatment was a significant predictor for PFS. As most patients (72.22%, 13/18) enrolled in this study remain alive at the end of the follow-up in May 2016, the statistics of OS (overall survival) is not performed.
However, it should be noted that this study was preliminary and the data were obtained from a limited number of patients, especially without CR patients, which were the limitations of this study.
Conclusions
In conclusion, the preliminary results of this study showed that 99mTc-3PRGD2 SPECT/CT and thoracic planar scan are useful imaging tools for monitoring of the changes in the integrin αvβ3 expression prior and post-EGFR-TKIs therapy and can evaluate the early response to EGFR-targeted therapy and predict the PFS of lung adenocarcinoma patients. As a new method of nuclear medicine used in the evaluation of response to therapy, which holds the advantage of excellent imaging quality, low cost, and wide availability, 99mTc-3PRGD2 imaging may play an important value in the clinical application.
Footnotes
Acknowledgments
The authors thank Prof. Yi Li at the department of Imaging Services and PET/CT, Good Samaritan Hospital Medical Center, New York, USA, for helpful revision. This study was supported by the Foundation of Science and Technology Department of Hebei Province, China (No. 15277776D).
Disclosure Statement
No competing financial interests exist.