
Abstract
Radiotherapy is widely used in breast cancer treatment. The radiotherapy for breast invasive carcinoma (BRCA) presents challenges with the complex clinical factors, and too many genes have been found to be associated with BRCA radiotherapy prognosis. The aim of this study was to construct an integrative model to combine the clinical data and RNA expression data (including microRNA and mRNA) to predict the survival durations of BRCA patients with radiotherapy. Also, the authors try to find the key regulation pairs between mRNA and miRNA from prediction. They collected mRNA and microRNA expression profiles and gathered the corresponding clinical data of 73 BRCA patients with radiotherapy from The Cancer Genome Atlas (TCGA). According to an integrative model from univariate Cox regression between RNA expression and patient survival, they classified the patients with radiotherapy into low-risk and high-risk groups. The results showed that nine mRNAs were considered as protective genes and five miRNAs and eight mRNAs were considered as high-risk genes. Moreover, the high-risk group has a significantly shorter survival time in comparison with the low-risk group by the log-rank test (p = 0.0039). The reliability of the gene signature was validated by an independent data set from the Gene Expression Omnibus (GEO). Furthermore, three pairs of miRNA-mRNA, closely associated to survival, were identified. These findings and method may prove valuable for improving the clinical management of BRCA patients with radiotherapy.
Introduction
Breast invasive carcinoma (BRCA) is the most frequent malignant disease cause of cancer-associated death in Western women. 1 Adjuvant therapy, including chemotherapy and radiation therapy (RT), for breast cancer has shown that the patients have little survival benefit after surgical resection. 2 One of the important problems in RT is how to predict tumor radiosensitivity.
Although previous studies reported that many genes are closely related with radiosensitivity in NCI-60 cell lines, 3,4 the so many number of genes are hard for reference in clinical decision-making. The following research applied the results to construct a radiosensitivity index (RSI) model that consisted of 10 genes for classification of radiosensitivity and radioresistance cells. The signature has been validated in many independent clinical data in different cancers. 5,6 These studies mainly used mRNA expression alone. With the deepening of the understanding in molecular biology, more and more studies find that miRNAs also participate in regulation for radiation response and patient with radiotherapy. 7 However, most of these studies analyzed the microRNA and mRNA expression profiles of BRCA patients with radiotherapy separately. Moreover, BRCA is the very complex and heterogeneous tumor in human cancers. There are many factors that might influence BRCA patients with radiotherapy, and the process is very complex. For example, BRCA could be divided into many subtypes and affected by other factors such as estrogen status, PIK3CA mutation, and HER2 status. 8 –11 Therefore, integrative multiple factors are valuable to improve for predicting the prognosis of BRCA patients with radiotherapy.
The Cancer Genome Atlas (TCGA) project provides researchers with a set of comprehensive tools that can be used to analyze clinical and genetic signatures of BRCA with radiotherapy. Recently, many studies applied the integrated RNAs and clinical factors model to predict patient prognosis of survival or cancer recurrence. 12,13 Also, the results indicated that the integrated model has been superior to miRNA alone and mRNA alone.
In this study, the authors retrieved the BRCA data from TCGA and filtered the samples with radiotherapy for further study. First, they analyzed clinical data of BRCA patients with radiotherapy from TCGA to screen clinical variables that can predict overall survival (OS) time outcomes. They found that clinical variables are not associated with survival time in BRCA with radiotherapy. With testing differential expression of RNAs, no difference was found between radiotherapy and without radiotherapy. The differential RNA expression might not directly reflect radiosensitivity of BRCA. Therefore, univariate Cox regression is applied to test relevance between RNAs and survival time in BRCA with radiotherapy.
Furthermore, an independent data set is applied to validate the robustness of the integrated model in this study. However, the authors have to admit that this study has some limitations due to lack of some data (such as molecular subtypes, tumor size, and some known gene mutation), which might influence the analysis of BRCA with radiotherapy. Although there are some missing in the current data from TCGA, the gene signature from the model performed good stability. Thus, they hope that the model might be a reference for classifying patients as suitable or not for radiotherapy.
Methods
RNA profiles and patient information collection
All BRCA patients were collected from the TCGA database (
Clinical factor and other known background factor survival analysis
Clinical factors for the BRCA patients are listed in Supplementary Table S1 (Supplementary Data are available online at
The expression of mRNA and miRNA associated with survival analysis
In the current data, there is no difference in RNA expression between radiotherapy and no radiotherapy. For analysis of the relationship between RNA expression and survival time of BRCA patients, the univariate Cox proportional hazard regression was used to research key RNAs. The RNAs with filtered null value were calculated. The p-value ≤0.01 was screened to mRNA and p-value ≤0.05 was screened to miRNA. RNAs that had HR for death >1 were considered to be high-risk RNAs, while HR <1 was defined as risk-decreasing RNAs.
Prognosis index and integrated genes and clinical features
A prognosis index (PI), integrated indicator of candidate RNAs for each BRCA patient, is constructed. The PI was calculated from sum of the expression value of the RNAs weight multiplied by clinical features of univariate Cox regression coefficients. For integrating indicators of RNAs for each BRCA patient, the authors defined a weighted prognostic index (WPI)
12
as follows:
where
Risk stratification and receiver operating characteristic curves
The capacity of the integrated RNA and clinical model to predict clinical outcome was evaluated by comparing the analysis of area under curve (AUC) of the receiver operating characteristic (ROC) curves. AUC for the ROC curve was applied to the “survivalROC” package in R software. 14 A higher AUC is considered as better model performance, and the range of AUC value is from 0.5 to 1. The AUC range from 0.80 to 0.90 is considered as good performance, and the range from 0.90 to 1.00 is considered as excellent performance. The risk of patient group was classified into two groups (a high-risk and a low-risk group) according to a threshold point of individual patient WPIs. The OS time of the two groups is compared using Kaplan–Meier curves. The two-sided log-rank test was used to analyze the difference in OS distribution. Statistical analysis and plot in this study were using R software, 15 version 3.2.4 and Bioconductor, version 2.14. 16
Gene ontology and pathway enrichment
Gene ontology (GO) functional enrichment analysis was performed on RNAs, which classified into low-risk and high-risk group with using the online tool of the DAVID (version 6.7). 17,18 The authors selected “Homo sapiens” and the search terms “GO_TERM_BP_FAT” for further analysis. Also, the genes are enriched in Kyoto Encyclopedia of Genes and Genomes (KEGG) pathway for analysis. 19
Validation data of patient information collection
Independent mRNA expression data of BRCA with radiotherapy, with 159 BRCA patients, were downloaded from Gene Expression Omnibus (GEO) database (
Analysis of miRNA target prediction
Many computational prediction approaches are available recently, such as TargetScan, miRanda, PicTar, TarBase, and RNAHybrid, which are mostly based on complementarity, thermodynamics, or experimental validation. In this study, the authors predicted the targets of miRNA with using TargetScan (Release 7.0) 21 and miRanda (Release 19) methods. 22 Also, TargetScan and miRanda tools were used considering both conserved and nonconserved targets. High-efficacy targets were chosen by the following thresholds: (1) TargetScan: total context score ≤−0.2 and (2) miRanda: align score ≥120, energy≤−10 kcal/mol.
Result
Clinical correlation of patients in TCGA BRCA patients
In the TCGA BRCA patients, 73 patients with radiotherapy were selected. Demographic and clinical data of these samples are summarized in Table 1. The details of the clinical table are listed in Supplementary Table S1.
BRCA, breast invasive carcinoma; CI, confidence interval.
Four clinical factors were considered and analyzed by univariate survival analysis (the two-sided log-rank test), including age at initial diagnosis, tumor status, estrogen receptor status, and human race. From the results of univariate survival analysis and multivariate Cox proportional hazards regression analysis, these four clinical traits were not associated with OS in BRCA patients with radiotherapy (Table 1 and Supplementary Fig. S1).
Validation for other confounding effect of known subtypes and known genetic background in TCGA BRCA cohort
Due to complex and heterogeneous of BRCA, the subtypes and some genetic background were considered in this study. In this study, pathological subtypes and TNM stage are used to analyze confounding effect, but the molecular subtypes are not available in current data. The results showed that pathological subtypes and TNM stage are not significantly associated with survival time (pathological subtypes: p = 0.429; TNM stage: p = 0.527) (Supplementary Fig. S2). Previous study shows that TP53 mutation, PIK3CA mutation, and HER2 overexpression are closely associated with survival time of BRCA patients. 8 –10 Thus, the status of three genes was collected from the TCGA data set. In the current data set, all of HER2 status could be collected. However, only 45 samples include status of TP53 and PIK3CA. Although the data are not complete, the number of radiotherapy samples is reliable enough statistics to analyze the confounding effect of genetic background. The results showed that the status of these three genes was not associated with survival time by log-rank test (PIK3CA: p = 0.180; TP53: p = 0.806; HER2: p = 0.626) (Supplementary Fig. S3).
Integrated RNA and clinical features in the TCGA BRCA cohort
After filtering the null value of RNA expression, 14,439 mRNAs and 252 miRNAs were incorporated into a univariate Cox proportional hazards regression analysis. From the results, 17 mRNAs and 5 miRNAs were significantly associated with OS. The set of 17 mRNAs (univariate Cox regression p-value ≤0.01) and 5 miRNAs (univariate Cox regression p-value ≤0.05) is listed in Table 2.
HR, hazard ratio.
In addition, the detailed information of these RNAs is listed in Supplementary Table S2. Among these 22 RNAs, 5 miRNAs were high-risk RNAs (HRs >1); 8 mRNAs were high-risk RNAs (HRs >1); and 9 mRNAs were protective RNAs (HRs <1; Table 2).
The PI was calculated as a linear combination of the expression value of the 22 candidate RNAs weighted by univariate Cox regression coefficients. And each sample will be assigned a PI value according to Equation (1) in the Methods section. The WPIs of these RNAs were calculated according to Equation (2). The value of WPIs in BRCA patients with radiotherapy ranged from −1.322 to 5.554. The authors divided these samples into two groups (low risk and high risk) by the point that had the greatest slope (WPI = 0.238 is the most changed point in this study) as the cutoff (Fig. 1A). The distribution of low risk and high risk with patient survival status and WPI distribution among BRCA patients with radiotherapy is shown (Fig. 1B). Patients with radiotherapy in high-risk group tend to express higher levels of high HR RNAs, while the low-risk group might tend to express higher levels of protective mRNAs (Fig. 1C).
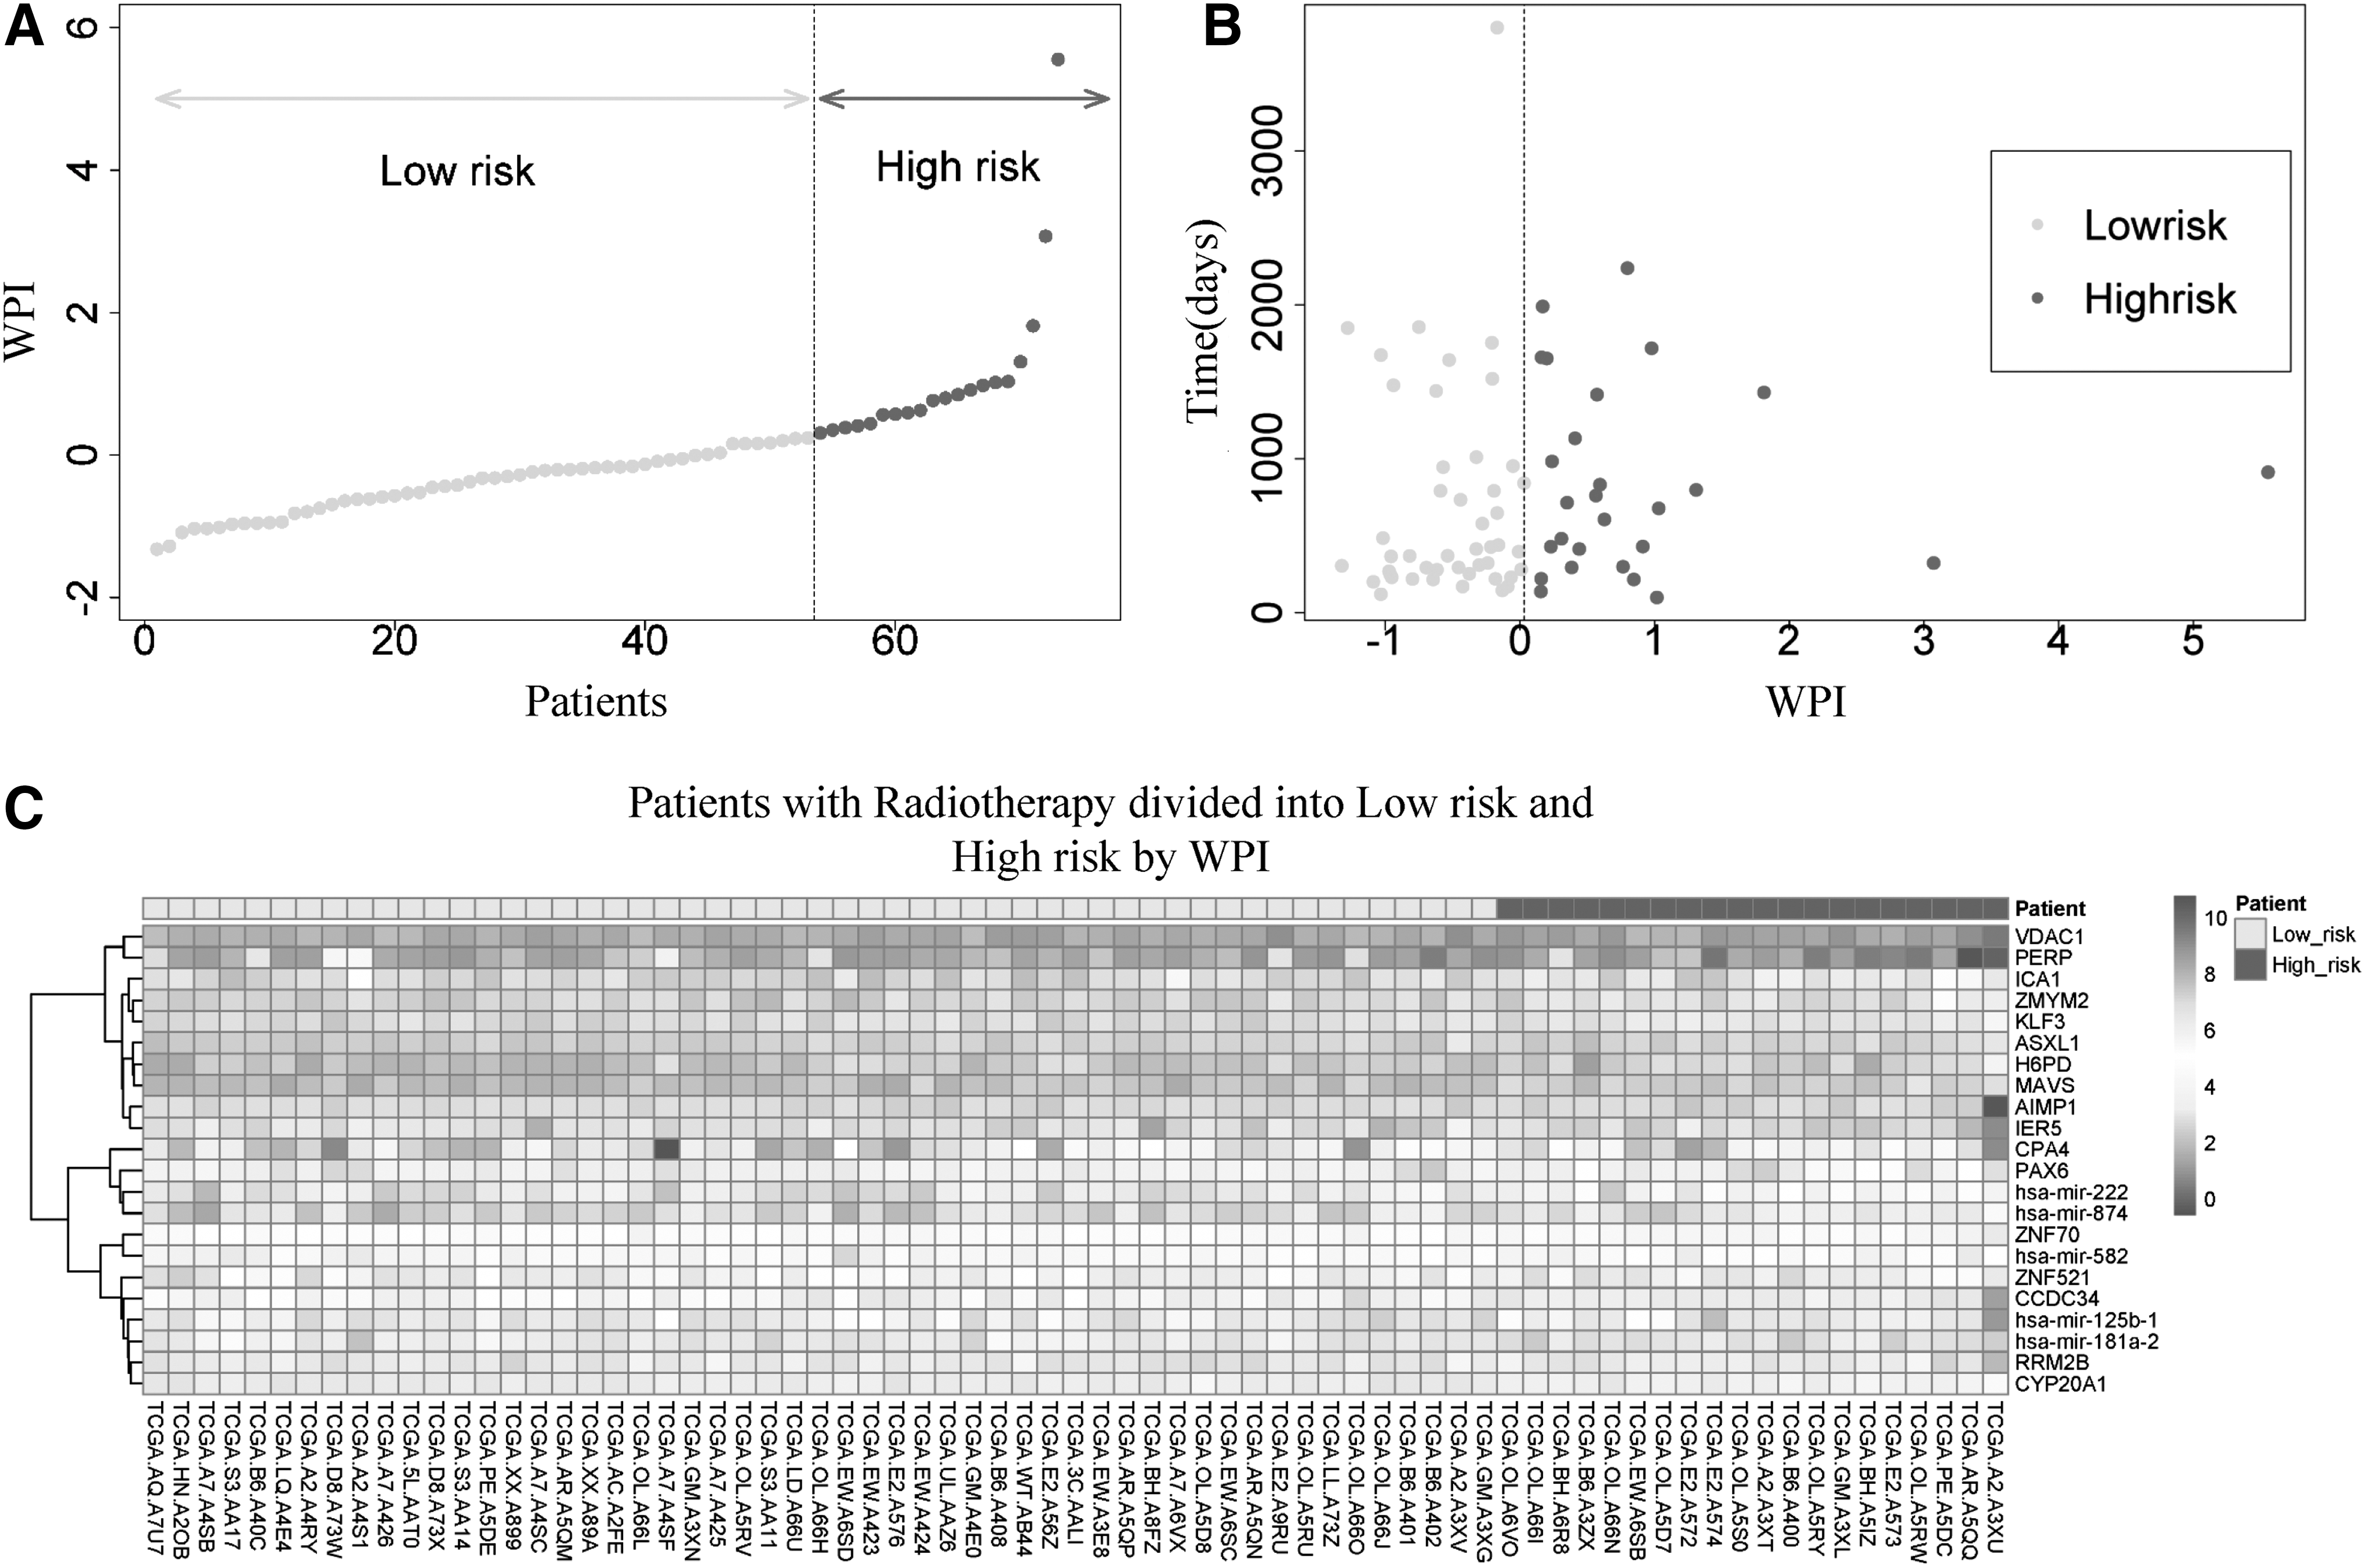
The low risk and high risk of 73 BRCA patients with radiotherapy analysis by 22 RNA WPIs.
As a result, 20 patients were classified into the high-risk group and 53 patients were classified into the low-risk group. Survival analysis from the results indicated that survival time in the high-risk group was shorter than in the low-risk group (912 days vs. 1430 days; p = 0.0039; Fig. 2A). In addition, the integrated RNA signature was tested to predict the performance of survival outcome in BRCA patients with radiotherapy at 5 years. The AUC was 0.935 at 5 years of OS in the BRCA patients with radiotherapy (Fig. 2B).
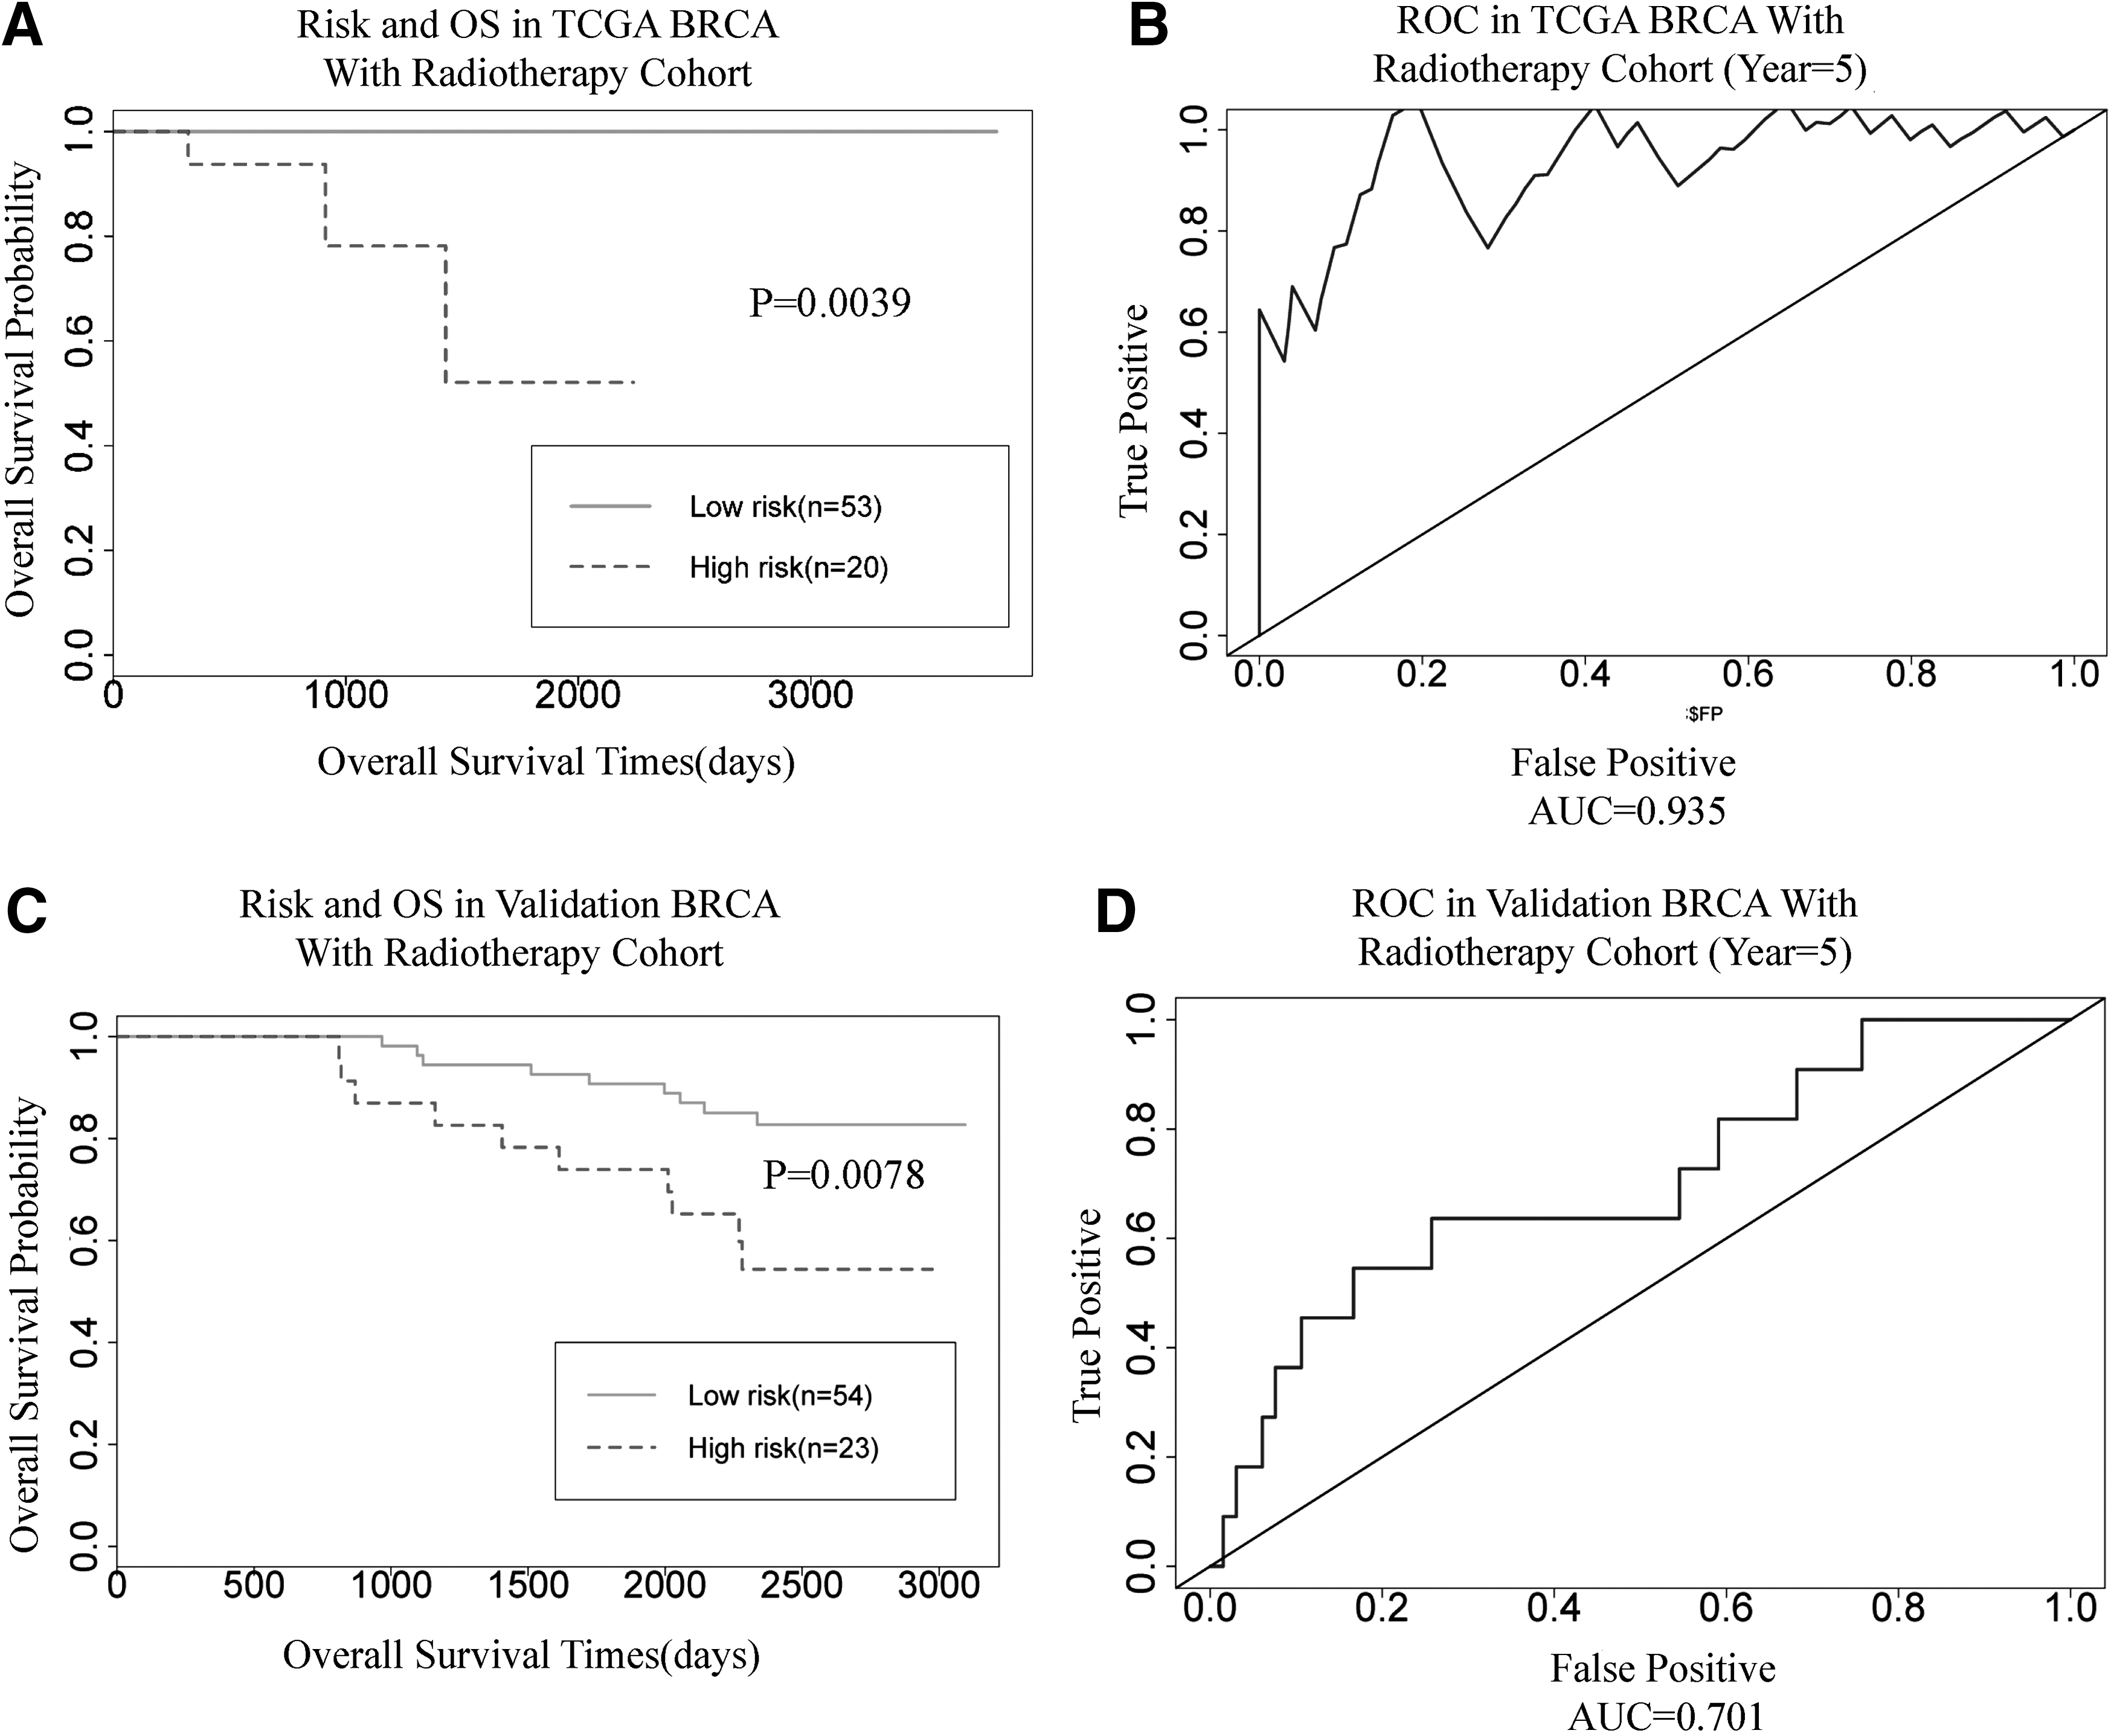
Kaplan–Meier curves and ROC curves for the integrated RNA signature.
The mRNA signature verification in validation BRCA cohort
To verify the signature genes in other BRCA patients is an important step for validating the prediction results. In the public data set, the BRCA patients with radiotherapy are sorely lacking in both, including miRNA and mRNA expression data. On the contrary, in this study, the signature genes mainly consisted of mRNAs. So, the authors collected the mRNA expression in BRCA patients with radiotherapy from independent data that were downloaded from GEO database (see Methods section). The data set of GSE1456 included 159 patients and contained gene expression data and clinical traits. 20 In that study, the patients comprised 77 patients with radiotherapy and 82 patients with no radiotherapy. The authors applied the 77 patient data for the validation data set. In this study, 13 mRNAs (CYP20A1, MAVS, ASXL1, KLF3, H6PD, ZMYM2, ICA1, CPA4, AIMP1, PAX6, IER5, PERP, and VDAC1) overlapped between TCGA data and GEO data. Details of these 13 mRNAs are given in Supplementary Table S3.
The authors also use the WPI value to classify the 77 patients into the low-risk (54) and high-risk (23) group. The survival analysis was used to test the two group differences, and ROC curve and AUC were used to test the performance of the results. The results showed that the survival time of high-risk patients is very significantly different from low-risk patients in the validation data set (Fig. 2C; p = 0.0078). The value of AUC was 0.701 at 5 years of survival time in validation data.
GO enrichment in low-risk group and high-risk group
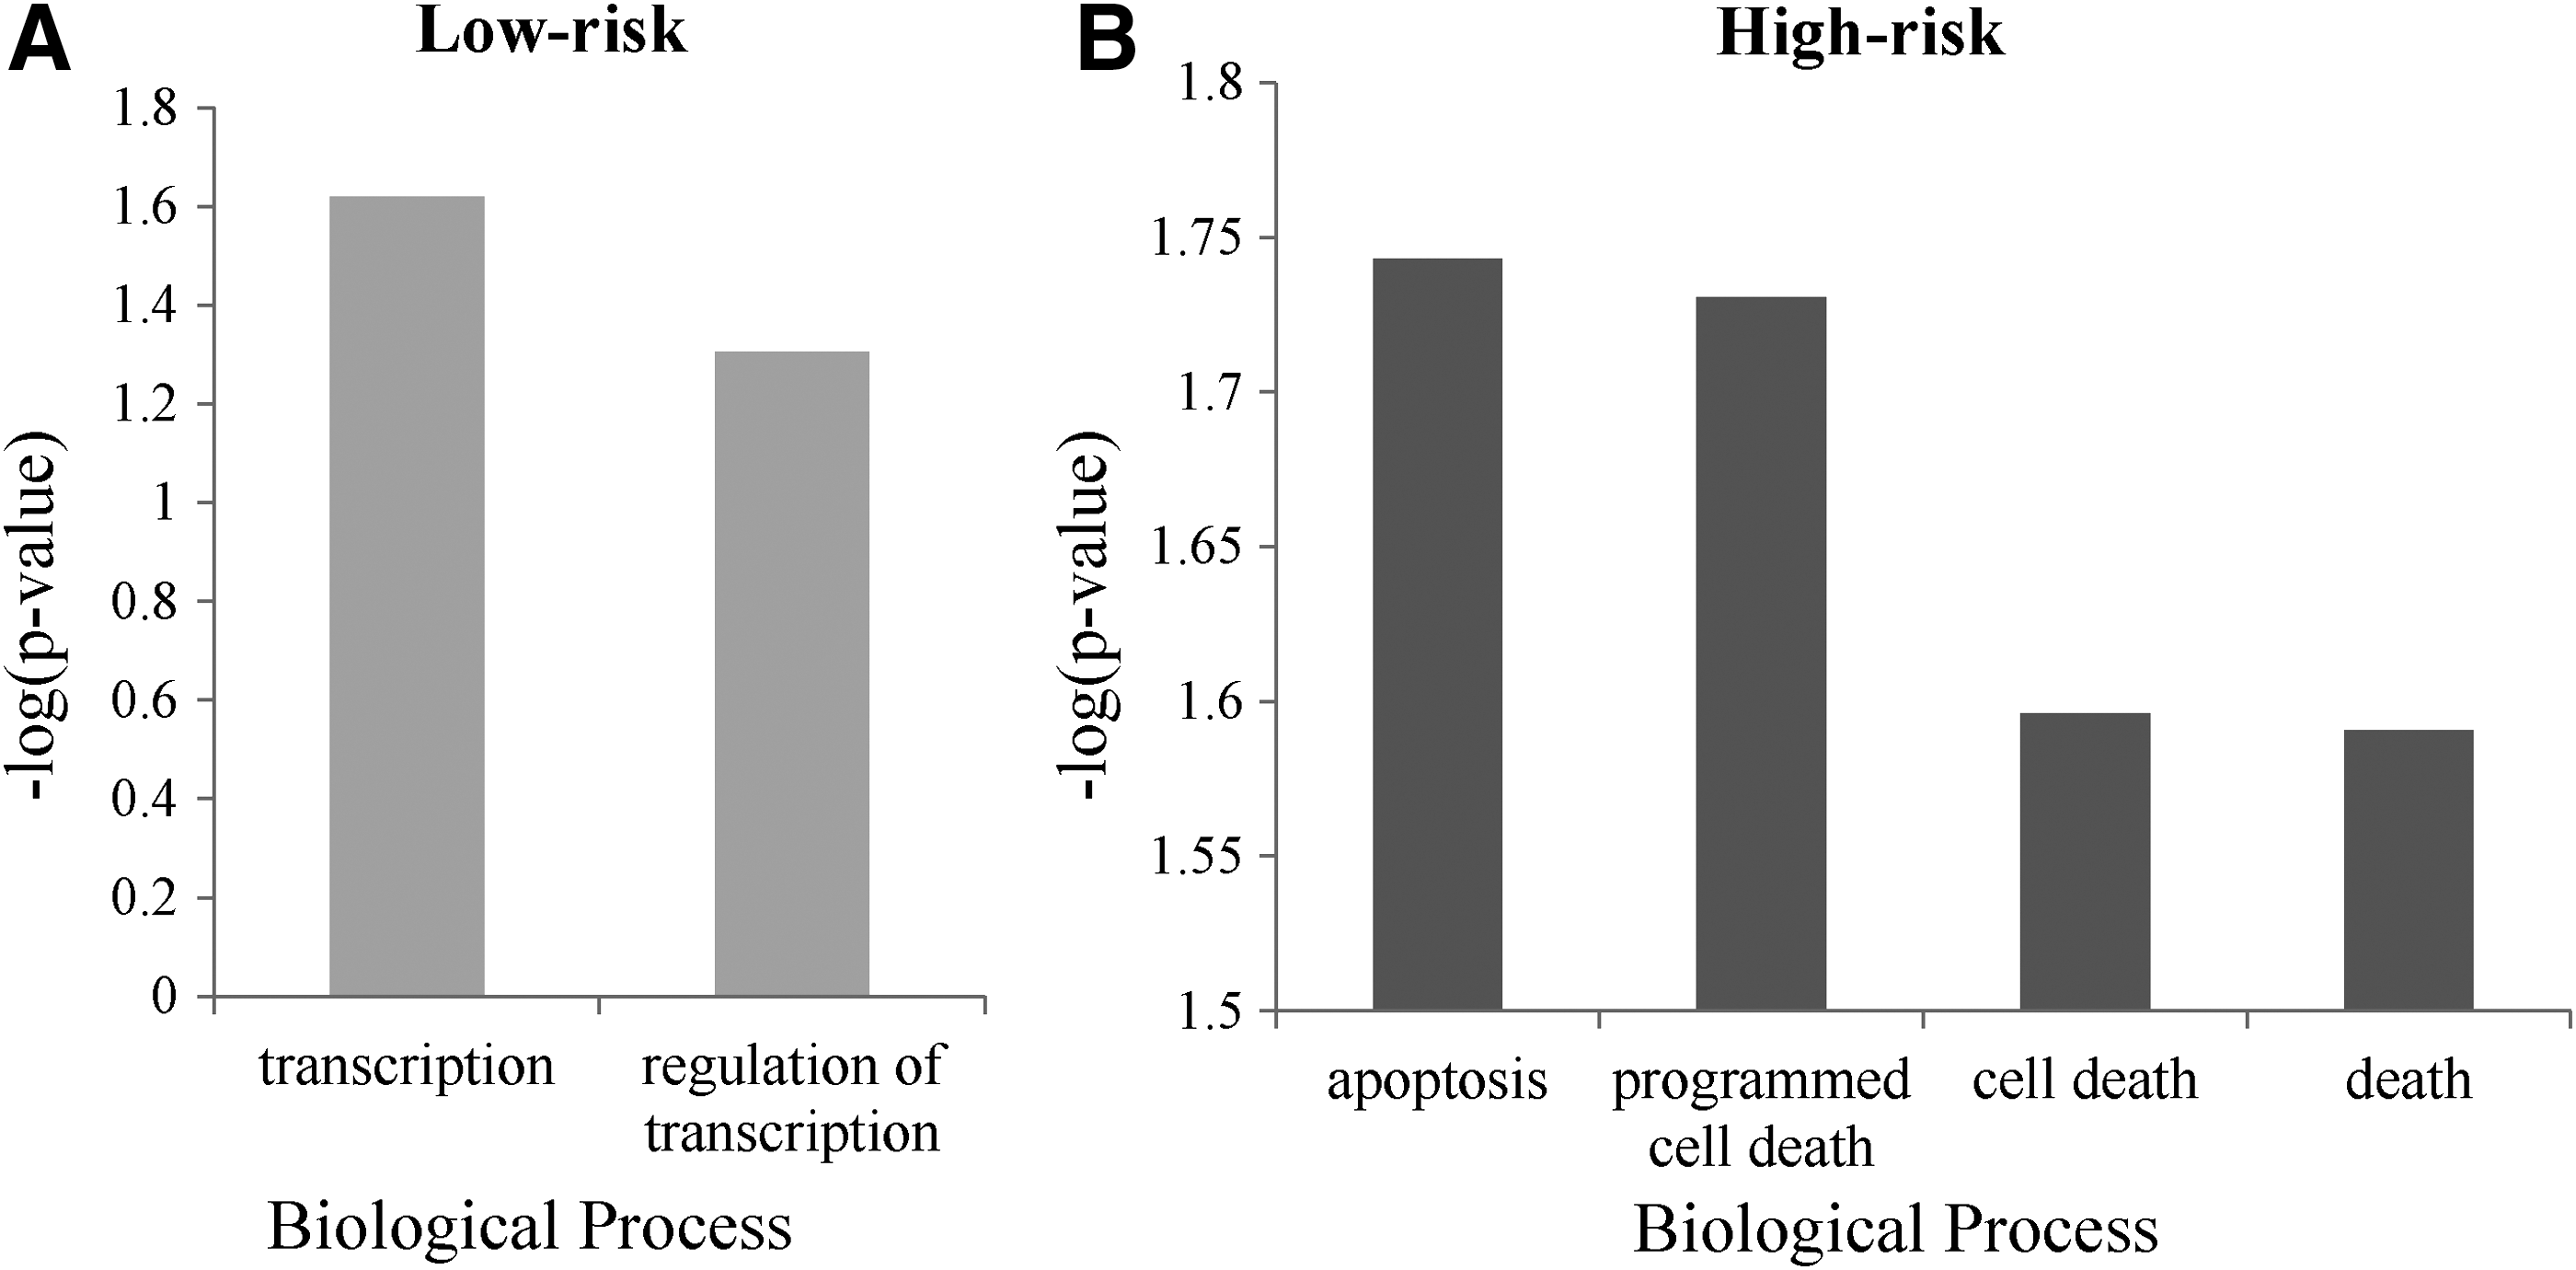
The protective genes and high-risk genes were enriched by GO. These genes were submitted in the Kyoto Encyclopedia of Genes and Genomes (KEGG) pathway for pathway enrichment. The genes in low-risk groups are mainly enriched in transcription biological process, and genes in high-risk groups are mainly enriched in apoptosis and cell program death (Fig. 3). GO terms of biological process assigned a Benjamini–Hochberg adjusted p-value <0.05 by DAVID were considered to be enriched over the background gene set. In this study, the authors applied −log (p-value) for analysis of the GO. The −log (p-value) ≥1.5 was considered as significantly enriched in GO terms. Subsequently, the authors submitted the genes of two groups into KEGG to analyze the pathway. The result shows that the genes in low-risk group were not enriched in any pathway. The genes in high-risk group are enriched in “p53 signaling pathway” (hsa04115) by KEGG analysis (p = 0.038).
Gene ontology analysis for low-risk group and high-risk group.
Analysis miRNA with survival association and target prediction
To verify the relationships between miRNAs and genes, TargetScan and miRanda methods were used to predict the target genes of miRNA. The results are listed in Table 3. These three miRNAs and two genes, closely associated with OS, are predicted by both methods.
Discussion
The development of molecular biomarker is a major issue of personalized medicine. 6 Radiotherapy as one of the important treatments for BRCA patients needed to pay more attention to study molecular mechanism for individual medicine. However, some patients have good prognosis and some patients have poor prognosis after radiotherapy. In this study, the authors found that age, tumor status, estrogen receptor status, race, and subtypes were not associated with survival Cox regression analysis. The patient heterogeneity is the one of the major issues for radiotherapy. Gene identification for patient heterogeneity is the goal of current precision medicine. They identified 22 RNAs that were closely associated with survival. Of these 22 RNAs, 9 mRNAs were considered as low-risk (HR <1; p < 0.05) factors for survival after radiotherapy. Of these genes, eight mRNAs and five miRNAs were considered as high-risk (HR >1, p < 0.05) factors for survival after radiotherapy. According to GO enrichment analysis, the genes in low-risk group were mainly enriched in “transcription” and “regulation transcription.” Interestingly, the genes in high-risk group were mainly enriched in “apoptosis” and “programmed cell death.” The genes that enriched in apoptosis include PERP, AIMP1, and VDAC1. Besides, the high-risk genes are enriched in “p53 signaling pathway.” PERP as a direct target gene of p53 is specifically expressed in proapoptotic response to p53 activation cells. 23 Overexpression of PERP leads to induced apoptosis in neurons, thymocytes, and fibroblasts. The transcriptional activation of PERP by p53 appears vital for PERP's ability to induce apoptosis. Furthermore, an interesting evidence shows that PERP functions only to induce apoptosis and it cannot cause cell cycle arrest. 25,26 In this study, PERP is a high-risk gene for OS (HR = 13.22; p = 0.009), and the p53 signaling pathway is closely associated with irradiation, DNA damage, and cell cycle. The patients with radiotherapy who have high expression of PERP had shorter survival time than the patients with low expression of PERP (Fig. 1C). AIMP1 (an alternative symbol as p43) is aminoacyl tRNA synthetase complex-interacting multifunctional protein 1. Previous study found that AIMP1 as a signaling molecular depended on the context and cell target and activation of this gene needed multiple activities. 27 The tissues undergoing apoptosis in the mouse embryo and at atherosclerotic lesions of the human aorta are overexpression AIMP1. 28 The voltage-dependent anion channel 1 gene (VDAC1) participates in mitochondria-mediated apoptosis, 29 and VDAC1 has the highest hazard ratio (HR = 24.60; p = 0.008) among genes in the high-risk group. Previous publication also reported that VDAC1 was significantly increased by radiotherapy. 30 In this study, the results indicated that patients after radiotherapy with high expression of these three genes have shorter survival time.
In this study, all five miRNAs are high-risk genes for breast cancer patient survival time. In this study, hsa-mir-181a-2 has the highest HR (HR = 23.2054) in miRNAs; hsa-mir-181a-2 belongs to the hsa-mir-181 family and is involved in immunity, metabolism, tumor suppression, or carcinogenesis. 31 The hsa-mir-582 has not been paid much attention. Hsa-mir-582 might be involved in tumor suppression. 32 The studies of hsa-mir-125b-1 in invasive breast cancer are very extensive and this miRNA is considered as a potential theranostic tool in BRCA. 33,34 The authors also found that hsa-mir-125b-1 and its target RRM2B are risk RNAs in this study. The hsa-mir-874 is also related with tumor growth. 35 Previous study has indicated that hsa-mir-874 is one of the prognostic RNAs in BRCA. 36 The has-mir-222 has been reported to play the role of response to cell stress. 37 The function of has-mir-222 in BRCA has not been proven.
From prediction of intersection of TargetScan and miRanda database, the authors found that three pairs of miRNA-mRNA were searched out. The pairs of miRNAs and mRNAs were all classified into high-risk group. Has-mir-181a-2 and VDAC1 pair consisted of the highest HR of miRNA and mRNA, respectively. This pair may be the most important contribution to patient survival time after radiotherapy. In other pairs, the RRM2B as one of the targets of has-mir-222 is ribonucleoside-diphosphate reductase subunit M2B. Previous study reported that RRM2B is a direct target of p53 and repression of RRM2B expression results in an increase of cell death by various DNA damages. 38 And a publication reported that RRM2B promoted cell death after X-ray irradiation. 39 The hsa-mir-125b-1 is abnormal expression in various human cancers. 33 Paradoxically, recent reports indicated that hsa-mir-125b-1 might play a dual role of oncogene or tumor suppressor in different cellular microenvironments. Deregulation of hsa-mir-125b-1 widely exists in ovarian carcinoma, thyroid carcinoma, invasive breast cancer, and hepatocellular carcinoma. 40 Other publications reported that hsa-mir-125b-1 suppressed cell growth through decreasing expression levels of ERBB3 and ERBB2 in breast cancer. 34 In this study, the authors predicted that hsa-mir-125b-1 regulated RRM2B in patients after radiotherapy.
Above all, the authors identified 22 RNAs and three pairs of miRNA-mRNA, closely associated with survival. The high-risk genes that mainly participated in cell death biological process are closely related with the p53 signaling pathway, and the p53 signaling pathway plays a vital role in response to radiation. Although hsa-mir-125b-1 expression in this study is paradoxical to the previous study, the results of cell lines might be different from clinical outcomes. The integrated miRNA and mRNA model proposed is superior to clinical alone for predicting prognosis for BRCA patients with radiotherapy. This finding may help to improve understanding of BRCA patient survival after radiotherapy, and the authors identified high-risk patients for better disease management. The validation data also indicated that the results might be reliable for molecular prediction in BRCA patients with radiotherapy. These biomarkers might be useful inference for clinical decision. Although this study has some limitations in prediction for BRCA radiotherapy, the model constructed by integrative RNAs performed good robustness between TCGA and GEO dataset. With growth of data from BRCA patients, more and more factors would be considered in this model. In the future, the authors will constantly adjust their model by growth data for more accurate diagnosis for radiotherapy.
Footnotes
Acknowledgment
The authors thank the staff of the Key Laboratory of Evidence-Based Medicine for their excellent assistance.
Disclosure Statement
No competing financial interests exist.
References
Supplementary Material
Please find the following supplemental material available below.
For Open Access articles published under a Creative Commons License, all supplemental material carries the same license as the article it is associated with.
For non-Open Access articles published, all supplemental material carries a non-exclusive license, and permission requests for re-use of supplemental material or any part of supplemental material shall be sent directly to the copyright owner as specified in the copyright notice associated with the article.