
Abstract
Radiation-induced salivary gland dysfunction is the most frequent side-effect of I-131 thyroid therapy. Here, a novel saliva sampling method with ordinary chewing gums administered to the patients at appropriate time intervals post-treatment (TIPT) was used to relate this effect to chewing gum saliva activity (CGSA) content. Saliva samples were acquired after the oral administration of prescribed I-131 activity (radioactivity administered [RA]) to 19 differentiated thyroid cancer (DTC) and 16 hyperthyroidism patients of the radioisotope unit (RIU) during 2014 and 2015. The error of this saliva collecting process was found to be 1.2%–2.05%, and so, the method was considered satisfactory. For each patient, the CGSA was plotted against the TIPT producing a curve, R(t). On this, two functions were fitted: a linear on the first few rising data points and a gamma variate over the peak of the R(t). From these, several parameters related to the radioactivity oral transit were calculated and the total radioactivity administered (TRA) during all past treatments of each patient was obtained from RIU records. The patients were asked to report any swelling, dry mouth, taste–smell change, or pain and were graded as a morbidity score (MS) describing the quality of life of each. The peak radioactivity in the saliva samples, R max, was found to be proportional to RA and was plotted against the CGSA extrapolated at 24 and 36 hours. The linear fits produced were used to estimate the salivary glands' activity average effective half-life (16.3 hours). The MS of DTC patients was found to depend linearly both on R max and TRA (MS = 0.0032 × R max − 0.7107 and MS = 0.1862 × TRA +0.66, respectively). Both lines were used to extrapolate symptom thresholds. The measurement of R max in DTC patients proved very useful for individualized radiation protection, and the dependence of MS on TRA should be used when additional treatments are considered for repeat DTC patients.
Introduction
Iirradiation-induced salivary gland dysfunction is the most frequent side-effect of I-131 therapy. 1 Patients treated both for differentiated thyroid cancer (DTC) and for hyperthyroidism (HT) receive orally an appropriate activity of I-131. The radioiodine moves through the digestive track into the blood stream where it circulates again and again. From there, most of it will be washed out by the kidneys and a fraction will localize in the thyroid tissue that is still functioning. A much smaller fraction appears quickly in the saliva and it is slowly recycled through the digestive system in a well-documented process. 2 –4
The transit of radioiodine through the salivary glands is of concern mostly because of the local exposure of the patient to the same kind of 606 keV electrons that are used to ablate the thyroid. Also, because of the possibility of contaminating others through the dispersing of radioactivity by sharing food, sneezing, coughing, kissing, and so on. The instructions designed to deal with the later issues are still an important part of the radiation protection procedures designed for ablated thyroid patients. Regarding the former, salivary gland dysfunction has often been reported in treated patients with symptoms of swelling, sialalgia, xerostomia, and taste disturbances. Salivary gland dysfunction is usually observed within a week of treatment and less often after about 3 months. Sometimes it is observed even after more than 1–2 years, but it may also appear much later. In one occasion, symptoms were observed as late as 23 years after treatment. 5 In one study, a fraction of about 34% and 10% of the patients treated were found with early and late sialadenitis symptoms, respectively. 6 However, in another, persistent complaints of salivary gland dysfunction were present in 54.5% of treated patients during more than 1 year of follow-up and in 60.6% of patients during more than 2 years of follow-up. 7
As expected, sialadenitis incidence and symptoms have been reported to increase with the administered radioactivity. In one such study, sialadenitis was 2.47 times more likely to occur in patients who received more than 150 mCi (5.55 GBq) of I-131 when compared to those who received less than that 8 and in another, significant differences were demonstrated in the development of sialadenitis between patients given 3700 and 5550 MBq, while for those receiving low activity I-131, as in HT patients, treatment sialadenitis was very rare. 9 However, in one occasion, some symptoms have been reported even for a much lower 4 mCi (148 MBq) activity administered for diagnostic purposes. 10
When I-131 is administered orally, it will be absorbed quickly and will appear in the saliva suddenly resembling the behavior of a bolus. The shape of such a time–activity curve R(t) observed in distal microcirculation because of the passage of a bolus of radioactive isotope can be represented by a highly skewed Gaussian curve with an exponentially decaying tail. With such a type of administration, the gamma variate function represents a suitable curve fit approximation. 11 The committed dose equivalent or cumulative dose to the salivary glands depends on the total radioactivity that is passing and recirculating through them. Since the blood flow is directly involved in the production of saliva, the first pass of the radioactivity was considered suitable for simulation with the gamma function. 12
Salivary gland stimulation can be effected by mastication and/or by the use of sialogogic agents such as sour confectionaries. Both cause an increase in the blood perfusion of the glands increasing the interstitial fluid, which will then pass into the gland cells and will be secreted as saliva in the mouth. Up until recently, it was assumed that the stimulation of the salivary glands right after the administration of I-131 decreases radioiodine transit time and consequently reduces their exposure to radiation. In the 1980s, Creutzig 13 claimed that salivary glands' stimulation induced by lemon juice decreased radiation exposure 5–10 times, and Van Nostrand et al. 14 agreed although they estimated a much lower reduction factor between 1.3 and 1.7. Continuously sucking or chewing on lemon slices during radioiodine therapy was considered an effective radiation protection practice and the European Association of Nuclear Medicine recommended this procedure in their current guidelines. 15
However, some work has recently appeared claiming the opposite result. It has been proposed that since stimulation increases saliva flow, it also increases the radioactivity that is transported there. Consequently, the dose administered to the salivary glands should increase also. 9,16,17 This was concluded by Jentzen et al. 16 : the stimulation of the salivary glands by lemon juice increased their blood perfusion when compared to no stimulation at all or to just chewing gum base, and consequently, the absorbed doses during lemon juice stimulation were found to be significantly higher than those of the group chewing gum base. 16 Similar results were published by others. 9,17 So, despite the guidelines in the current treatment protocol for radioiodine therapy of the thyroid, 15 it seems that the result of lemon juice stimulation shortly after I-131 administration should be avoided.
The transit of radioactivity through the salivary glands has been assessed by γ-camera scanning of ablated patients or by using orally administered diagnostic I-131 at an appropriate time. PET/CT scans have also been performed with injections of I-124. 17 Tc-99m pertechnetate scintigraphy has also been used, which is supposed to simulate the transport of iodine without the disadvantages of the long half-life and the beta emissions of I-131. 6 In all of those imaging methods, some calculation of dosimetry can be performed, but it is not a simple procedure for excised DTC patients and requires close cooperation of other medical specialists. In addition, all such scans provide short-term functional images of the salivary glands representative only of the acquisition's duration and require complex scheduling with diagnostic nuclear medicine. The main disadvantage of the scintigraphic method is the relatively short scanning period, usually not more than a few tens of minutes. This restriction is dictated mostly by the discomfort to the patient and the interference with the department's throughput. Rescanning of the same patient at wide intervals later on also presents a problem since it is not practical to bring back the patient several times during the next couple of days. So, the period for salivary gland imaging is usually too short when compared to the expected total duration of the radioiodine presence in the saliva. The simplest way to obtain information about its transit over longer periods is by collecting actual saliva samples and measuring their I-131 content. To do this, it was decided here to use a novel saliva sampling method using chewing gums. The radioiodine passage through the salivary glands would then be simulated by a gamma function allowing the quantification of the radioactivity transit and its possible correlation to salivary gland dysfunction.
Method
A total number of 35 patients were involved in this study, all of them treated with I-131 during 2014 and 2015. Of those, 19 were treated for DTC and were hospitalized in the radioisotope unit (RIU) for a few nights. The rest were treated for HT as outpatients. In accordance to the RIU procedure, patient data such as name, weight, number of previous treatments, date, time, and I-131 capsule activity at administration were recorded for all of them. From the RIU DTC patient database, the following information was also obtained and added to each patient's record: (i) the total radioactivity administered (TRA) during all past treatments and (ii) the external dose rate measurements of the patients so that the reduction of the radioiodine could be used to calculate the excretion effective half-life (eEHL) for each patient according to the RIU protocol. 18 In addition to the above data, when the DTC patients were hospitalized or during the HT patients visit for treatment, saliva samples were obtained from all of them and the radioactivity in each was measured. A few extra samples were also acquired in some cases when it was convenient for returning patients. These samples were used to assess I-131 flow through the salivary glands and the easiest way to collect them would be by using ordinary chewing gums. These were commercial confectionaries with a slightly sour flavor chosen so that, in combination with mastication, its taste would cause mild stimulation of the saliva flow. Hence, enough radioactivity would be secreted and become available for collection. Tasteless gums were rejected because it was thought that they would produce less saliva than what might be needed for a sufficient sample. The same brand of chewing gums was always used for all patients. The chewing duration was chosen to be 5 minutes, which was considered long enough to achieve full mixing and gum saturation with saliva. The effectiveness of this procedure in collecting equal amounts of saliva on each chewing gum was tested first by doing a dry run. In one occasion, 10 gums were successively chewed, and then, the residue of each was weighted with a high-accuracy electronic scale. The average weight of the intact gums (minus paper wrap) administered was 2.055 ± 0.0084 g. After 5 minutes of chewing, although some saliva was added, the gum's edible part had been digested away resulting in a net reduction of its weight. This, including the mixed saliva, was found to be on the average 1.091 ± 0.022 g per gum. This assessment was also repeated a few times at random using the actual gums chewed by a patient during the data collection process. The additional tests confirmed the repeatability of the saliva collection process. The coefficients of variation of the residues' weight varied between 1.2% and 2.05%. These low values indicated that the amount of saliva incorporated to each chewed gum was similar, and hence, the method was reliable to be used for sampling.
To obtain the samples of the patients' saliva, chewing gums were administered at appropriate but not identical time intervals after each I-131 treatment. The first was chewed about 10–15 minutes after capsule administration and then about every 15 minutes until the activity measured in the saliva peaked. After that, the time intervals were increased first at about 30 minutes and then at about 45–60 minutes. The HT patients were discharged soon after this period. However, hospitalized DTC patients were offered several more gums during their stay, especially in the evening and in the morning at irregular intervals. All patients were instructed to chew on them for exactly 5 minutes and were timed in the presence of RIU staff. Then, without touching it, each residue was carefully collected in a suitable plastic container, which was marked, sealed, and measured in a properly zeroed dose calibrator with a minimum sensitivity of 1 kBq (PTW Freiburg, CURIEMENTOR 3/4). The accuracy and linearity of the dose calibrator had been validated through the independent quality assurance procedures of the RIU and were confirmed by independent, comparative measurements with a scintillator probe.
The I-131 activity in the sample, together with the date and time collected, was recorded in the RIU logbook on the container and then stored for future reference. The measurements of the radioactivity in the samples were processed by first calculating the time interval (dt) of each sampling since the date and time of administration of the I-131 capsule to each patient. Then, the activity measured in each sample was entered in an Excel sheet and plotted against the corresponding dt as a percentage of the initial activity of the capsule radioactivity administered (RA) at treatment. Such typical time–activity curves appear in the examples in Figures 1 and 2 for DTC patients and in Figures 3 and 4 for HT patients.
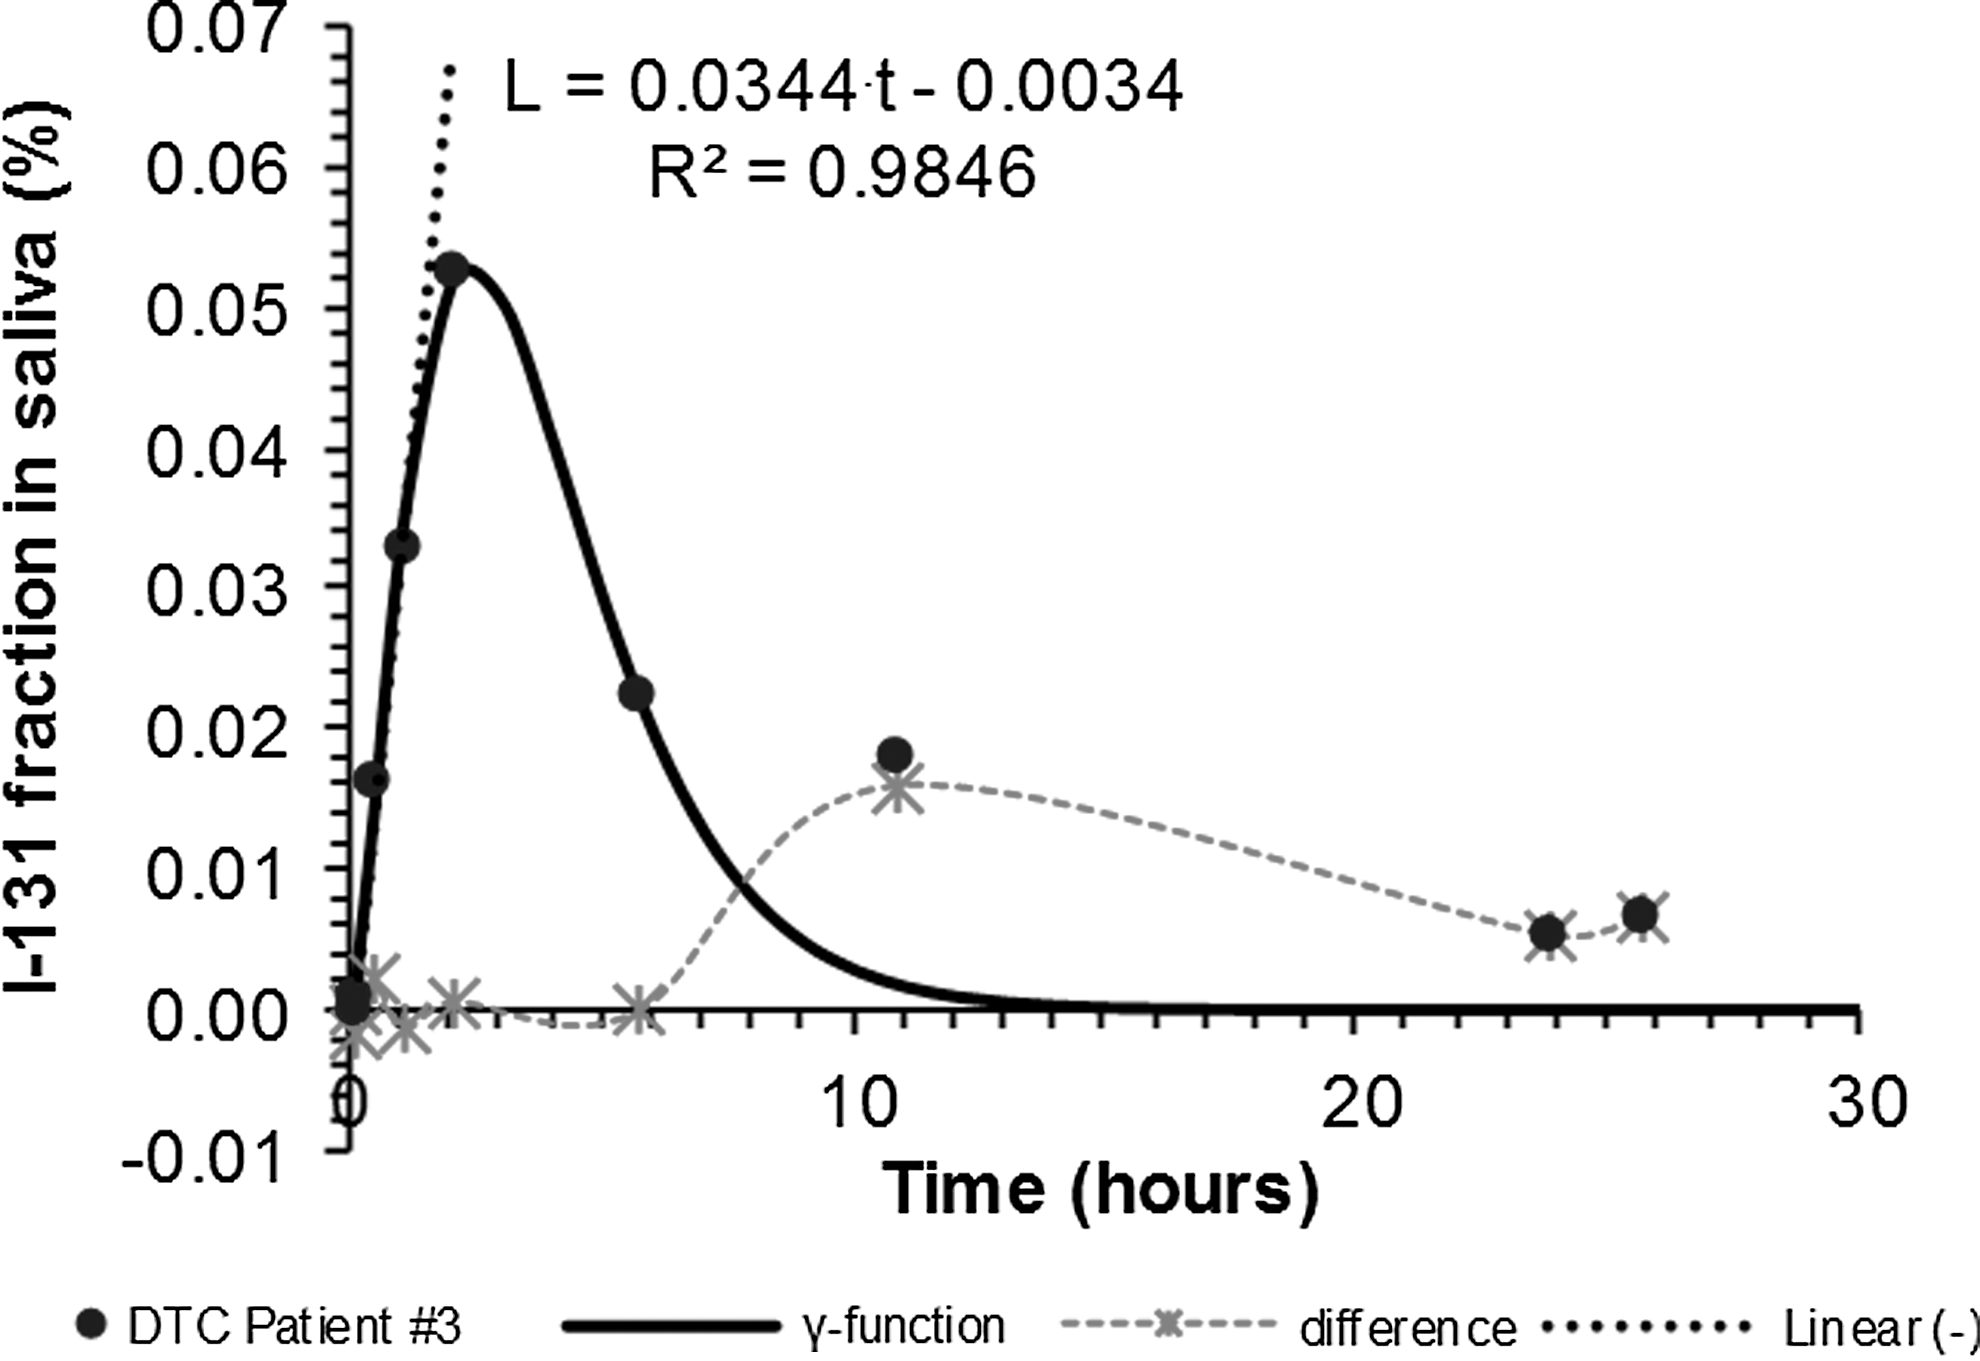
Variation of I-131 activity in the chewing gums of DTC Patient #3 with time. Chewing gum activity is presented as a fraction of the RA. DTC, differentiated thyroid cancer; RA, radioactivity administered.
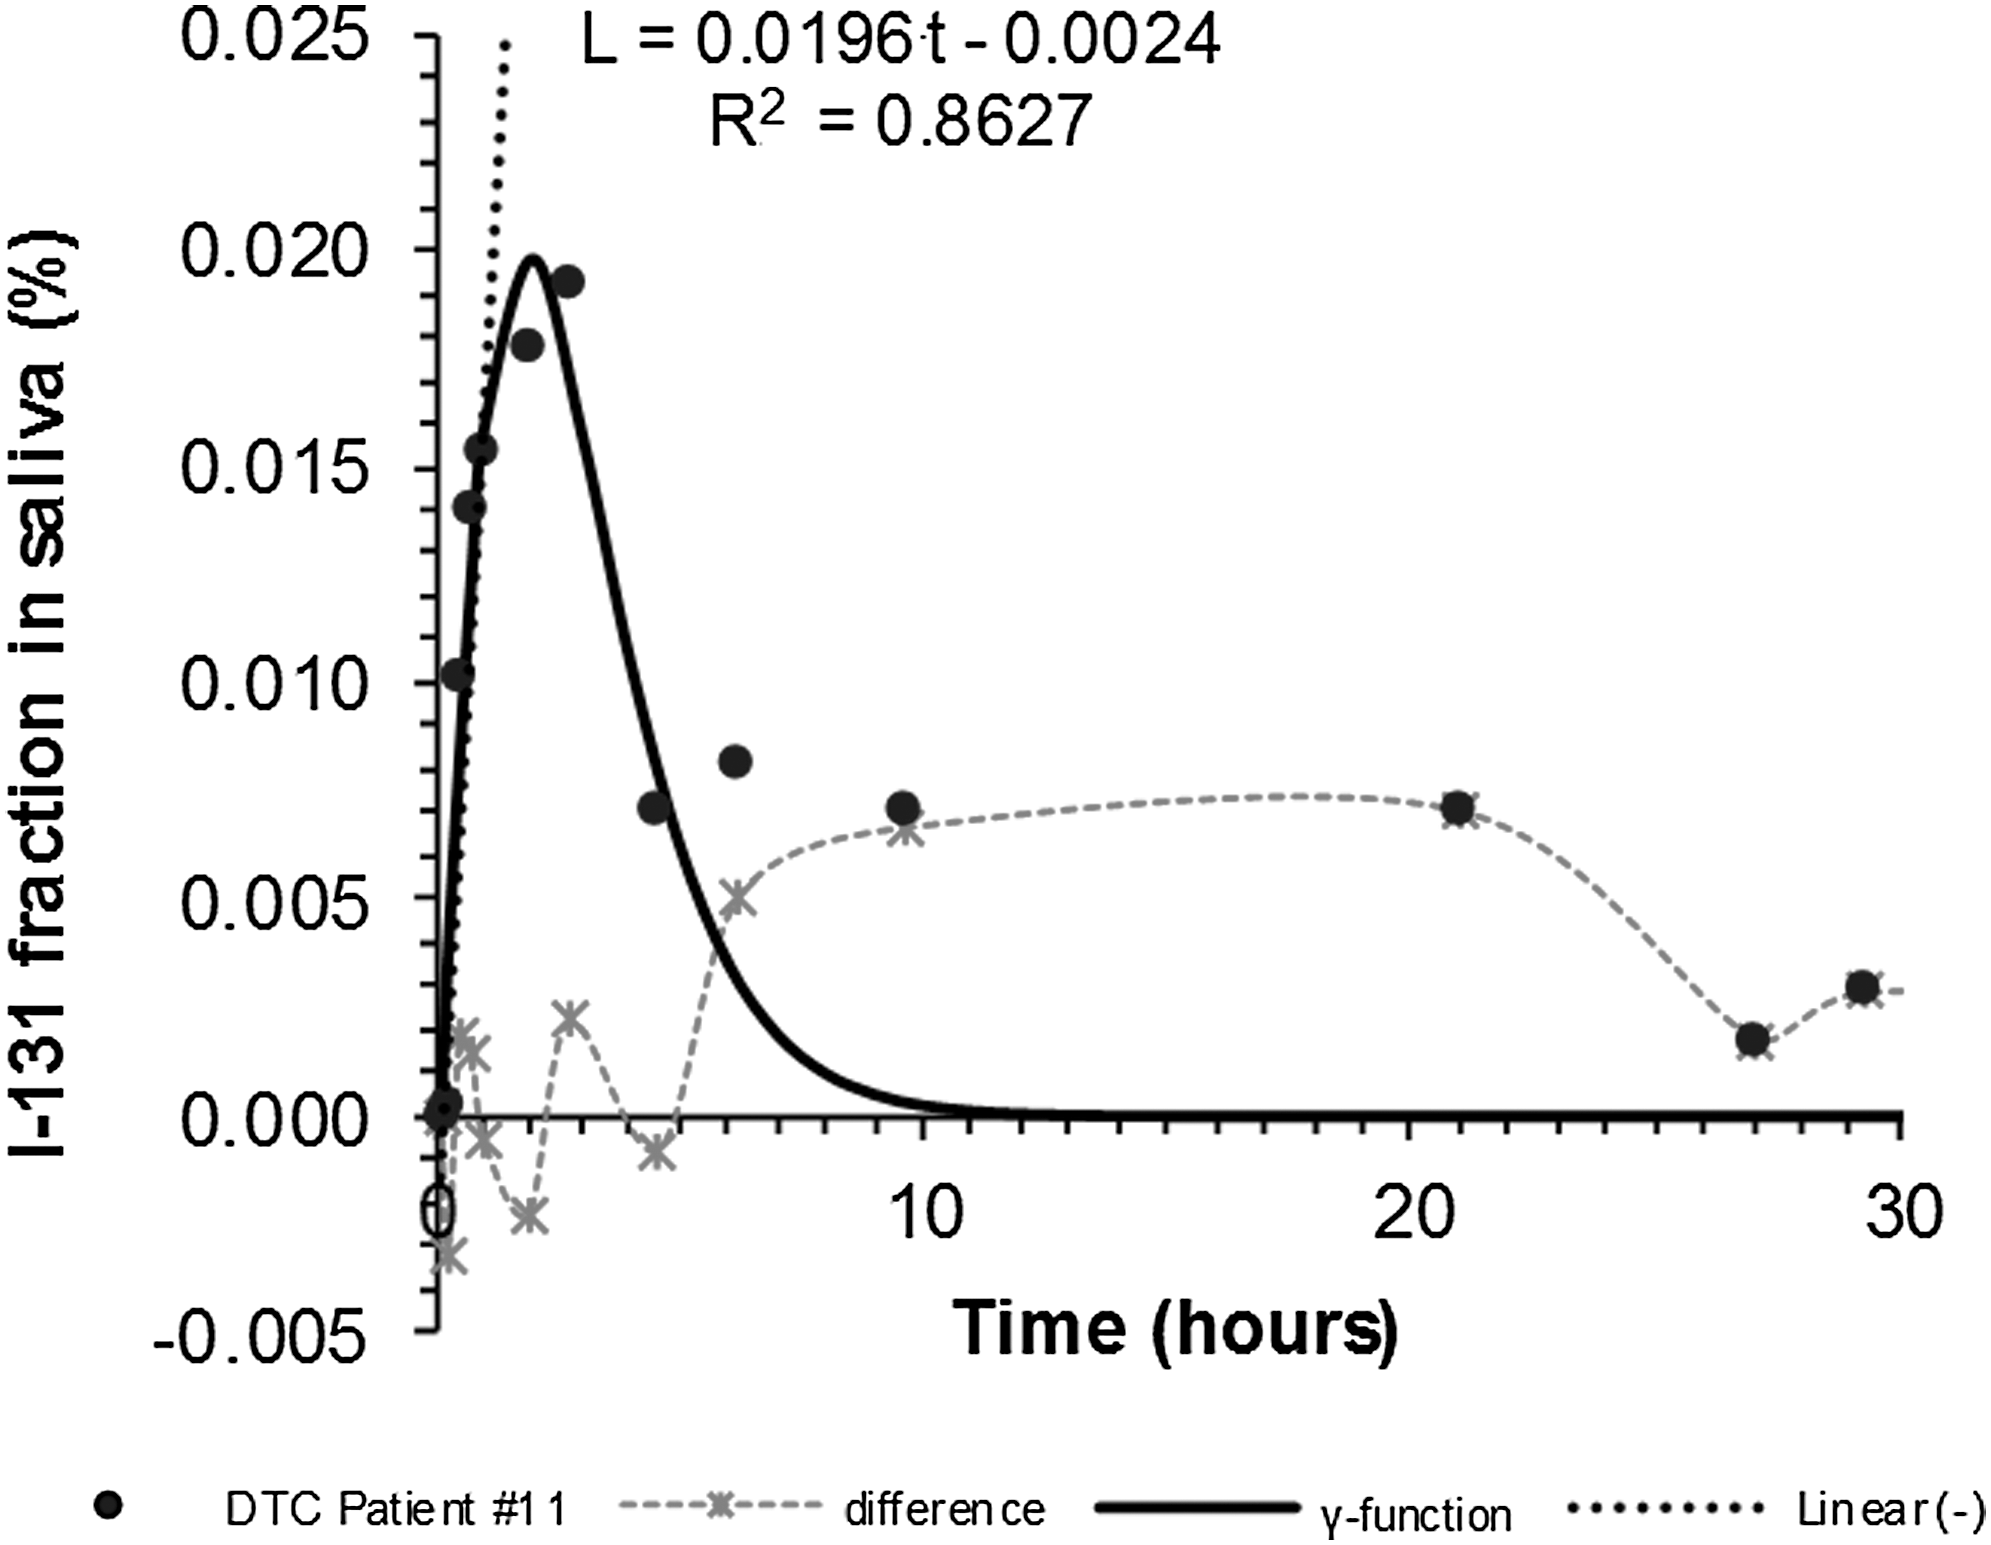
Variation of I-131 activity in the chewing gums of DTC Patient #11 with time. Chewing gum activity is presented as a fraction of the RA.

Variation of I-131 activity in the chewing gums of HT Patient #14 with time. Chewing gum activity is presented as a fraction of the RA. HT, hyperthyroidism.
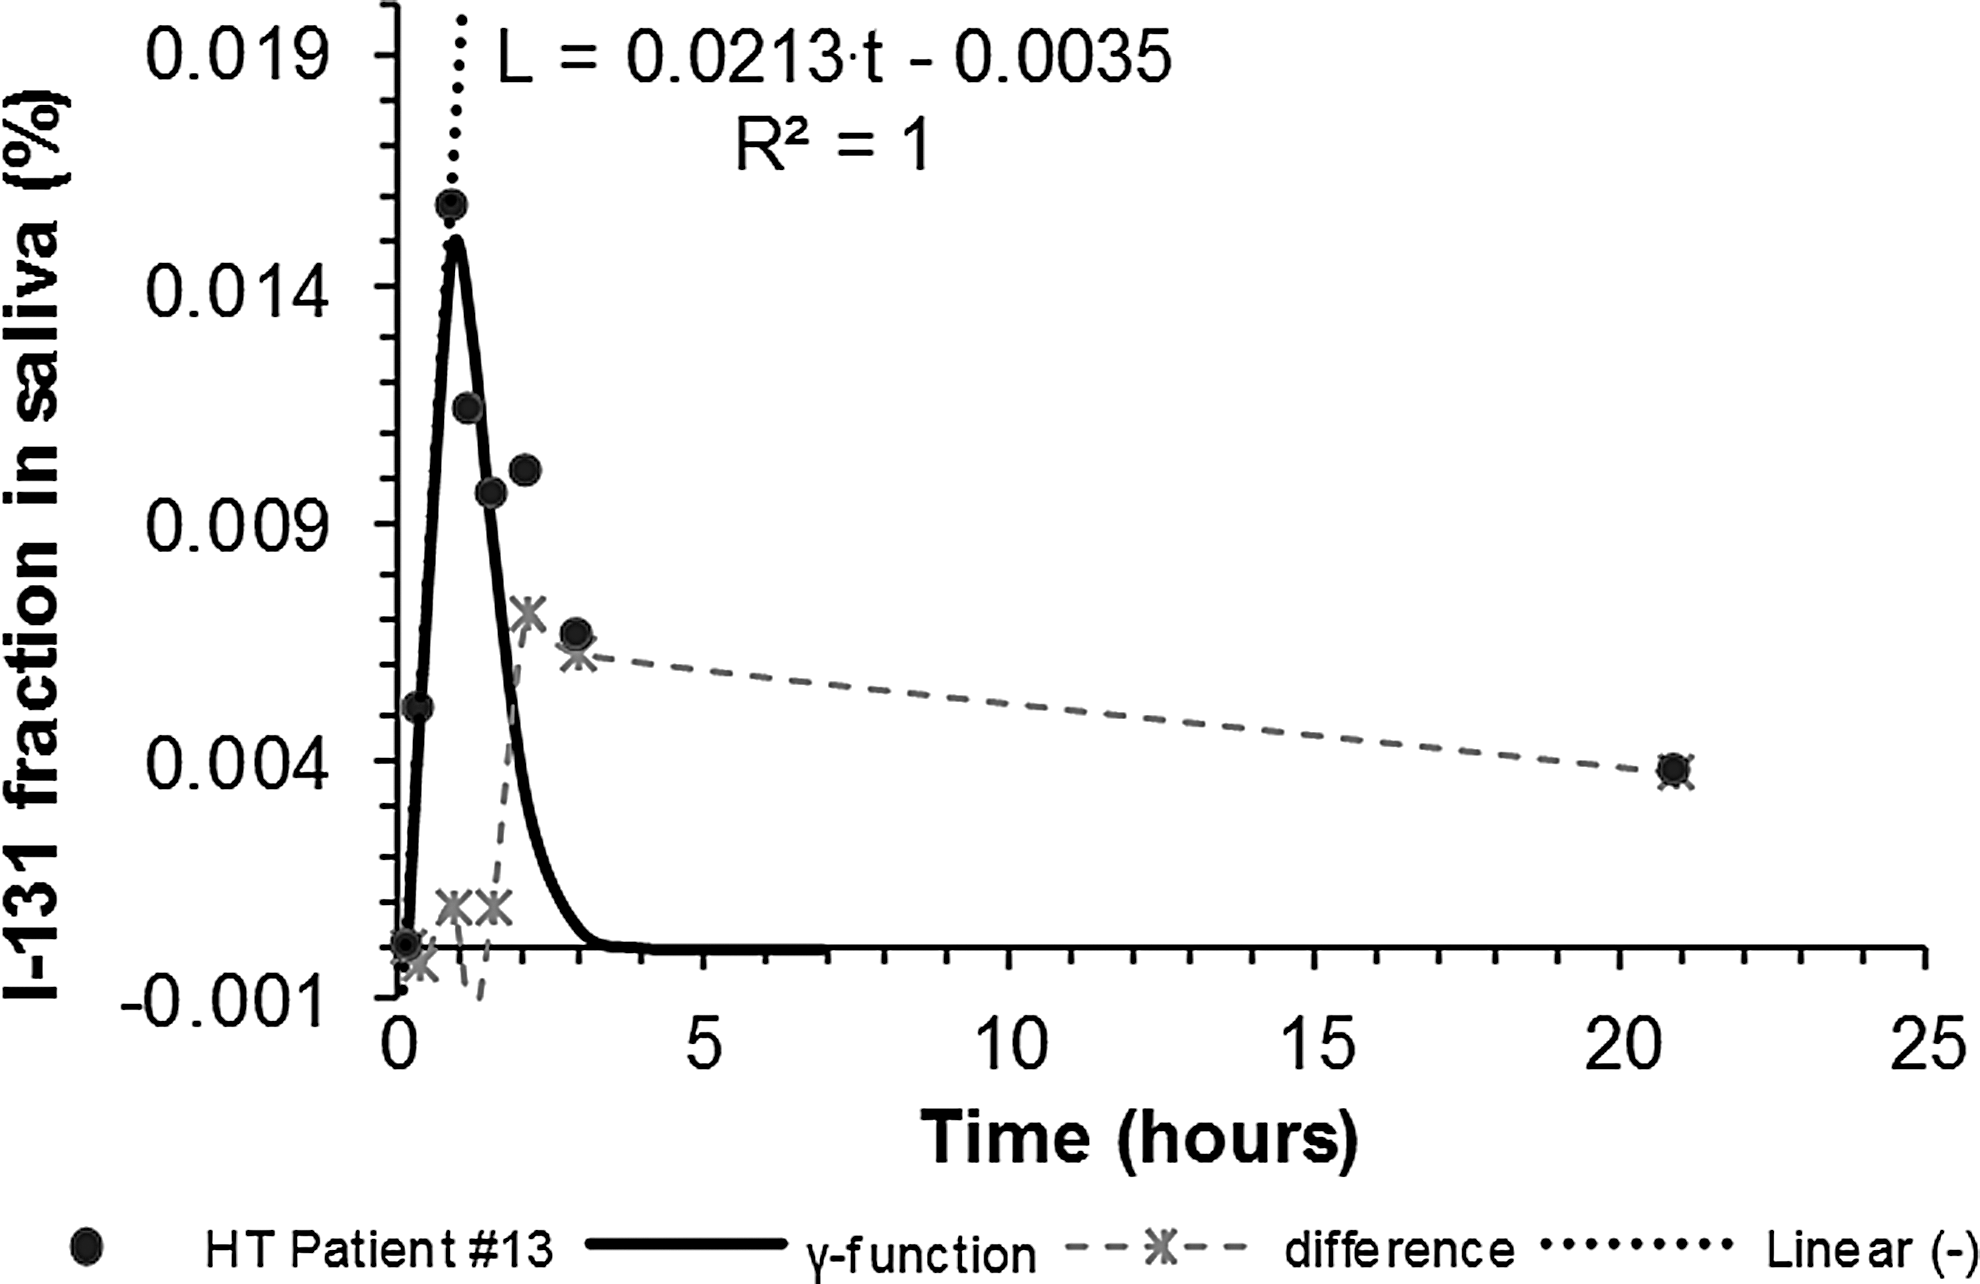
Variation of I-131 activity in the chewing gums of HT Patient #13 with time. Chewing gum activity is presented as a fraction of the RA.
On the plots from all patients, two separate functions were fitted:
The first was a linear equation of the form L(t) = κ · t − μ and it was fitted using the appropriate Excel tool on the initial part of the time–activity curve, which comprised a few points that could be perceived to lie on a straight line. This was done to find the point of intersection of this linear function with the x-axis. The actual data points used for this were chosen by visual inspection of the graph and usually were between 2 and 4. The time interval represented by the intersection point was calculated by solving L(t) = 0. The result [Eq. (1)] was the time interval since the administration of the I-131 capsule to the patient for a detectable radioactivity to appear in the saliva sample, that is, the radioactivity appearance time (RAT)
12
:
The second was a gamma variate or γ-function
12
of the form:
where:
R(t) = the I-131 radioactivity measured in a sample
t = time since administration
t a = time of first appearance of radioactivity (RAT)
a, b, and c = constants.
Using the Solver tool of Excel, the gamma function was fitted on the initial rising peak of the graph, which was considered to represent the first passage of I-131 through the salivary glands. The data points were chosen again by visual inspection. The quality of the fit was assessed both visually and by the calculation of the square of the correlation coefficient (CC) between the actual data and the predicted values of the fitted gamma function. This was also done using the available Excel tool. When considered necessary, the fit was optimized by varying the number of data points that were included in the calculations. The patients' CC values calculated thus ranged between 0.79 and 1 but most were over 0.95, indicating quite good fits. If the gamma function curve was subtracted from the actual data points, the difference could be considered to describe the recirculation of radioactivity through the digestive track (Figs. 1 –4). The time interval for the second pass could be found visually by locating the peak on the difference curve and subtracting the corresponding time from the first peak time.
The simulation of the I-131 flow with a gamma function permitted the calculation of three additional parameters,
11,12
which, together with the RAT presented above, adequately described the speed of the radioactivity's first transit through the salivary glands: (i) the time for half the radioactivity to go through the glands, usually named mean residence time or mean transit time (MTT), (ii) the height of the first peak radioactivity, and (iii) the time taken for the radioactivity to reach this peak. These parameters were calculated from Equation (2) using simple algebra. First, the MTT was calculated as follows:
Second, the peak of the gamma function corresponding to the maximum activity reached (R
max) was calculated by taking the derivative of Equation (2) and equating to zero, that is, dR(t)/dt = 0. Then by solving:
Depending on whether the R(t) data were absolute chewing gum radioactivity or a fraction of this over RA, the peak was described as R max or %R max, respectively.
And third, the time (t
max) to reach R
max was found by substitution of Equation (4) into Equation (2)
12,19
:
Finally, the DTC patients' actual time–activity curves were used to estimate the remaining activity for hypothetical samples at 24 hours and at 36 hours after capsule administration by using simple interpolation. The interpolated values were used to check for a possible relationship with the peak activity in the saliva samples of the DTC patients. This was not done for most of the HT patients since no samples had been collected after the first few hours.
The presence of I-131 in the patients' saliva has been known to cause adverse effects, 1,5 –7 and the need for quantification of salivary dysfunction has arisen a long time ago, mostly because of the effects of head and neck external beam radiotherapy. The quality of life of treated patients is usually evaluated by summing up scores assigned to various questions put to them. 20 Many such questionnaires have been proposed in the past mainly for xerostomia, for example: Common Terminology Criteria for Adverse Events, Visual Analog Scale, 21 M.D. Anderson Dysphagia Inventory, University of Washington Quality of Life, Xerostomia-Related Quality of Life Scale, 8 Xerostomia Score, 20 Summated Xerostomia Inventory, 22 and Groningen Radiotherapy-Induced Xerostomia. 23 However, being all of a subjective nature, it has been difficult to reach a consensus on their success in quantifying salivary dysfunction. In addition, low interobserver agreement has been found in some such as in the Radiotherapy Oncology Group/European Organization for Research and Therapy of Cancer questionnaires, where there was also a tendency to underestimate the severity of the symptoms. 24
In this study, it was decided to develop a simple in-house patient questioning method, which comprised two or three telephone follow-up interviews spaced about a week apart. Such interviews were arranged for all the patients at least 6 months after treatment to inquire about possible salivary dysfunction symptoms. The patients' response was marked as 1 for “yes” or 0 for “no” and was recorded when all of each patient's interviews were consistent. Then, these responses were graded using a simple morbidity score (MS) that was considered appropriate. The patients were questioned specifically about the incidence and duration of face swelling, dry mouth, taste/smell alterations, and pain around the cheeks. Each of these symptoms had been assigned an appropriate weight factor to characterize the extent of its contribution to the patient's morbidity. These weight factors were 1, 2, 3, and 4, respectively, increasing with what was considered to be the gravity of the symptoms. The particular values were chosen using a patient-oriented reasoning. Face swelling with no pain could probably be ignored and so it was considered the least morbid symptom. Next was dry mouth, which could be a nuisance but a little sip of water often fixed it. The taste/smell change was more of a problem since it was always there (for as long as it lasted) and there was nothing one could do about it. Therefore, it was thought that it should rate more than a dry mouth. Pain was of course the worse symptom of the four and consequently had been rated with the maximum weight factor of 4. The rest were rated backward by subtracting 1 at each step. This rationale was thought sufficient to describe radiation-induced morbidity without complicating the follow-up procedure. Each individual's MS was calculated as the sum of the products of the response by the corresponding weight factors. As expected, the worse the symptoms the higher the score, but it also allowed for the grading of a combination of symptoms, which would not be individually severe but their concurrent appearance could lead to worse morbidity than a single symptom. The duration of the symptoms was graded as short and long depending on their appearance before or after 6 months since treatment. When immediate symptoms persisted up until the present, they were graded as both.
Results
Examples of activity in saliva time curves, together with the fitted linear function L(t) and the gamma function R(t), appear in Figures 1 and 2 for DTC patients and in Figures 3 and 4 for HT patients. The dotted lines there are produced by subtracting the fitted function from the data acquired and they represent the recirculation of the radioactivity through the digestive track. The I-131 transit data collected and the results obtained according to the method presented appear in Table 1 for the hyperthyroid patients and in Table 2 for the DTC patients. These curves were typical for most of the patients, but in some, R(t) increased again several hours after the initial peak in some DTC patients creating a second peak in the curve. An extreme such example appears in Figure 5, which depicts such activity–time curves for the same patient who had had two treatment sessions at about 6 months apart. This particular patient's data have been excluded from the processing presented here.
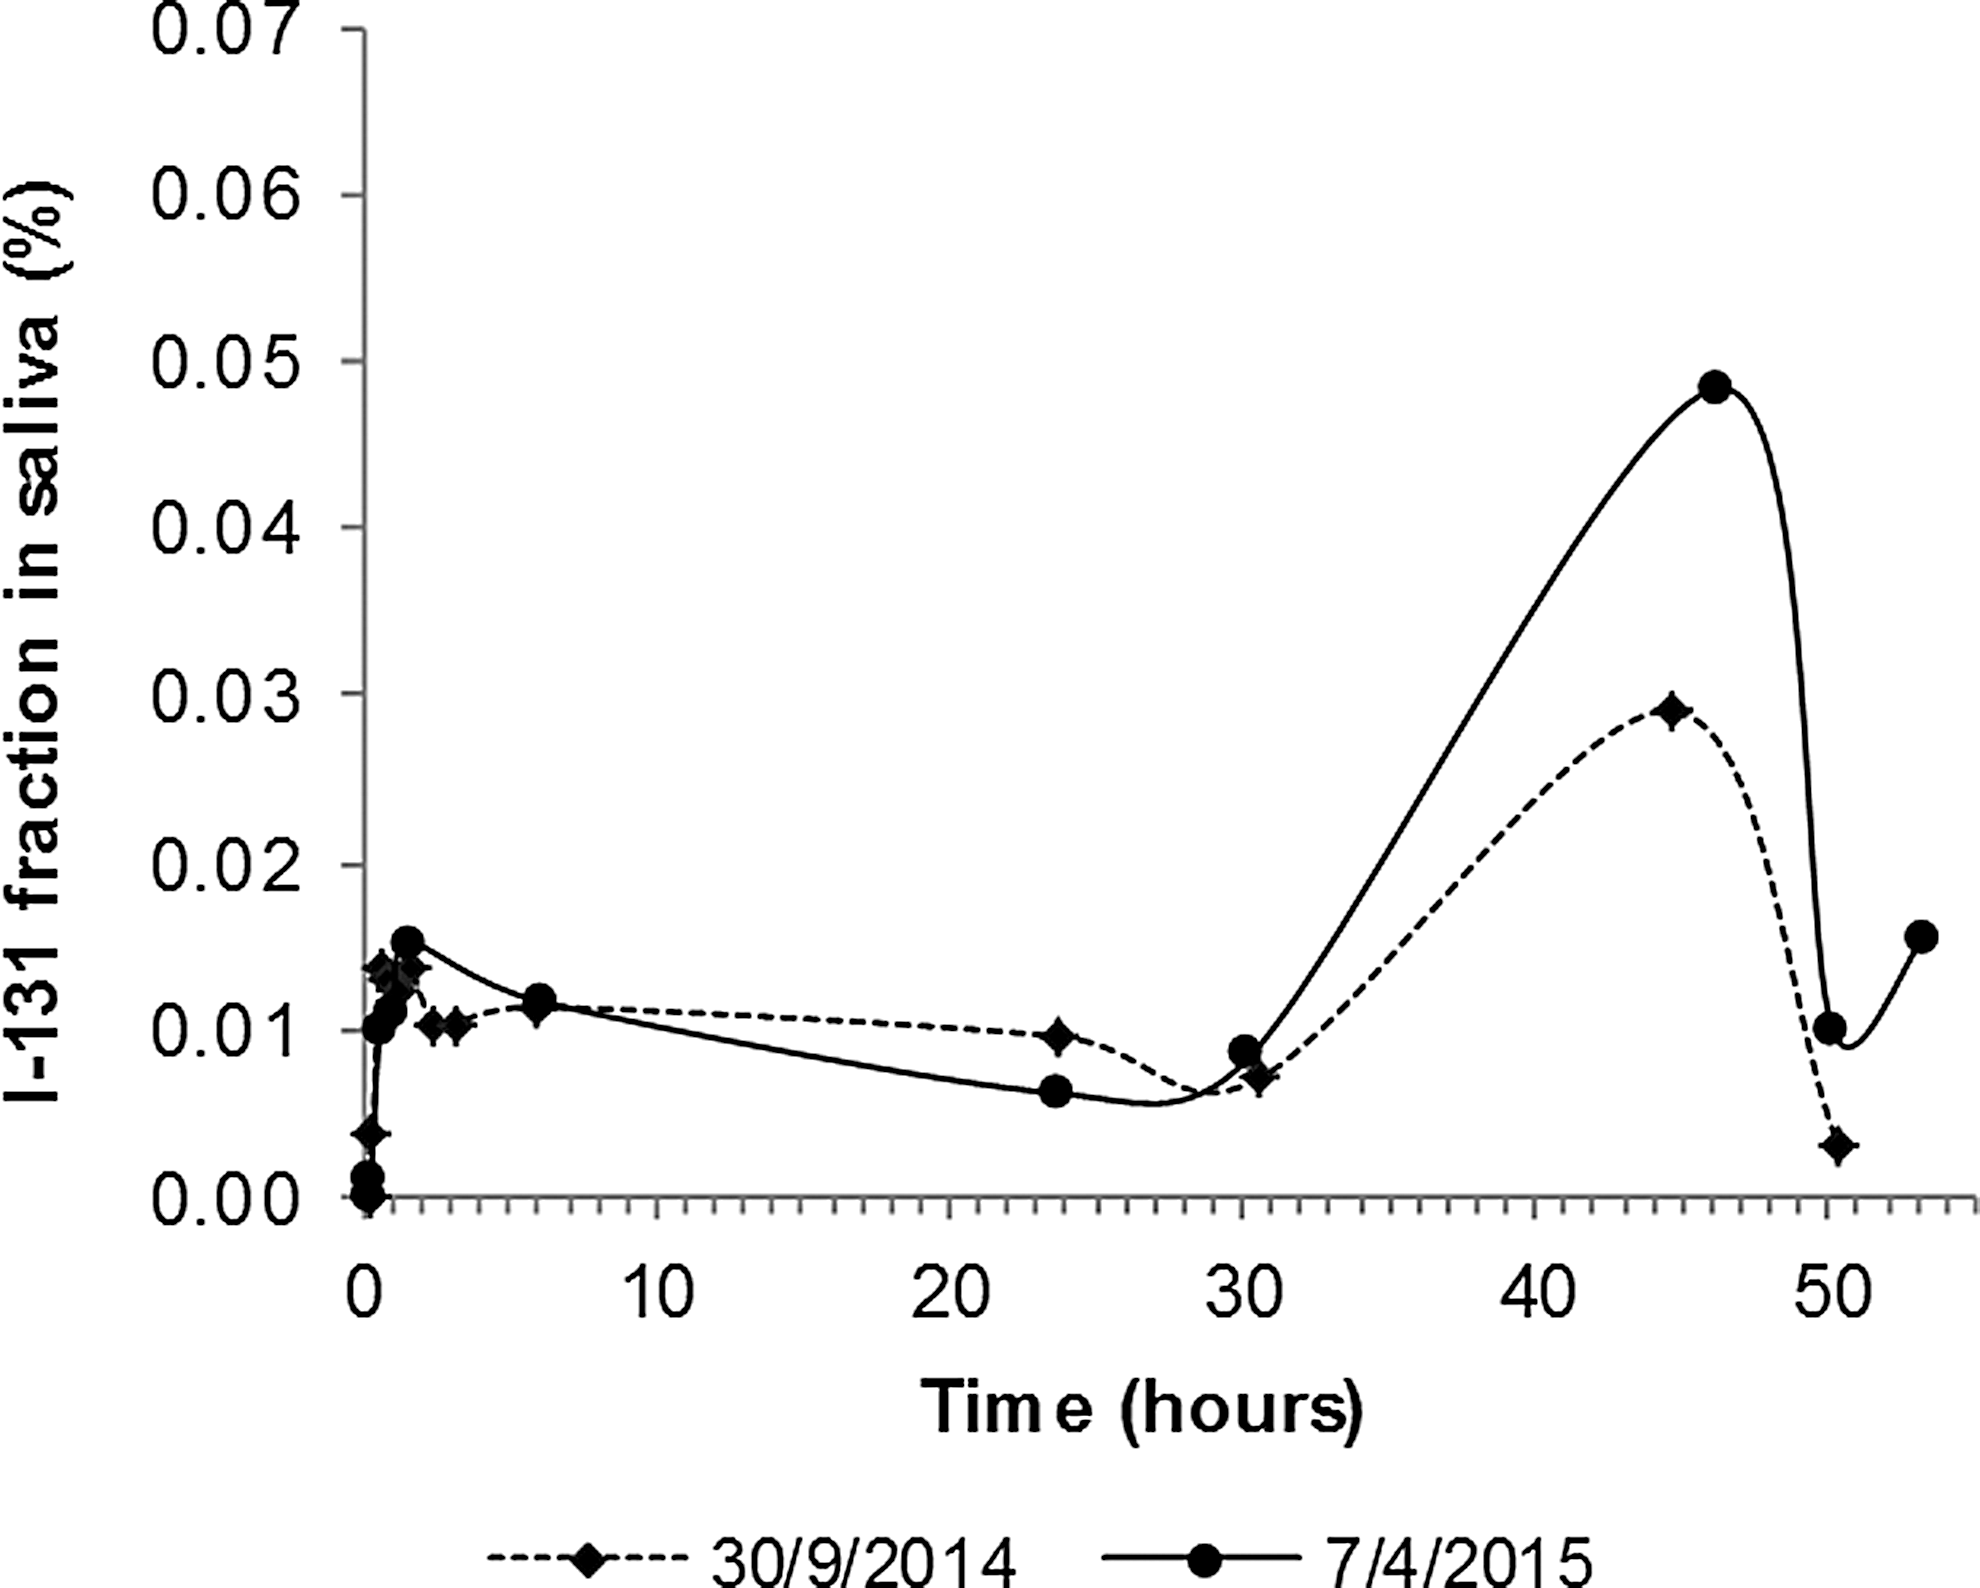
Activity of I-131 as fraction of the administered activity in the chewing gums of the same DTC patient treated twice at different dates about 6 months apart. No functions were fitted here.
Blank cells indicate unavailable data.
HT, hyperthyroidism; eEHL, excretion effective half-life; RAT, radioactivity appearance time; MTT, mean transit time; RA, radioactivity administered; SD, standard deviation.
Blank cells indicate unavailable data.
The DTC and HT patient groups' data were compared using the Student t-test to detect any significant differences between them. The patient weight in both groups was similar (p = 0.437) and so was the %R max (p = 0.793) indicating that the I-131 transit mechanism was the same irrespective of the size of the thyroid and its pathology or of the treatment radioactivity. Of course, the actual R max activity was quite different and it depended on the RA. However, the similarities ended here. The time to first peak t max (p = 0.031) and the MTT (p = 0.008) of the HT patients were significantly lower than those in the DTC group. In contrast, the RAT was significantly longer in the HT group (p = 0.001) and, as expected, so was the eEHL, which was obtained from the RIU database for each patient.
Looking into the results presented in Tables 1 and 2, some trends could be seen for RAT and MTT, which were both related to the transit of radioactivity through the salivary glands. When graphs were produced (Figs. 6 and 7), it was seen that in the HT group the RAT depended linearly on the patient weight. In the DTC patient group, the RAT was independent of weight as can be seen by the low value of R 2 = 0.0172 in Figure 6.
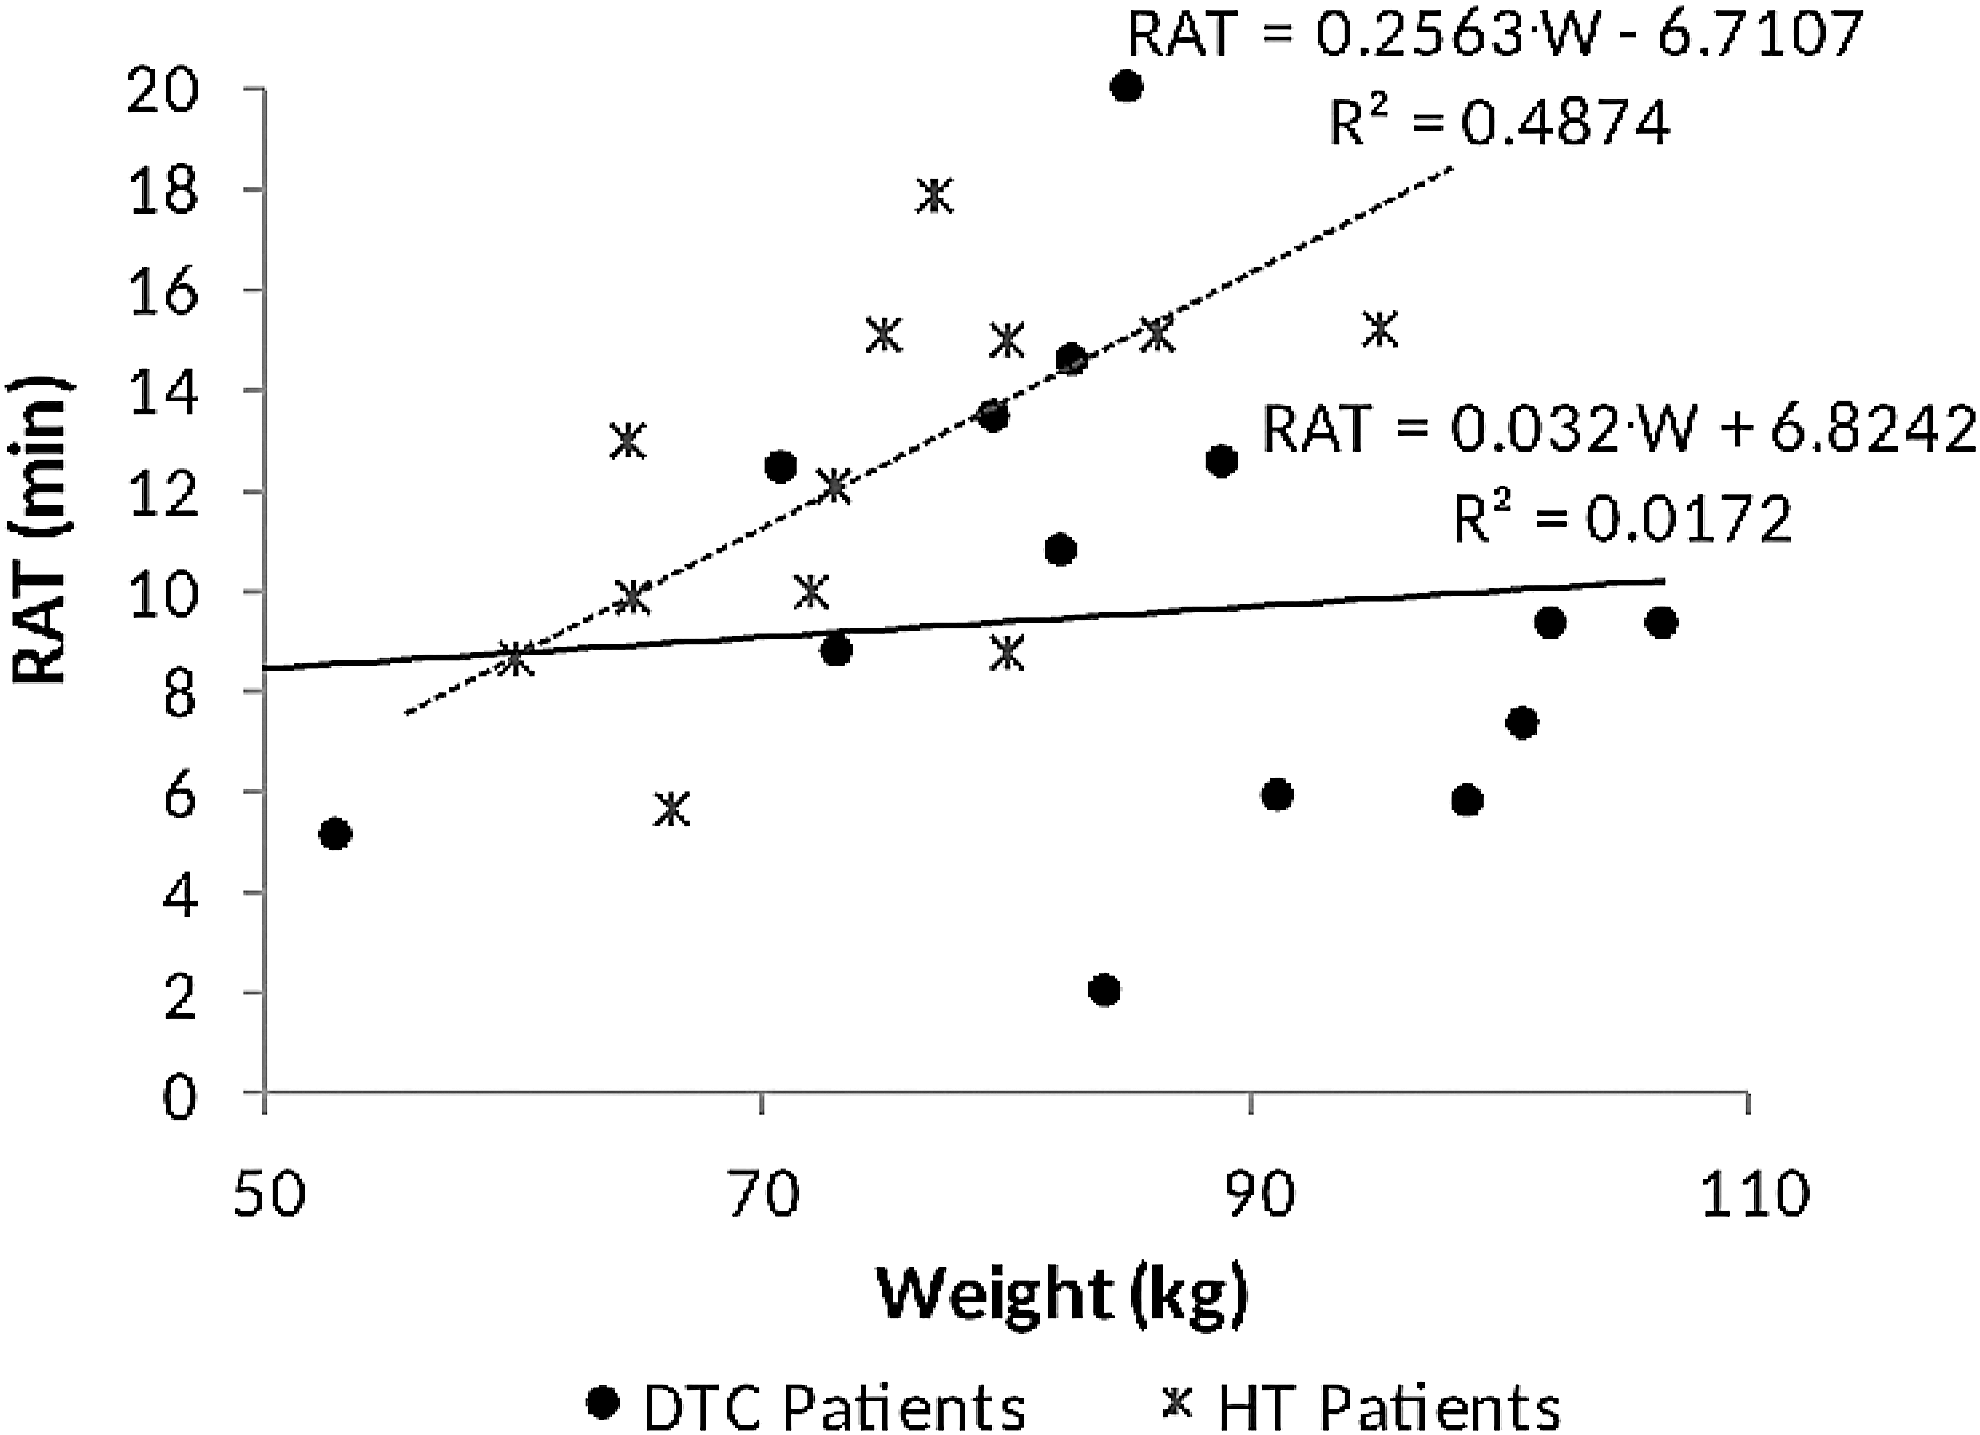
RAT in relation to patient weight. RAT, radioactivity appearance time.
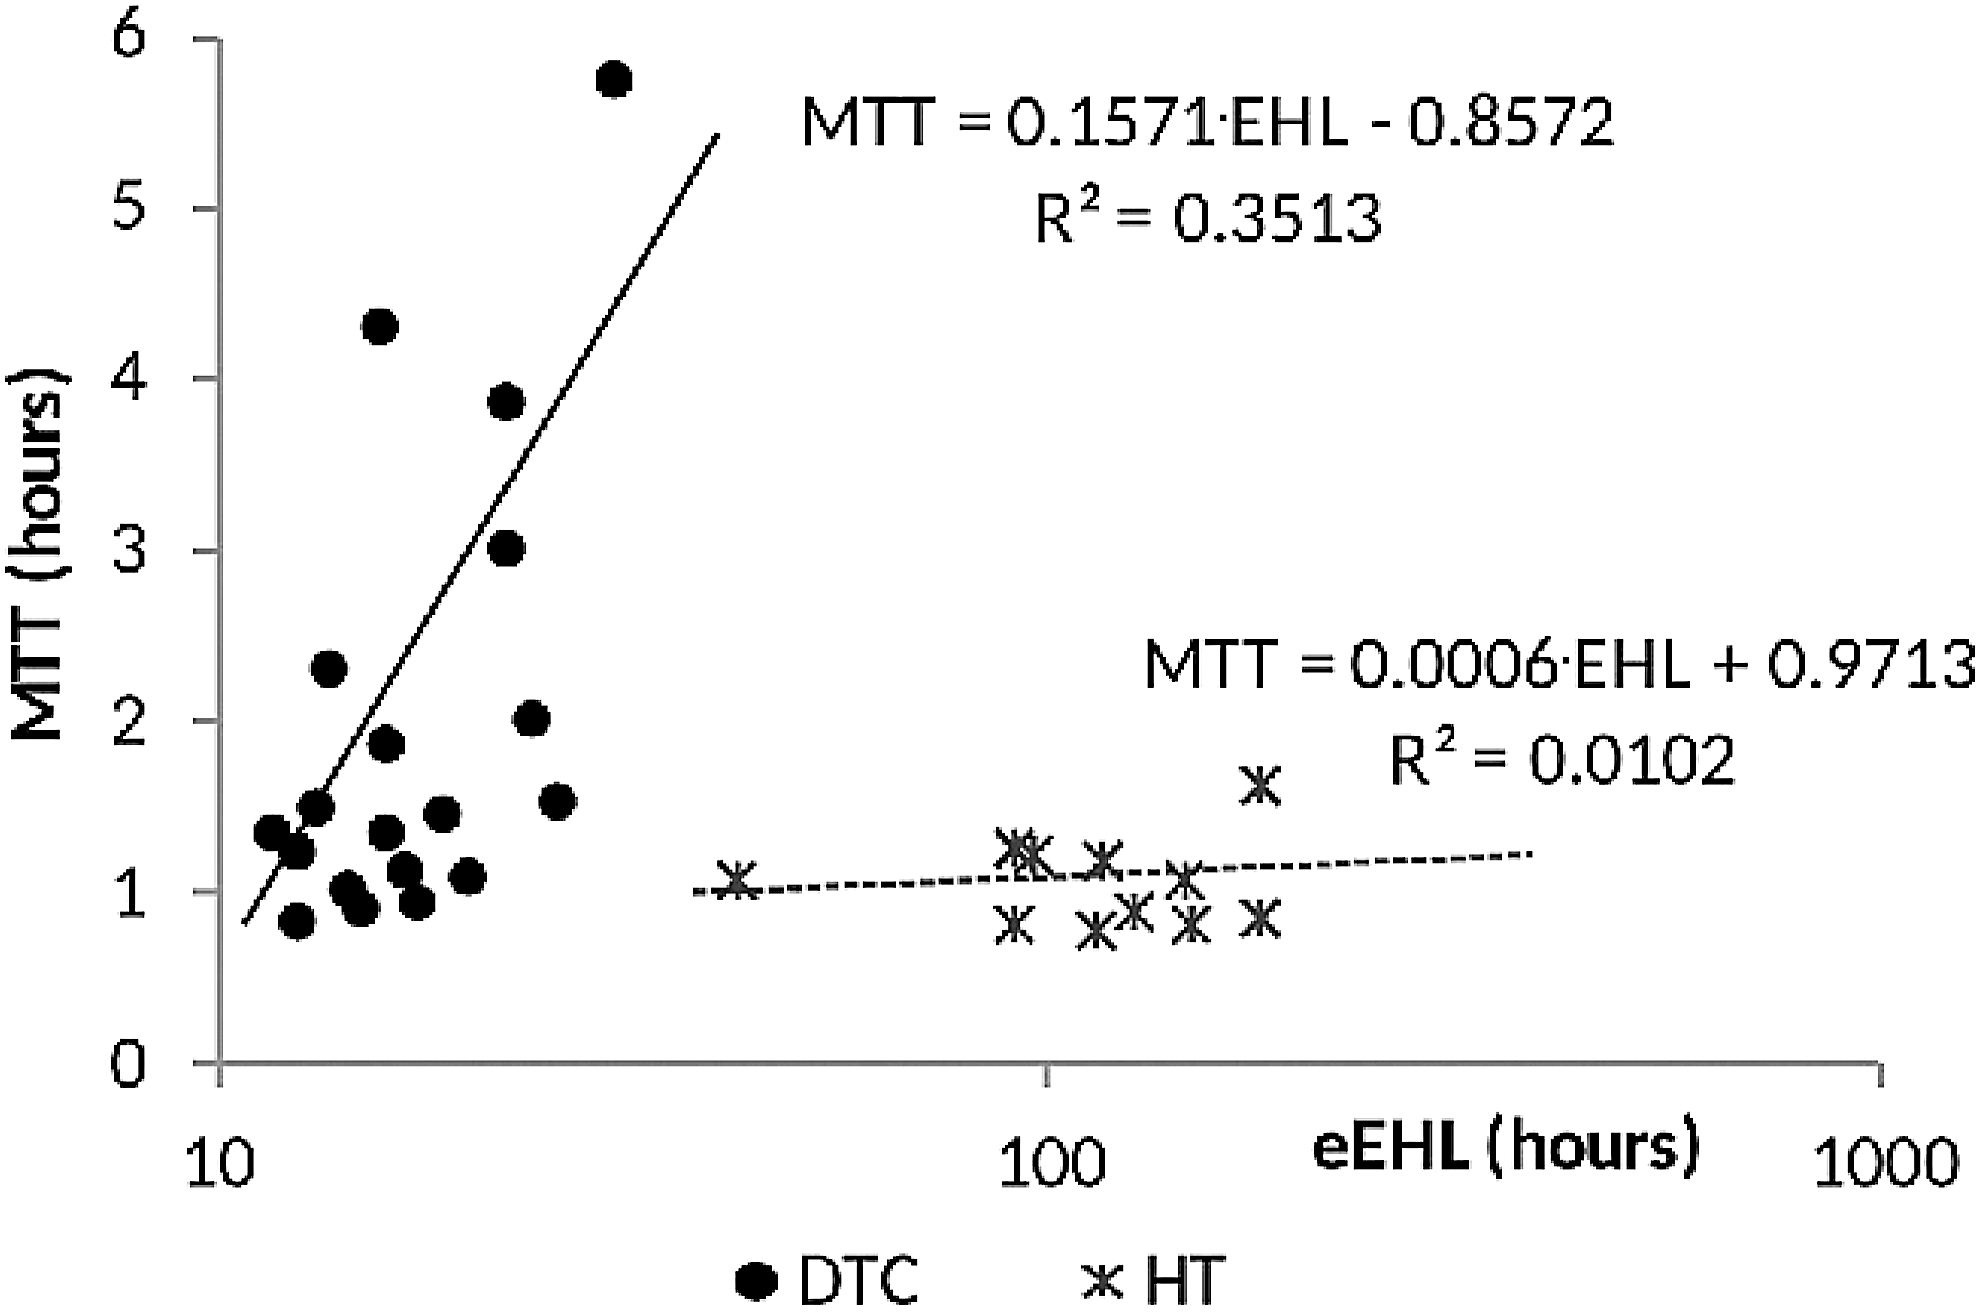
Variation of mean transit time with the patients' excretion effective half-life.
Regarding the MTT, a plot showed a linear dependence on the eEHL of the patients in the DTC group. For the HT group, the fitted linear function produced a very low R 2 value indicating that the eEHL and the MTT were independent of each other. Both functions appear in the graph in Figure 7.
To quantify the radioactivity remaining in the saliva after a considerable stretch of time, the DTC patients' time–activity curves were used to estimate the activity in hypothetical fixed-time saliva samples. The activity expected to be still there after 24 (R 24) and 36 (R 36) hours was interpolated from each patient's individual activity–time curve and is included in Table 2. Then, these data were plotted against R max in Figure 8. The fitting of functions on the data showed a significant linear relationship between the peak activity of I-131 in the gum administered to DTC patients and that estimated to remain there both at 36 and at 24 hours. The ratio of the gradients of these functions was 0.2557/0.4335 = 0.60 for a time difference of 12 hours. This ratio was used to calculate the effective half-life for the transit of saliva (sEHL) through the mouth of DTC patients to be about 16.3 hours. No long-term saliva samples had been acquired from most of the HT patients, so no such plot could be made for that group.

Variation of remaining I-131 activity in the DTC patients' gums with R max at 24 and at 36 hours.
The search for radioactivity-induced morbidity, involved patients' follow-up sessions and their results appear in Table 3 for the HT and in Table 4 for the DTC group. With them are also the corresponding R max values and the TRA during all past treatments for each patient. The patients in the HT group have been treated only once. So, the TRA in Table 3 is for a single treatment and it is the same as the RA in Table 1. In the DTC group, some of the patients have been treated more than once and consequently the TRA appearing in Table 4 is the sum of all activities administered to such patients during all their treatments.
TRA, total activity administered, MS, morbidity score.
In the HT group (Table 3), 4 out of 16 patients (25%) reported some symptoms of salivary glands' dysfunction and one of those persisted long enough to be considered chronic. In the DTC group (Table 4), 11 out of 19 patients (57.9%) reported symptoms and in 4 of them they could be considered chronic. The latter appeared more than 6 months after treatment or were there continuously up until the patient's follow-up dates.
The MS of the DTC patients was plotted against their respective R max in Figure 9. On that data, a linear function was fitted reasonably well (R 2 = 0.4) indicating that it could become the means for possible prediction of salivary gland dysfunction. By setting MS = 0 and solving the fitted equation appearing in Figure 9, the R max that did not correspond to any reported symptoms was calculated to be 221 kBq. According to the data collected and the method used, this could be considered to be a threshold for radioactivity-induced symptoms.
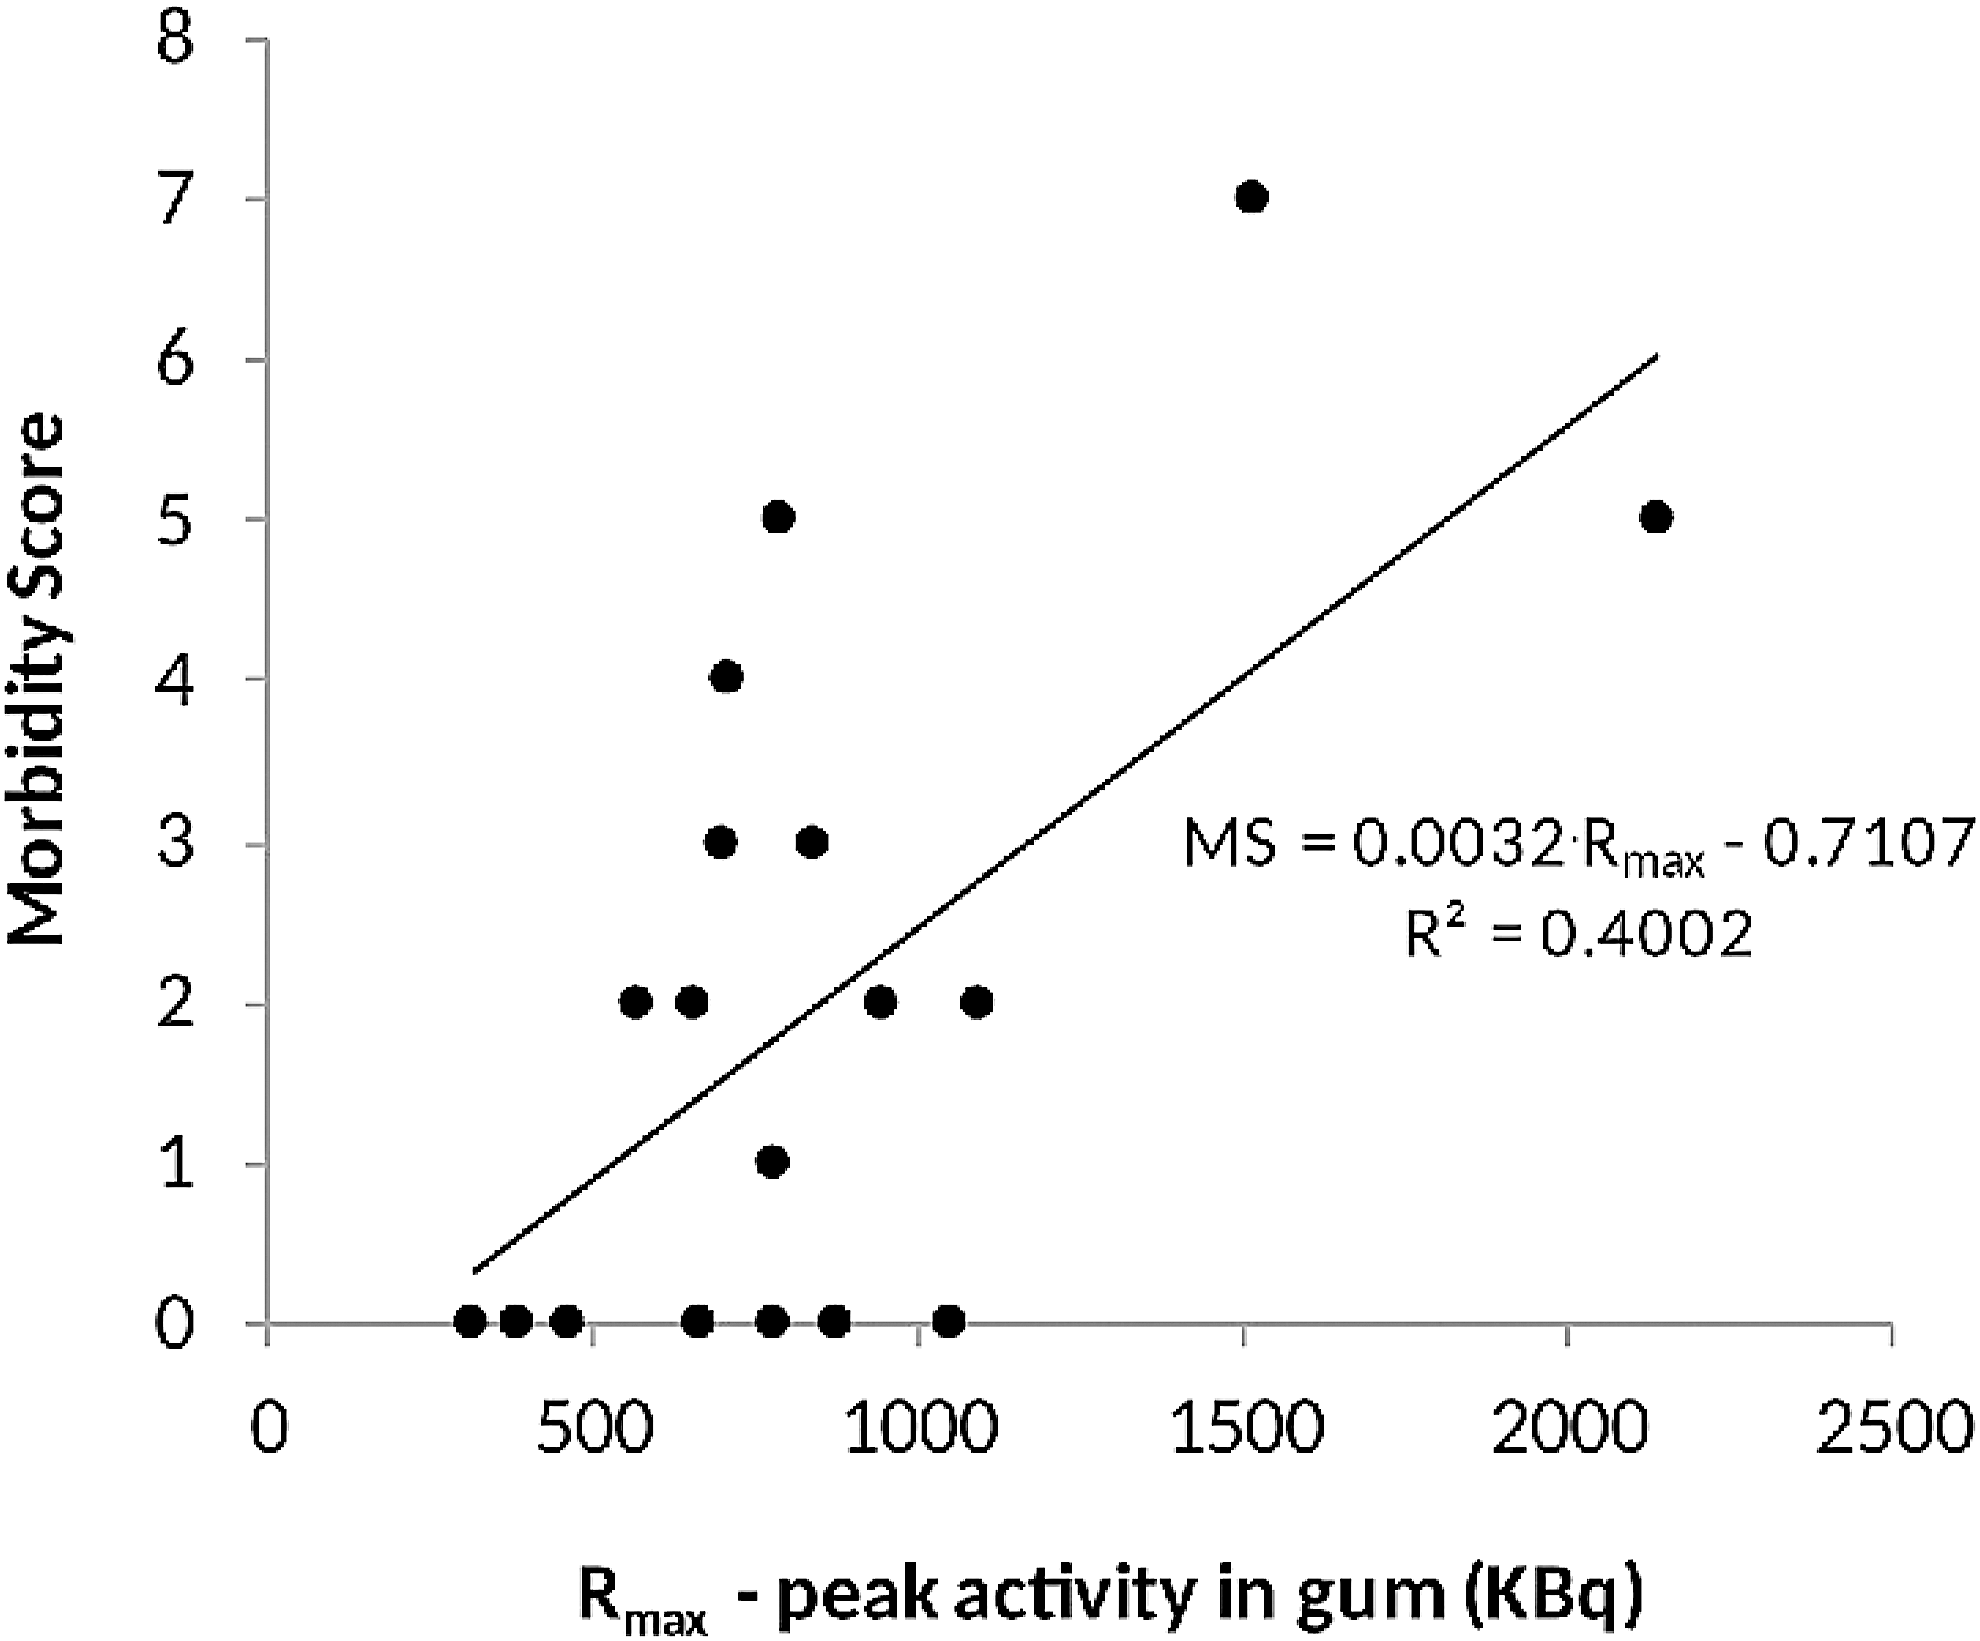
Symptoms of salivary gland dysfunction. Relation of the MS to the peak activity of I-131 measured in the chewing gums of DTC patients. MS, morbidity score.
Finally, to check for the expected increase in morbidity with previous treatments, the calculated MS values from Table 4 were plotted against the TRA obtained from the RIU database. As can be seen in Figure 10, there is a reasonably linear relationship between them indicating an intensification of salivary dysfunction symptoms with increasing I-131 administered activity. By solving this equation for TRA = 0, a nonzero MS is found: MS = 0.66.
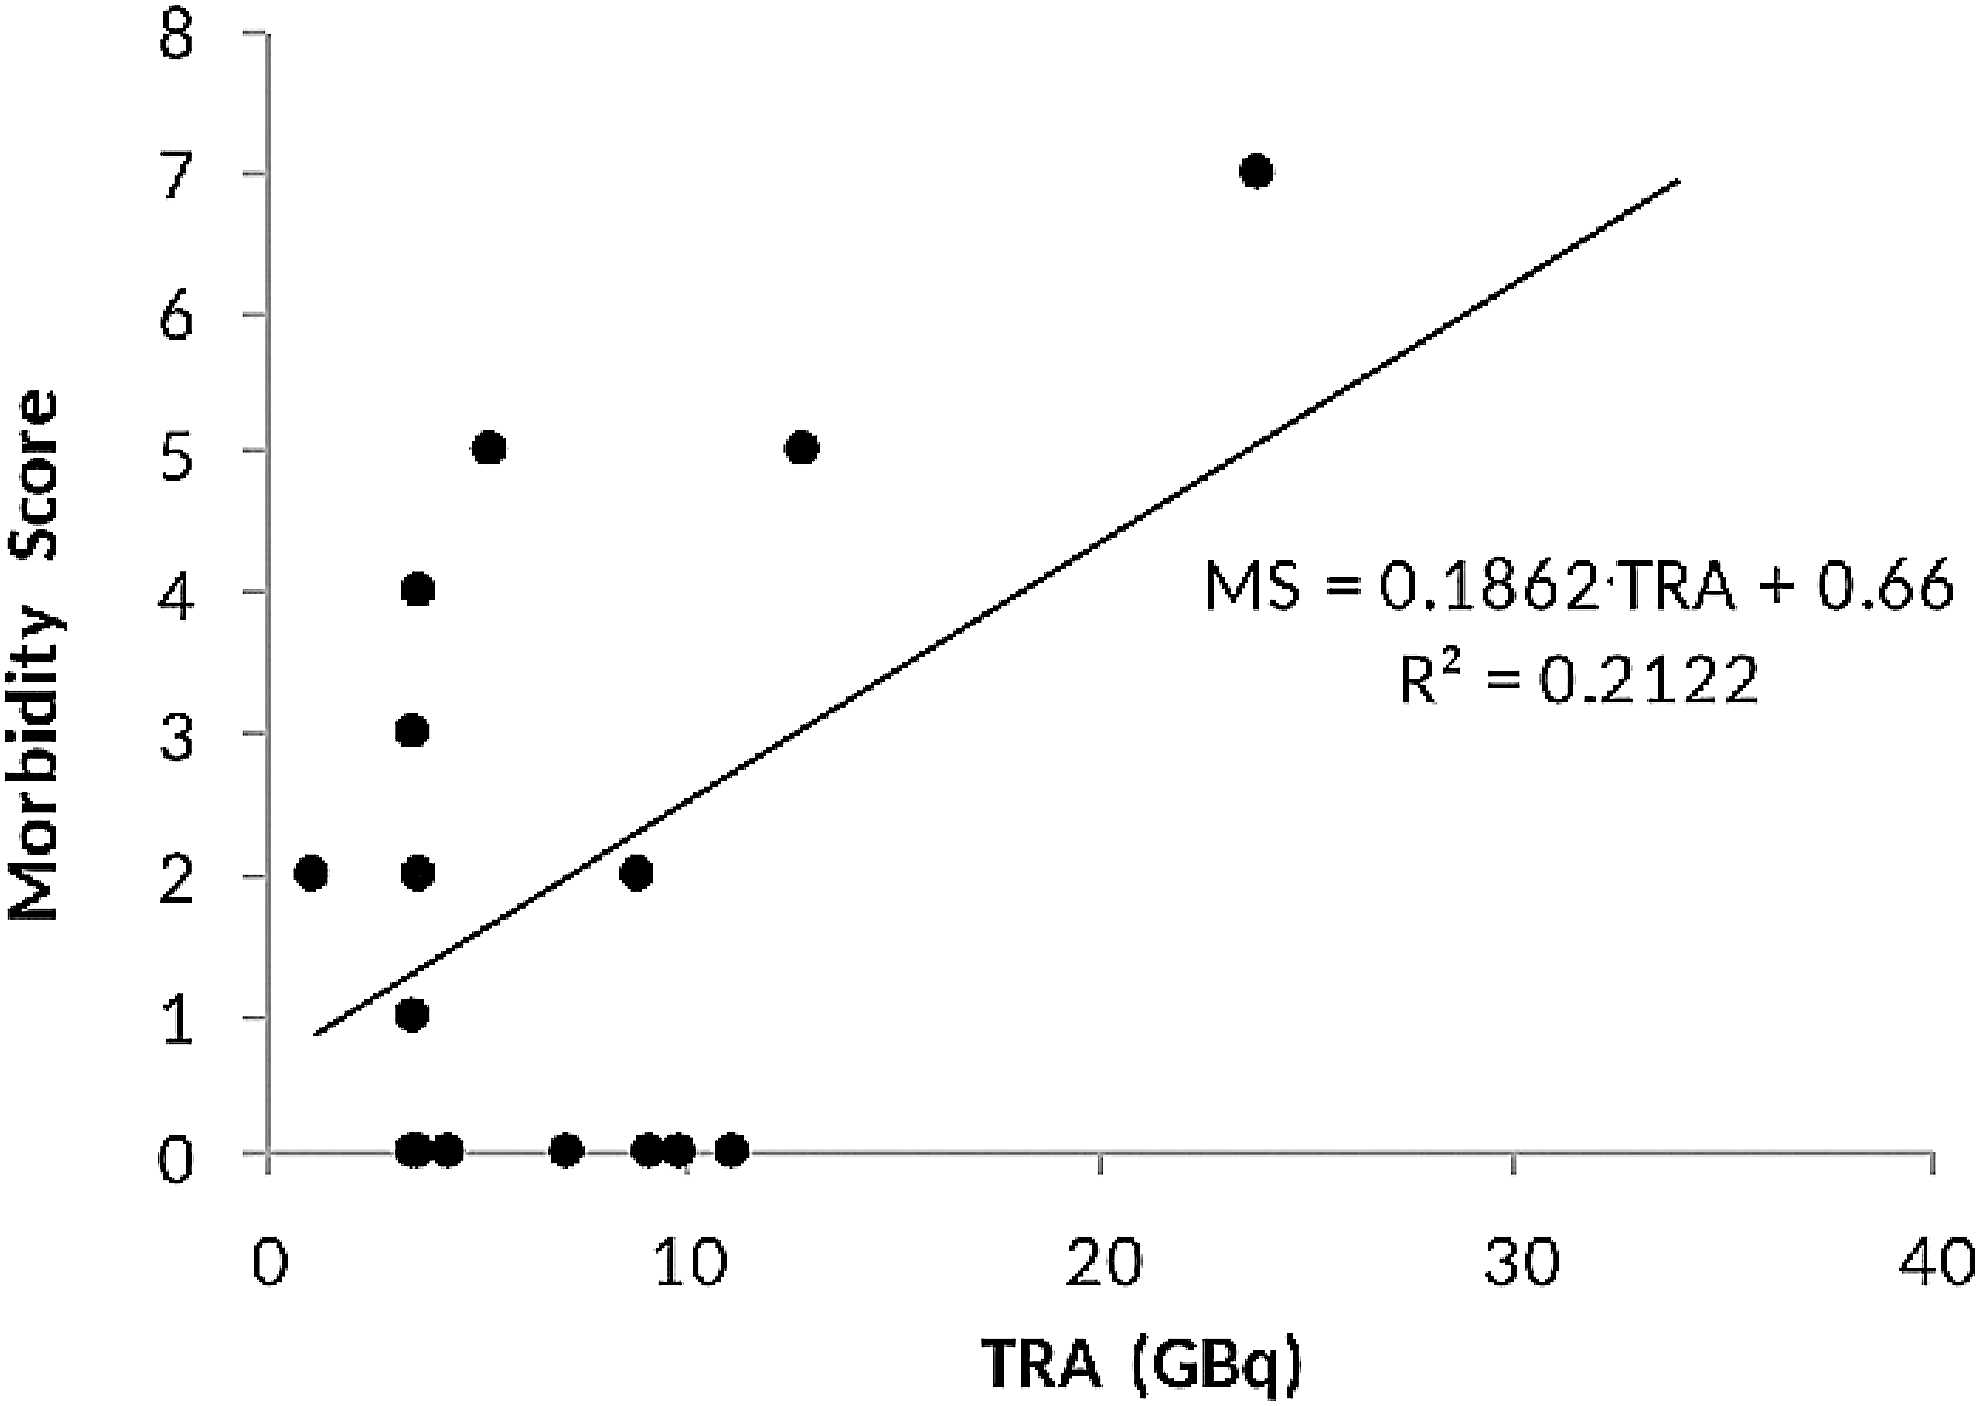
Symptoms of salivary gland dysfunction. Relation of the MS to the total radioactivity of I-131 that had been administered to DTC patients during all past treatments.
Discussion
The purpose of this work was to test the proposed sampling method and (i) to investigate the possible use of saliva I-131 flow parameters for the prediction of future radioactivity content and (ii) to correlate this content and the administered radioactivity to possible salivary gland dysfunction.
Sampling and individual R(t) curves
The method used here for saliva sampling proved to be easy and reliable as can be seen from the low variation of the residue's weight in both the dry run and in the samples of some actual patients. It allowed the measurement of saliva radioactivity safely at long and irregular intervals independently in the RIU, without the need for repeated imaging arrangements and patient discomfort. The detection of very low activity was possible since the sensitivity and the precision of the measuring equipment were of the order of 1 kBq. Even lower activity could be measured if required, using a scintillator well counter.
The shapes of the time–activity curves both for DTC (Figs. 1 and 2) and for HT patients (Figs. 3 and 4) were similar to those produced by scintigraphic techniques 17,25 –27 but extended over a much longer period. In the single case that repeat measurements had been obtained from the same DTC patient, both time–activity curves were remarkably similar after a 6-month interval (Fig. 5). This observation seems to disprove the suggestion that the iodine uptake of the salivary glands is diminishing during the courses of therapy. 25 It could also suggest that the shapes of such curves were characteristic for each individual patient's physiology or pathology. The similarity of the average %R max of both the HT and DTC groups, which was found to be at about 11% and 10%, respectively (Tables 1 and 2), could be considered to confirm this.
Radioactivity flow
The flow of radioactivity through the salivary glands assessed by the gamma function simulation was described by MTT, RAT, and t max. Both MTT and t max values were significantly higher in the DTC group (1.95 and 1.03 hours) than those in the HT group (1.29 and 0.85 hours), respectively (Tables 1 and 2), indicating that the radioactivity is flowing faster in the former. The difference may be explained by the much smaller thyroid mass in the DTC patients, which reduced the thyroid uptake, consequently leaving more radioactivity in the blood stream. This would cause faster excretion and seemed to be confirmed by the lower eEHL of those patients (Table 2). Since the I-131 in the blood stream of excised patients was washed out much faster than in the HT group, it would also reduce the activity remaining in the digestive track. This process would cause a delay in the recirculation, which would affect both MTT and t max. A possible confirmation of this idea might be the linear relationship observed between the DTC patients' eEHL and MTT (Fig. 7) showing a positive correlation between the salivary and thyroid gland's radioiodine rate of transit. No such correlation was seen in the HT group.
The DTC group's t max was in agreement to one article, 27 but other published values were considerably longer and ranged between 2 and 6 hours. 17,25,26 The reason for this is not clear but could be due to the 5-minute moderate stimulation caused by chewing, which was missing from the imaged patients in all published works. A sour gum has been known to facilitate the flow of saliva and hence shorten the radioiodine's transit time. 13,14 It must also be noted that the t max found for the transit of I-131 both here and in the literature is much longer than the published 0.25–0.3 hours measured scintigraphically with the use of Tc-99m. 28 Perhaps this difference should preclude the use of technetium for t max measurements.
In agreement with their respective t max values, the RAT of the HT patients was significantly longer than that in the DTC group at 13.2 and 8.9 minutes, respectively. In the HT group, RAT also seemed to increase slightly with the weight of the patient (Fig. 6) perhaps because of additional dilution caused by an increased body mass. No such dependence was found for the DTC group despite the similar weight of the patients in both groups as confirmed by a Student t-test. No explanation could be suggested for this.
Remaining radioactivity in saliva
The remaining radioactivity representing gums chewed after 24 hours (RA24) and after 36 hours (RA36) was interpolated from the patients' R(t) curves and was found to depend on the R max. Relatively good linear fits were obtained for both periods (Fig. 8). Using the data from the DTC group, in Table 2, the interpolated fractions for hypothetical samples 24 and 36 hours postadministration were calculated to be about 43.3% and 25% of the R max, respectively, which can be measured quickly by administering a few chewing gums to a new DTC patient at around 1 hour post-treatment. Interestingly, the average sEHL (16.3 hours), estimated here for the DTC group from the data in Figure 8, did not differ much from the eEHL (18.1 hours) calculated for the same group from dose rate data (Table 2). This indicated similar rates through both salivary glands and total body and thyroid. However, sEHL did differ considerably from one average value of 9.3 ± 3.5 hours found in the literature. 25
This similarity between sEHL and eEHL suggested that the eEHL calculated according to the routine RIU procedure 18 could be used as an estimate of the sEHL too without actually obtaining a complete R(t) curve. This would allow the quick estimation of the remaining I-131 fraction in saliva at 24 and 36 hours post-treatment and used to predict possible radiation protection issues and adjust the instructions given to the patient.
Regarding the HT group, the few data available (Table 1) indicated that the remaining radioactivity in saliva could be considered negligible.
In contrast to the current paradigm that requires strict rules to avoid contamination from saliva radioiodine, the results here for both DTC and HT patients suggest that after just a couple of days post-treatment, the salivary radioactivity is too low to constitute a credible risk.
Salivary radioactivity quantification
The functions RA24 = 0.4335 · R max and RA36 = 0.2557 · R max fitted in Figure 8 could be used to calculate the radioactivity expected to be found in hypothetical similar gum samples obtained at 24 and 36 hours post-treatment.
These constants could also be combined with the peak radioactivity fraction in the parotids and submandibular glands calculated to be 1.2% of the RA by Liu et al. 27 and which should be proportional to R max. Assuming that this fraction is similar for all DTC patients, then the radioactivity present in the salivary glands at 24 and at 36 hours post-treatment will be A 24 = (0.012) · (0.4335) · RA and A 36 = (0.012) · (0.2557) · RA, respectively. For example, for the usual capsule of RA = 3700 MBq, the value of A 36 will be about 11 MBq or just about 0.3% of the administered radioactivity. Although it did not seem necessary for the HT group, corresponding values could be extrapolated from the DTC results. In any case, the actual radioactivity content would be even lower because the flow of saliva would be lower in patients who were not chewing anything, as was the case for the routine RIU patients.
Salivary dysfunction
The procedure presented for the grading of symptoms with an MS was easy to use, with simple, clear-cut, “yes” or “no” questions that the patient could understand. No complicated severity scales were put to the patients for marking. The questions were answered over the telephone without any patient discomfort and each session was repeated later on to make sure that any reporting of symptoms was consistent. There is no doubt that better questionnaires could conceivably be constructed and more information extracted from the patients. However, it was decided that the current method was reliable and the simple responses and their scoring were adequate for the purpose of the present investigation. Any additional information would not have been worth the effort and the patients' discomfort, especially since the validity of other, more complex questionnaires had been challenged. 24
In the DTC group, 11 out of 19 patients (57.9%) claimed to have had both immediate and delayed symptoms of salivary gland dysfunction, a fraction that is near to published values of 54.5%, 7 46.3%, 9 76.8%, 29 and 41%. 28 The DTC patients' MSs (Table 4) seemed to increase linearly with R max and, as expected, 30 with each patient's TRA (Figs. 9 and 10, respectively). From the former, a chewing gum threshold activity of 221 kBq was calculated, which corresponded to no morbidity (i.e., for MS = 0). However, the opposite appeared in Figure 10 about the DTC group: from the fitted line there, an MS = 0.66 was extrapolated for TRA = 0, indicating a salivary dysfunction of supposedly untreated DTC patients.
Regarding the HT patients, despite ingesting very low radioactivity, about 0.41 GBq on the average, which corresponded to an Rmax < 100 kBq for each of them, (i.e., less than half of the calculated threshold), there were still 4 patients out of 16 (25%) who complained about dysfunction symptoms. One of them even claimed that they persisted for more than 6 months post-treatment. The HT group results seemed to contradict the current paradigm according to which such problems are rare even in patients treated with 1.1 GBq of I-131. 9 So, it may be that at least some of the reported symptoms of some patients were unrelated to the treatments, greatly overestimated, or even nonexistent and caused by negative patient psychology.
Conclusions
Sampling of saliva by chewing gums was easy and permitted the assessment of radioactivity flow through the salivary glands for much longer periods than those achieved by imaging methods. R max turned out to be a useful indicator for the prediction of both the late radioactivity content of saliva and the DTC patients' expected morbidity, which is caused by individual treatments. Even though the technique was not very accurate, R max allowed some personalization of the radiation protection instructions to a discharged patient. This procedure will be included in the RIU routine.
Finally, the relationship presented in Figure 10 demonstrated the increase of salivary dysfunction with the radioactivity accumulated through repeated treatments of DTC patients and could be used to predict MS values, and hence, the possible severity of adverse effects. This assessment should become an important parameter to be taken into account when additional treatments are considered.
Footnotes
Acknowledgments
The author thanks Mr. Vincent Spagnol and Mr. Mark Mifsud for their help during the compilation of the data presented in this article.
Disclosure Statement
No competing financial interests exist.