




Abstract
Abnormal autophagy regulation affects the chemoresistance of ovarian cancer, during which the circadian gene clock may play a major role. In this study, RNA interference plasmid pSUPER-Clock and overexpression plasmid pcDNA3.1-Clock of CLOCK were used to stably transfect the SKOV3/DDP cells by lipofection. Upon screening, the in vitro transfected cell lines with pSUPER-Clock, the autophagy level, and G0/G1 phase cells were significantly reduced, and the expression levels of Clock, LC3, P-gp, and MRP2 were inhibited. In contrast, the autophagy level and G0/G1 phase cells in cell lines transfected with pcDNA3.1-Clock were significantly increased, and the expressions of Clock, LC3, P-gp, and MRP2 were enhanced. In comparison with the untransfected control group showed the percentage of apoptotic cells in SKOV3/DDP cell lines of Clock interfering expression group after cisplatin treatment was significantly increased while the survival was substantially reduced. These results indicated that inhibiting the circadian gene Clock expression can reverse the cisplatin resistance of ovarian cancer SKOV3/DDP cell lines by affecting the protein expression of drug resistance genes during which autophagy plays an important role. The CLOCK gene may be designated as a novel candidate for targeted gene therapy in drug-resistant ovarian cancer.
Introduction
Ovarian cancer is one of the most common gynecological malignant tumors and is the leading cause of mortality from malignant tumors in the female reproductive system. In recent years, several patients have achieved complete remission after receiving active cytoreductive surgery combined with postoperative platinum-based adjuvant chemotherapy. However, 50%–70% of these patients still exhibit recurrence, of which resistance to chemotherapy drugs is a major factor affecting prognosis. Autophagy is a common conservation mechanism highly conserved across evolution among eukaryotes, including humans. It encompasses physiological alterations in cells under metabolic stresses such as starvation, energy deficiency, and stress. Since all these processes occur within the same cell, it is called autophagy. 1 Studies have suggested that the effect of autophagy on tumor proliferation is dependent on the cell type and stimulation, exhibiting different roles under various conditions. 2 Clock is a principal regulator of inherent circadian rhythm in mammals. 3,4 Clock can form a heterodimer transcription complex with another protein Bmal1, which binds to the E-Box element on DNA and stimulates the expression of many genes regulating metabolism. Recent studies 5,6 have proposed that Clock is not only associated with autophagy but also affects the proliferation of drug-resistant cell lines in tumors. Clock is overexpressed in cisplatin-resistant cells and it might play an important role in multidrug resistance through the glutathione-dependent redox system. Theoretically the cell cycle and malignant disease may be targeted vicariously by selective alteration of the cellular molecular clock. In this study, it was attempted to observe the effects of autophagy on human ovarian cancer cisplatin-resistant cell line SKOV3/DDP through the regulation of the expression of rhythmic regulator Clock, thereby aiming to provide a putative target for biotherapy for refractory ovarian cancer.
Materials and Methods
Materials and reagents
Human ovarian cancer cisplatin-resistant cell line SKOV3/DDP was obtained from Beijing Cancer Hospital, which was established by repeated intermittent administration of cisplatin (DDP) to SKOV3 cells of papillary serous cystadenocarcinoma of the ovary. RPMI-1640 medium (Gibco), G418 and lipofectamine2000 (Invivogen), rabbit antihuman Clock, LC3, P-gp, and MRP2 polyclonal antibodies (Cell Signaling Technology), biotinylated secondary antibody (Santa Cruz), BCA protein assay kit (Pierce), blue tetrazolium (MTT), autophagy fluorescent dye monodansylcadaverin (MDC) and dimethyl sulfoxide (DMSO) (Sigma), and cisplatin (Qilu Pharmaceutical Co. Ltd., China) were purchased. A reverse transcription kit and SYBR Green real-time polymerase chain reaction (PCR) Master Mix were obtained from Toyobo Company (Japan). Annexin V/propidium iodide (PI) apoptosis and cell cycle kits were purchased from Kaiji Biotechnology Co. Ltd. (China). PCR primers were synthesized by Yingjun Biotechnology Co. Ltd. (China).
Cell culture and plasmid transfection
Human ovarian cancer cisplatin-resistant cell line SKOV3/DDP was cultured in RPMI-1640 medium containing 10% fetal bovine serum at 37°C, 5% CO2 incubator until the exponential growth phase. At 24 hours before transfection, the cells were digested with pancreatin and inoculated into a 6-well plate at a density of 5 × 10⁵ cells/well. Then, SKOV3/DDP cells were transfected independently with pcDNA3.1-Clock (Clock gene overexpressed) and pSUPER-Clock (Clock gene partially silenced) using lipofectamine2000. Twenty-four hours post-transfection, 500 μg/mL G418 was added to the medium for resistance screening. Since both pcDNA3.1-Clock and pSUPER-Clock vectors contain green fluorescence reporter genes, successfully transfected cells will emit green fluorescence, indicating exogenous gene expression in the cells. One week later, fluorescence microscopy revealed the emitting fluorescence cell clones, which were diluted, followed by amplification in culture to obtain stably expressed cell lines. Clones were isolated and Clock expression was confirmed by Western blot analysis. The overexpression and interference negative plasmid control cell lines (respectively, pcDNA3.1 group and pSUPER group) were obtained similarly, and SKOV3/DDP cells without the transfections were considered a black control group. The eukaryotic expression vector pcDNA3.1-Clock plasmid and RNA interference expression vector pSUPER-Clock plasmid were established by Ruibo Biotechnology Co. Ltd. (China). pcDNA3.1 and pSUPER were also obtained from Ruibo Biotechnology Co. Ltd. (China). The recombinant vectors were confirmed by digestion analysis of restriction endonuclease, and all the constructed plasmids were confirmed by DNA sequencing.
CLOCK mRNA changes detected using real-time PCR
Total RNA from each group was extracted using Trizol, from which 2 μg was reverse transcribed using a first-strand cDNA synthesis kit (Roche, Basel, Switzerland). The IQTM SYBR Green Supermix (Bio-Rad Laboratories, Hercules, CA) was used for quantitative real-time PCR (qRT-PCR) analysis. Glyceraldehyde phosphate dehydrogenase (GAPDH) was used as an internal control for reverse transcription quantitative real-time PCR (RT-qPCR) reaction in FTC2000 real-time PCR instrument. Every reaction was performed in triplicate. The upstream and downstream primer sequences for Clock were 5′-GGCAGAGAAAATGCTGCCTAGTGCT-3′ and 5′-TGTGCCCCTATGATGATCACCTCCTGC-3′, respectively, and the product length was 74 bp. Those for GAPDH were, respectively, 5′-TGGGGAAGGTGAAGGTCGGAGT-3′ and 5′-TGAAGGGGTCATTGATGGCAACA-3′, whereas the product length was 111 bp. The PCR conditions were 94°C denaturation for 2 minutes, 94°C for 20 seconds, 55°C for 30 seconds, 60°C for 40 seconds, 72°C for 5 minutes, for 45 cycles. After the amplification reaction, fluorescence intensity growth index (DRn) of each reaction at each cycle was analyzed, and the amplification kinetics curve was plotted. Subsequently, the Ct value (fluorescence signal intensity of the response system detected using a thermal cycler) and ▵Ct value (Ct of the sample gene subtracted by the Ct of the corresponding reference gene) of each sample tube were determined according to the kinetics curves. Concurrently, 2−▵▵Ct was estimated to express the correlation of each transfected group with respect to the SKOV3/DDP blank control group, that is, relative quantification of each tested gene expression.
Protein expression using Western blot
Cells were washed twice with precooled phosphate-buffered saline (PBS). The cells were collected in 100 μL RIPA and 1 μL phenylmethanesulfonyl fluoride (PMSF) from each well in the 6-well plate and placed on ice for 30 minutes, followed by centrifugation at 4°C and 14,000 rpm for 30 minutes; the supernatant was the total protein extract. Subsequently, the concentration was determined using the BCA method. Fifty microgram total protein was resolved on the sodium dodecyl sulfate polyacrylamide gel electrophoresis and transferred onto polyvinylidene fluoride (PVDF) membrane using the semidry electrotransfer method. The PVDF membrane was blocked with 5% nonfat milk for 1 hour, followed by probing with rabbit antihuman Clock antibody (1:750), LC3 antibody (1:500), P-gp antibody (1:500), or MRP2 antibody (1:750), respectively, at 4°C overnight. Subsequently, the membrane was washed three times with TBS + Tween (TBST) containing 0.1%Tween20 and incubated with horseradish peroxidase-labeled goat antirabbit IgG secondary antibody (1:3000) at room temperature for 1 hour. Consequent to the final TBST and thermomorphic biphasic amine solvent (TBS) washes, the membrane was developed with the chemiluminescent substrate on an X-ray film and imaged on a gel imaging analysis system to measure the intensity of specific bands. The experiment was repeated three times.
Autophagy detected using MDC fluorescent staining
Cells grown in the 6-well plate were incubated with 0.05 mmol/L MDC at 37°C for 60 minutes, fixed with 4% paraformaldehyde for 15 minutes, and rinsed twice with PBS. They were then observed and photographed under a fluorescence microscope equipped with a 340 to 390-nm band-pass ultraviolet excitation filter, a 410-nm dichroic mirror, and a 420-nm long pass barrier filter. Fluorescence intensity was determined by FACScan™ flow cytometry system (Becton Dickinson, San Jose, CA).
Cell cycle analysis
Nontransfected and transfected cells in the logarithmic phase were collected, washed twice with cold PBS, centrifuged at 1000 rpm for 5 minutes, and fixed with 70% cold ethanol at 4°C for more than 30 minutes. Subsequently, the cells were centrifuged at 1000 rpm for 5 minutes to eliminate ethanol and stained with 10 μg/L PI (containing 20 μg/ml RNase enzyme) for more than 30 minutes, followed by cell cycle distribution analysis using the FACScan flow cytometry system.
Apoptosis determined using Annexin V/PI staining
SKOV3/DDP cells with pcDNA3.1-Clock, pcDNA3.1, pSUPER-Clock, pSUPER, and nontransfected control groups were seeded in a 96-well plate (l × 105 cells/well) and incubated at 37°C for 24 hours. The cells were treated with 25.53 μmol/L cisplatin (IC50 value was predetermined from the cells treated with cisplatin for 48 hours) for 48 hours and washed twice with precooled PBS. The cells were then stained in the dark at room temperature for 2 hours according to the annexin V/PI kit's instructions. Cells positive for annexin V were analyzed using the FACScan flow cytometry system, and the apoptosis rate was calculated using WinMDI2.8 software. Experiments were repeated three times in each group.
Determination of cell growth curve
SKOV3/DDP cells of the pcDNA3.1-Clock, pcDNA3.1, pSUPER-Clock, pSUPER, and nontransfection control groups were seeded in a 96-well plate (l × 105 cells/well) and incubated at 37°C for 24 hours, processed with 25.53 μmol/L cisplatin. Subsequently at 12, 24, 36, and 48 hours after administration, 20 μL MTT (5 mg/mL) was added to each well, reacted for 4 hours, stopped with 100 μL DMSO, oscillated for 15 minutes, and mounted on the ELISA reader to determine the absorbance at 492 nm. An average of five wells for each group were calculated. The experiment was repeated three times.
Statistical analysis
All statistical analyses were performed using SPSS13.0 software. Studies were performed in triplicate with the results expressed as the mean ± standard deviation as appropriate. Multiple group comparisons were analyzed with one-way analysis of variance, and Tukey test was used to compare the two groups. p < 0.05 was considered statistically significant.
Results
Fluorescence microscopy of transfected cells
Since pcDNA3.1-Clock and pSUPER-Clock vectors contain the green fluorescence protein (GFP) reporter, successfully transfected cells will emit green fluorescence, indicating the expression of exogenously transfected genes in the cells. Cell transfection efficiency under fluorescence microscopy was referred to the percentage of fluorescent cells within 10 × 200 fields. The SKOV3/DDP cells transfected with the recombinant plasmid were counted under the fluorescence microscope, and a cell transfection efficiency of 80% was achieved (Fig. 1).
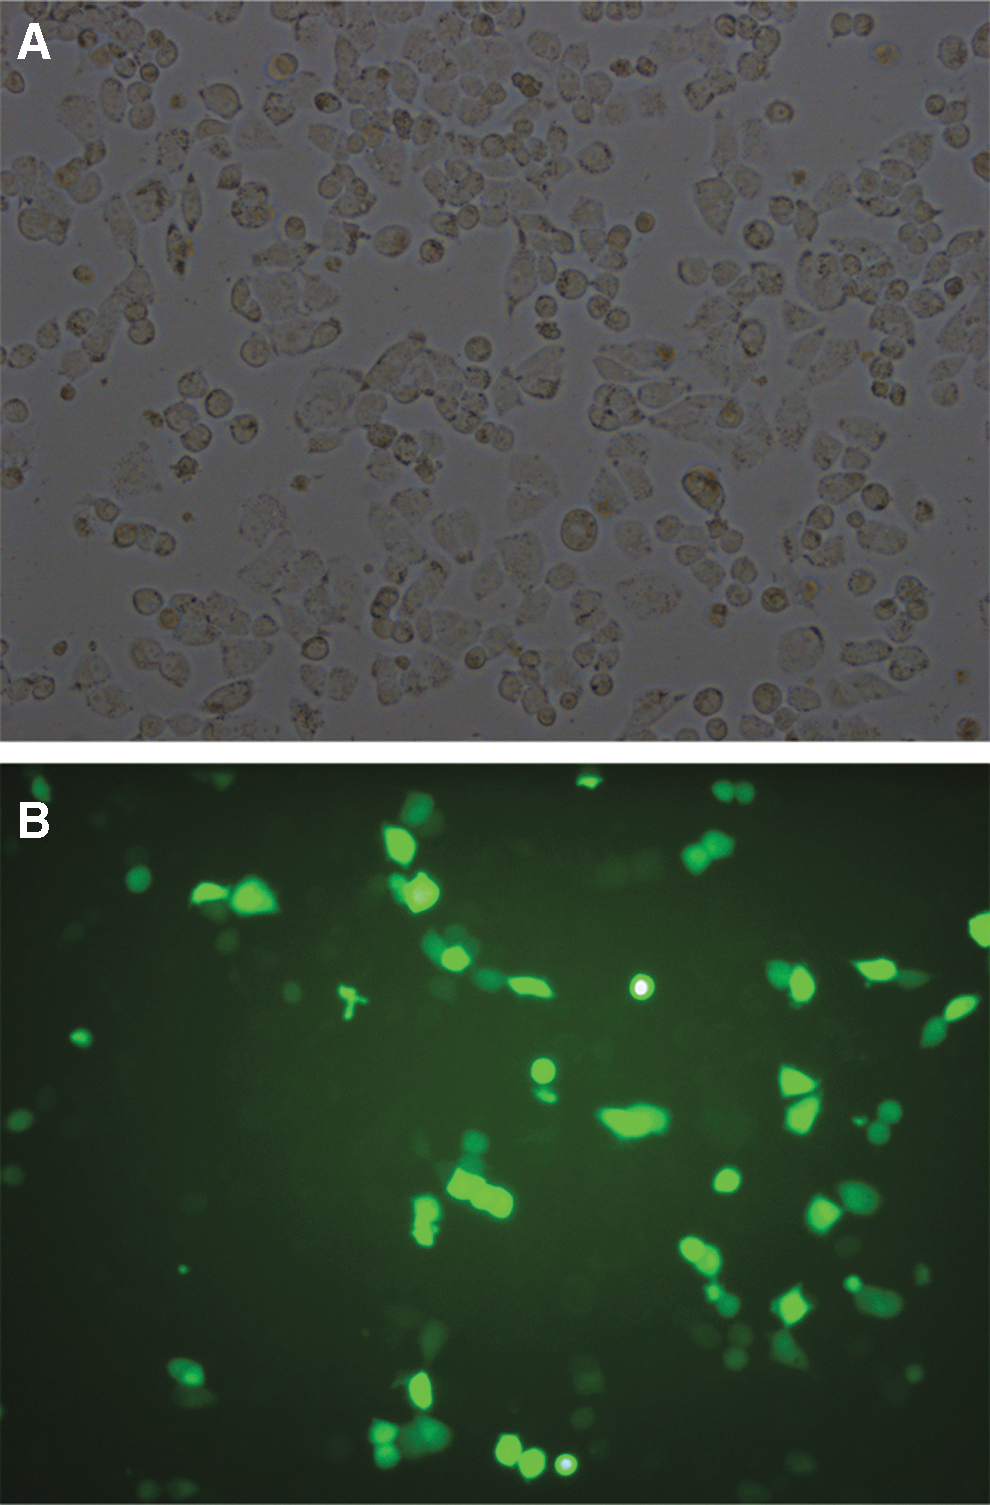
Expression of GFP on ovarian cancer SKOV3/DDP cells under a fluorescent microscope after transfection with pSUPER-Clock ( × 200).
Clock expression in transfected cells
The Clock mRNA expression from each group was calculated using the relative quantitative method based on the Ct value obtained in RT-qPCR. As can be seen from Figure 2, Clock mRNA expression of the pcDNA3.1-Clock group was significantly higher than that of the nontransfected SKOV3/DDP cell control group, whereas the Clock mRNA expression of the pSUPER-Clock was significantly decreased as compared with the nontransfected control group (p = 0.002). Western blot assay also revealed that the SKOV3/DDP cells could substantially increase the Clock protein expression in the pcDNA3.1-Clock group, whereas it was significantly inhibited in the pSUPER-Clock group (Fig. 3).
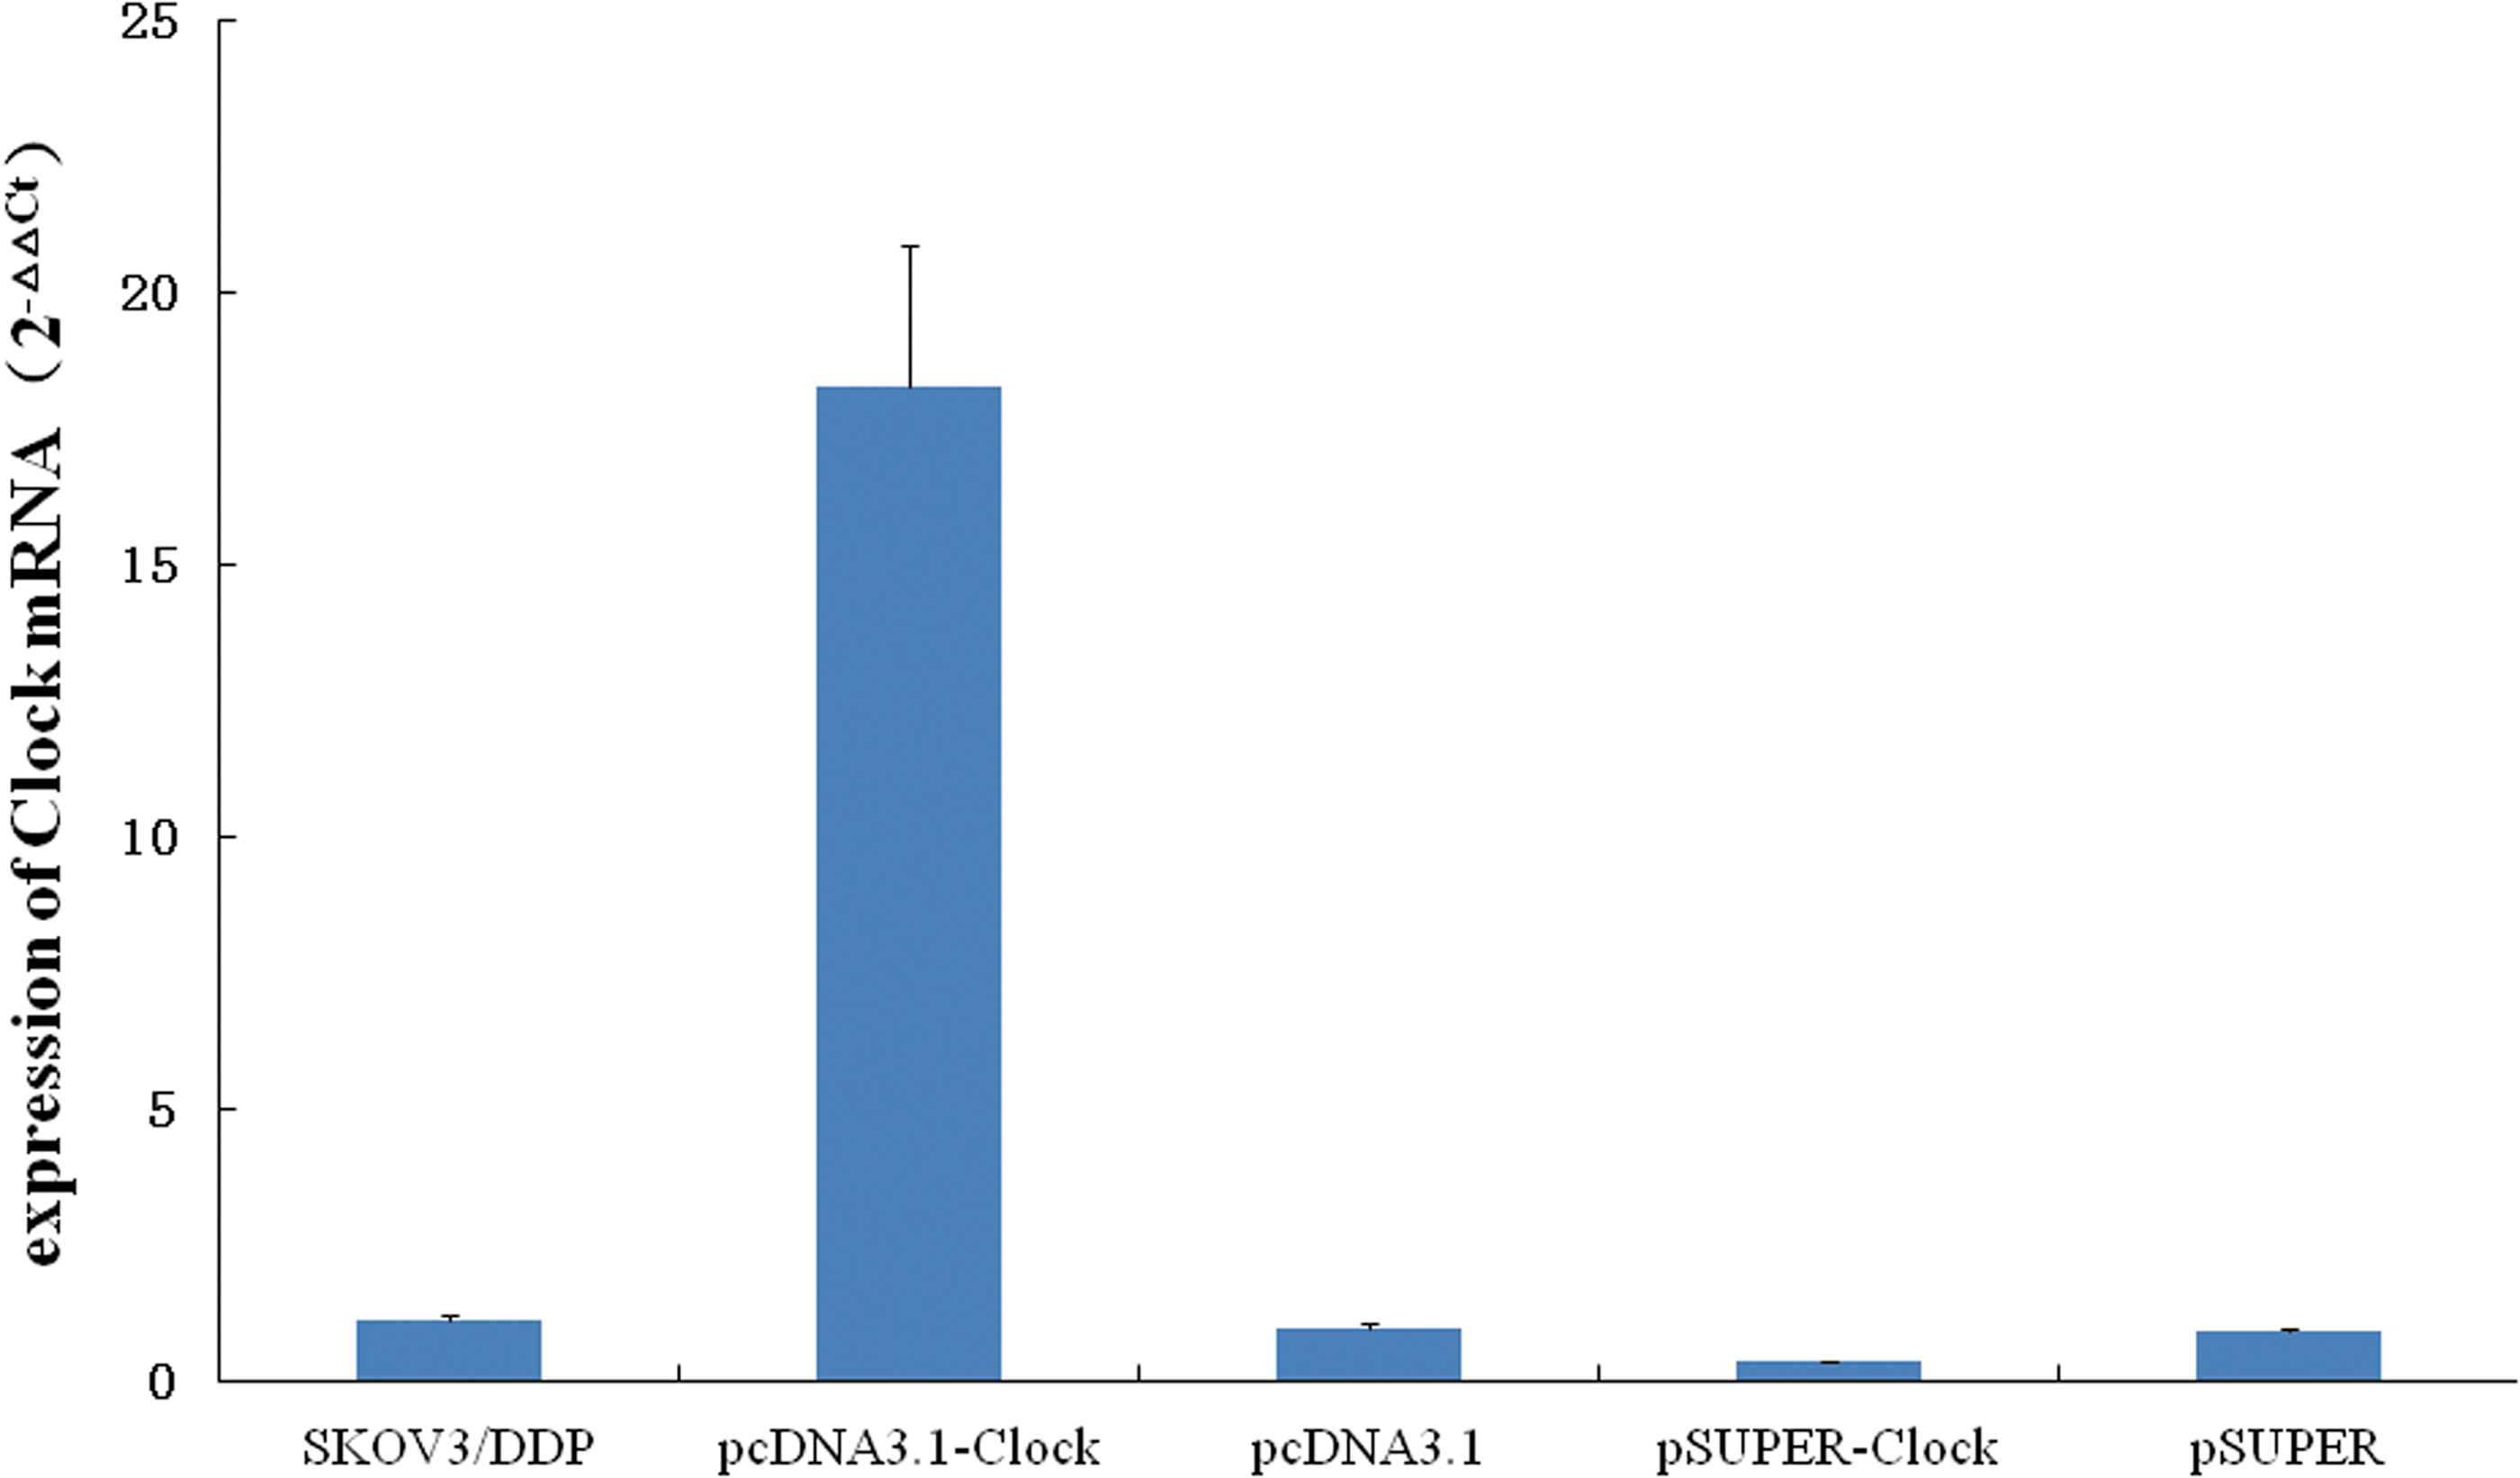
Real-time flourescent quantitative reverse transcription-PCR (RT-PCR) for detecting the expression of Clock mRNA. Color images available online at
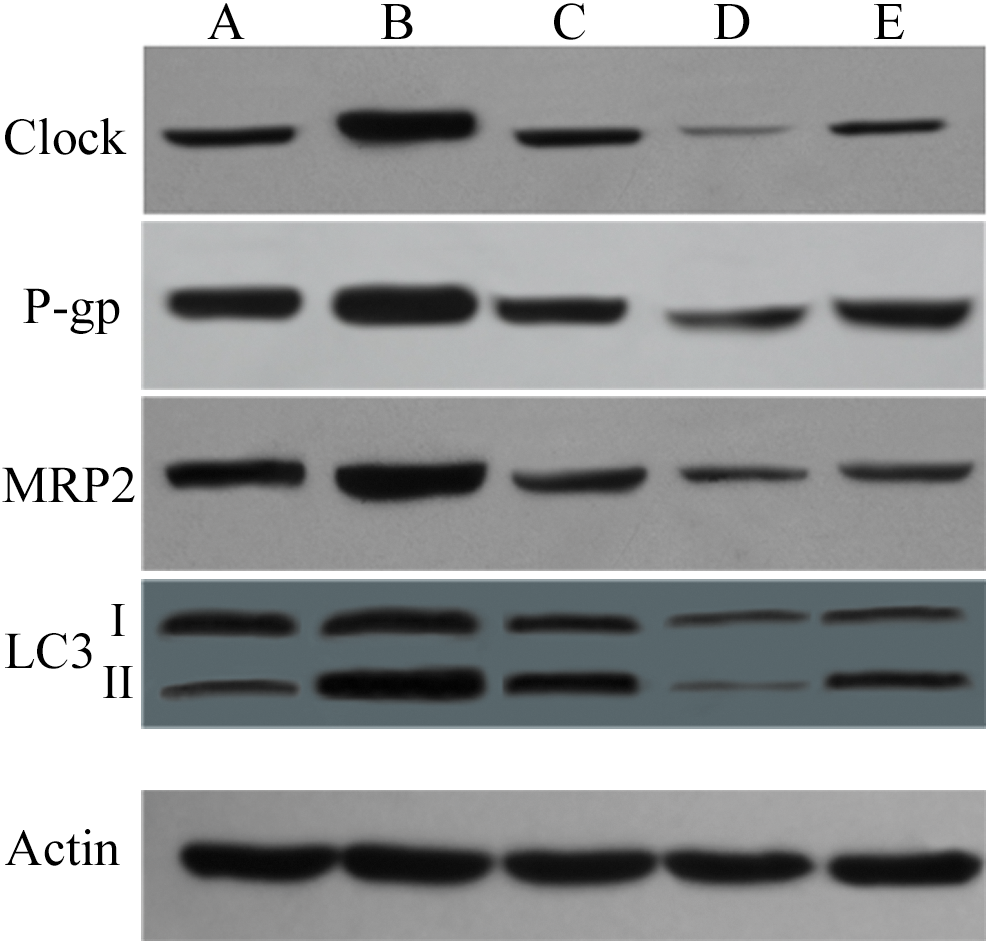
Clock, P-gp, MRP2, and LC3 protein expression were analyzed using Western blotting. A: SKOV3/DDP; B: pcDNA3.1-Clock; C: p cDNA3.1; D: pSUPER-Clock; E: pSUPER. Color images available online at
Effects of recombinant plasmid on P-gp and MRP2 protein expressions
Western blot assay showed that compared with the SKOV3/DDP cells of the nontransfected control group, expressions of P-gp and MRP2 proteins of the pSUPER-Clock group were significantly inhibited (p = 0.016), whereas those of the pcDNA3.1-Clock group were remarkably enhanced (p = 0.028).
Effects of CLOCK expression change on SKOV3/DDP autophagy
LC3 is located in front and on the autophagy vacuole membrane surface and is a universal marker of the cell autophagy vacuole membrane. Newly synthesized LC3 in cells can be processed into LC3-I, which, through ubiquitin-like modification, can combine with phosphatidylethanolamine on the autophagy vacuole membrane surface to produce LC3-II. LC3-II content is proportional to the number of autophagy vacuoles. Western blot analysis showed that compared with the nontransfected control group, LC3-II/LC3-I protein expression of the pcDNA3.1-Clock group was significantly increased (p = 0.015, Fig. 3), which proved that the Clock overexpression can lead to substantial cell autophagy in SKOV3/DDP cell lines. MDC is a fluorescent dye, which can selectively aggregate in the autophagy cyst after it is untaken by the cells. The fluorescence intensity measured by flow cytometry can be used to estimate the degree of autophagy. Compared with that of SKOV3/DDP cells of the nontransfected control group, the fluorescence intensity of MDC-positive cells of the pSUPER-Clock group was significantly decreased (p = 0.021). Flow cytometry results indicated that the percentage of autophagy cells in the nontransfected control, Clock overexpression, and RNAi expression groups was 6.8%, 11.7%, and 2.6%, respectively, which confirmed that inhibiting the Clock expression can significantly decrease cell autophagy in SKOV3/DDP cell lines (Fig. 4).

Effects of altered Clock expression on SKOV3/DDP cell cycle
SKOV3/DDP cell cycle was determined using flow cytometry, and the results are given in Table 1. G0/G1 phase cells accounted for 42.1% of the cells in the pSUPER-Clock group, which was significantly decreased (p = 0.041) compared with the SKOV3/DDP cells of the nontransfected control group (G0/G1 phase cells accounted for 49.1%). Concurrently, the 26.2% cells were estimated in the S phase of the pcDNA3.1-Clock group, which was significantly lower than 38.5% in the nontransfected control group (p = 0.036).
p < 0.01 versus SKOV3/DDP.
Alterations in apoptosis
Annexin V/PI staining was performed on each group, and the apoptotic rate was assessed using flow cytometry. After being treated with 25.53 μmol/L cisplatin for 12, 24, 36, and 48 hours, respectively, apoptotic rate of the pSUPER-Clock group was significantly increased compared with that of the nontransfected control group, and the differences were statistically significant (p = 0.028). Of these, the apoptosis rate of the cells after treatment for 48 hours was increased to 65.6%, whereas that of the control group was only 43.5%. In contrast, when the Clock expression was enhanced, the apoptosis of cells in the cisplatin-induced pcDNA3.1-Clock group was weakened during the four periods, and was lower than that of the control group in the corresponding period. Apoptosis rate of SKOV3/DDP cells in the pcDNA3.1-Clock group after treatment with cisplatin for 48 hours was only 37.3% (Fig. 5). These results suggested that inhibiting the Clock gene expression can enhance the cisplatin-induced SKOV3/DDP cell apoptosis.
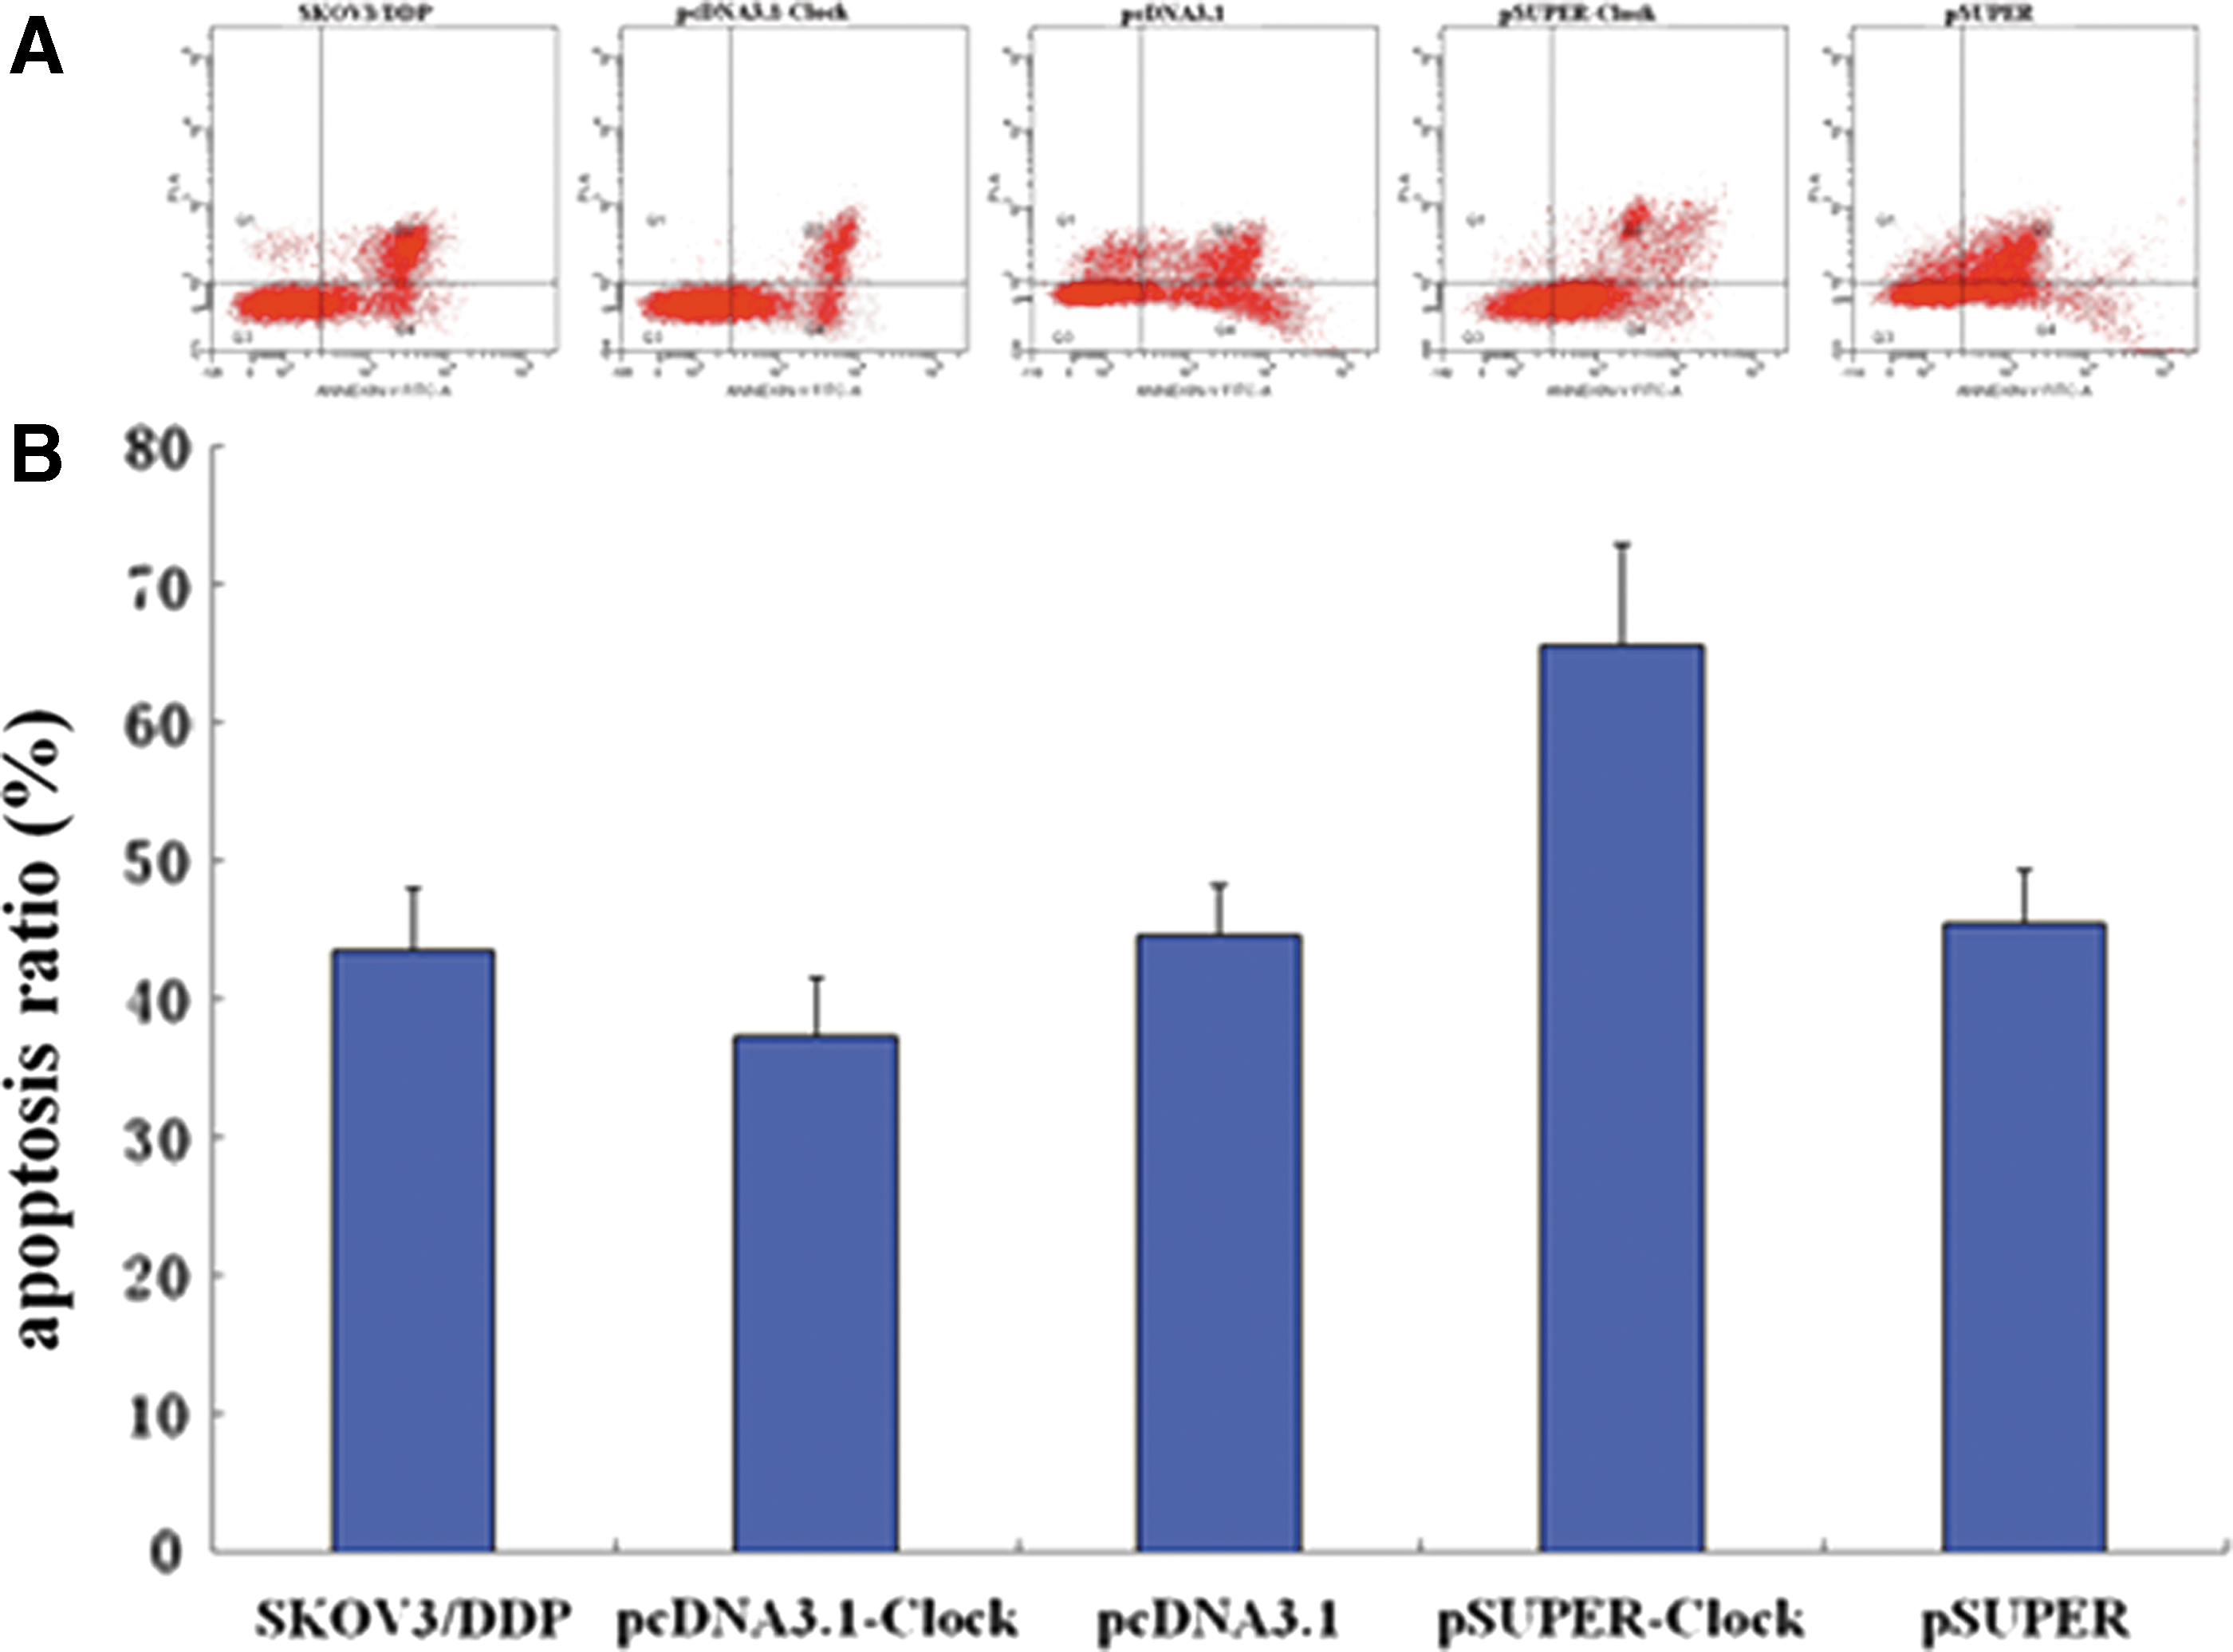
Apoptosis was determined by flow cytometry for Annexin V-FITC and propidium iodide (PI) dual labeling. Cytograms of annexin-V-FITC binding (abscissa) versus PI uptake (ordinate) show three distinct populations: (i) viable cells in gate Q3; (ii) early apoptotic cells in gate Q4; and (iii) cells that have lost membrane integrity as a result of very late apoptosis in gate Q2. Percentage of apoptotic cells is gate Q4 plus gate Q2. Data (percentage of the total population) are from at least three replicate experiments. The figure shows data only for 48 hours time point after cisplatin treatment. Color images available online at
Cell growth and proliferation
The variations in the growth of SKOV3/DDP cells in the pcDNA3.1-Clock, pcDNA3.1, pSUPER-Clock, pSUPER, and nontransfected control groups were determined using the MTT method. Percentages of survival cells in the mentioned groups were detected after they were treated with 25.53 μmol/L cisplatin for 12, 24, 36, and 48 hours. The growth curve was plotted with cisplatin activity on the horizontal axis and the percentage of survival cells on the vertical axis (Fig. 6). In the four time periods, the proliferation of SKOV3/DDP cells in the pSUPER-Clock group was significantly slowed as compared with that in the nontransfected control and pcDNA3.1-Clock groups (p < 0.031). In addition, the cell proliferation of the pSUPER and pcDNA3.1 groups did not show any significant change compared with that of the nontransfected control group. Of these, after being treated with cisplatin for 24 hours, the survival percentages in the pSUPER-Clock, pcDNA3.1-Clock, and nontransfected control groups were 53.6%, 69.3%, and 63.7%, respectively, whereas those were decreased to 32.9%, 53.1%, and 50.5%, respectively, after being treated with cisplatin for 48 hours.
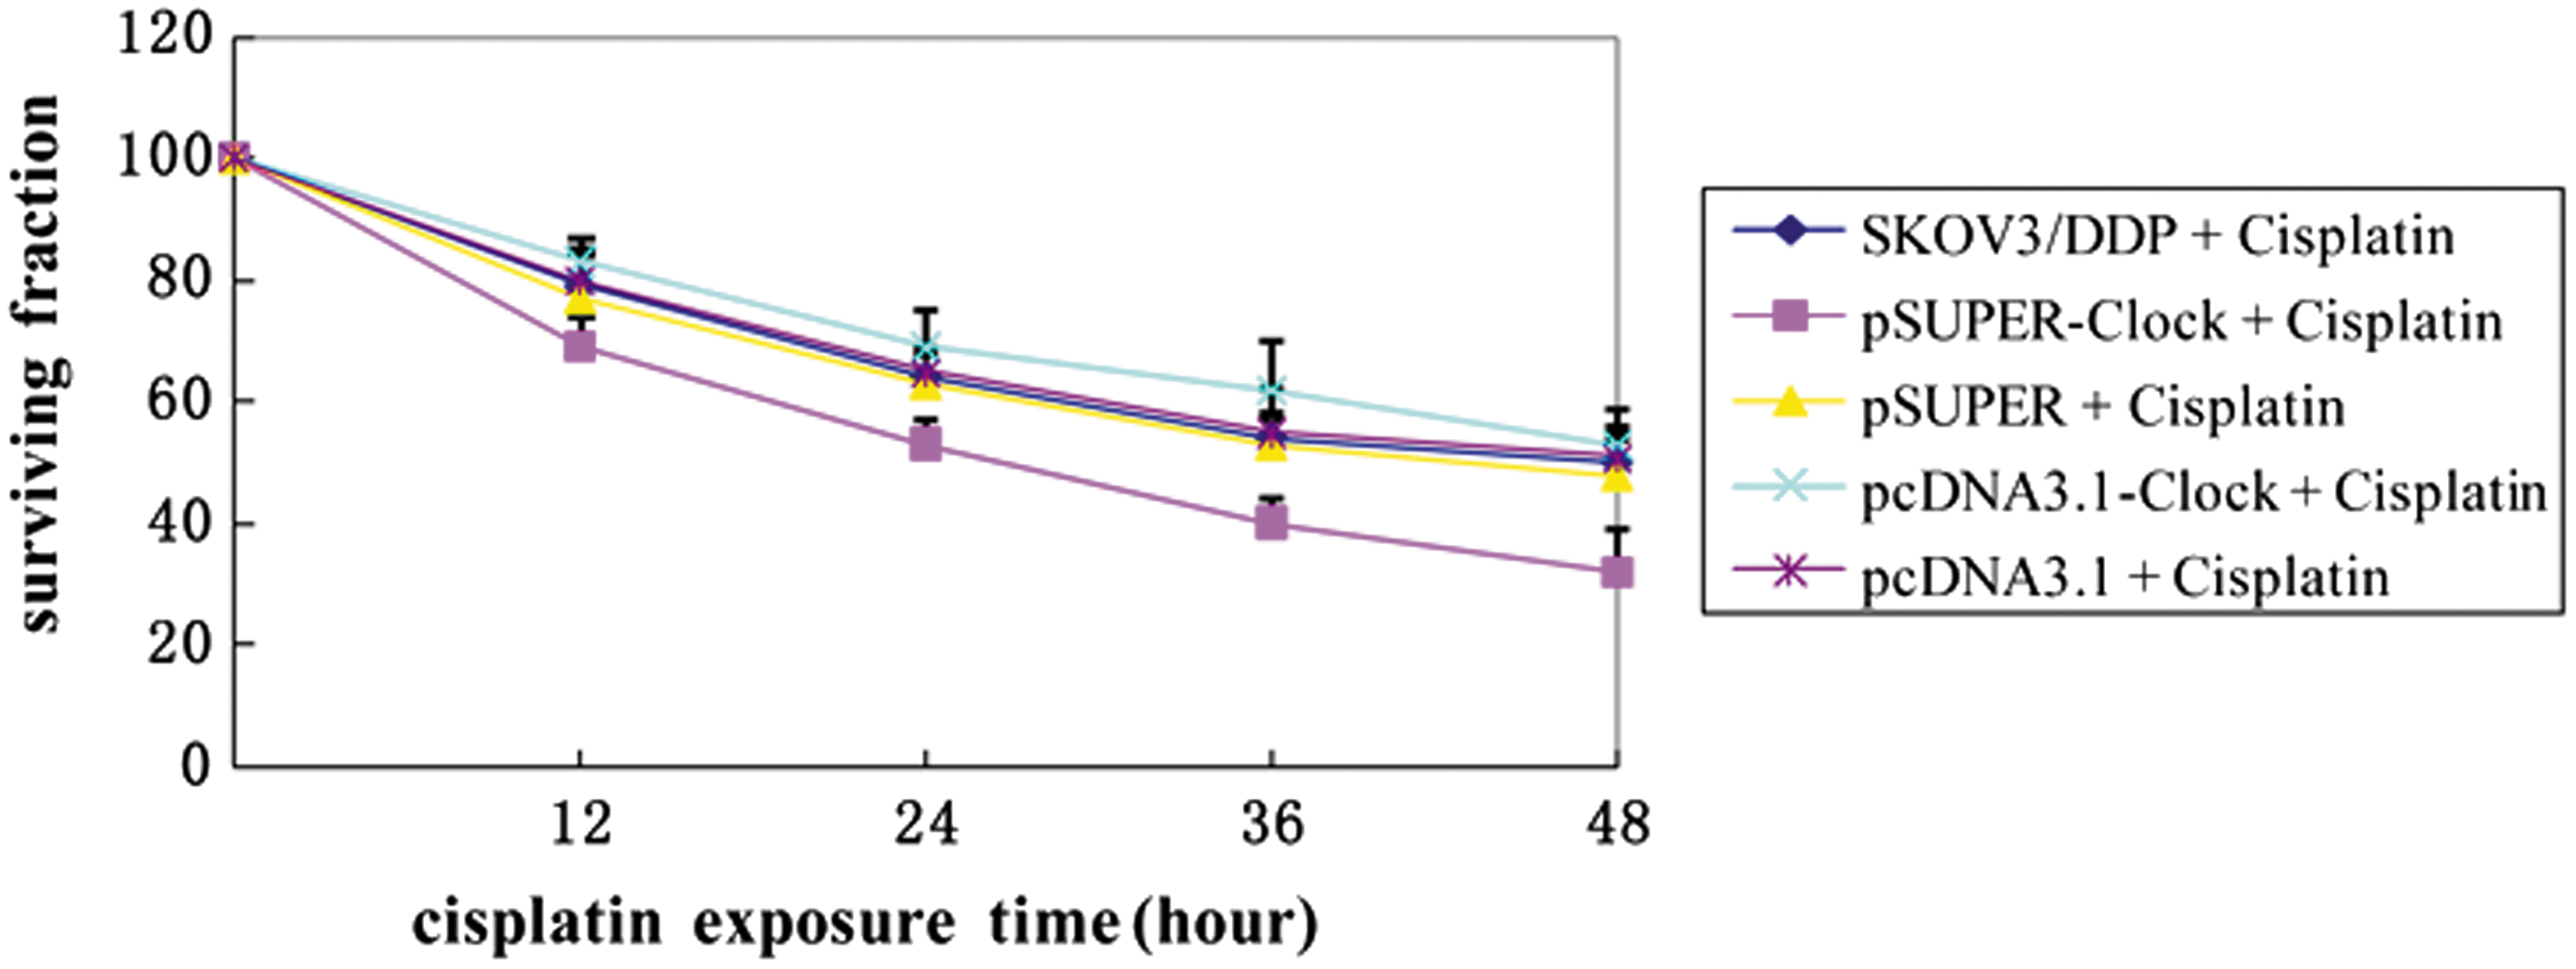
The cell surviving fraction was measured using MTT assay. Color images available online at
Discussion
Autophagy is a process wherein the cells utilize lysosomes to degrade its damaged macromolecular substances and cell organelles. Several studies have confirmed that the changes in the autophagy activity, as well as the death of autophagy cells, are associated with the occurrence and development of malignant tumors. The authors' earlier studies have demonstrated that autophagy plays a major role in killing the ovarian cancer cell lines by chemotherapeutic drugs. Therefore, abnormal autophagy regulation will greatly influence the chemotherapy resistance of ovarian cancer, and thereby the proteins related to autophagy regulation may serve as novel targets for cancer therapy. 7 –9 Obviously, further studies on autophagy and associated genes can reveal the underlying mechanisms of tumor occurrence and development, but also provide insights into the treatment of refractory tumors.
Cisplatin is a small platinum compound. Since its anticancer effects were found and clinically applied in the 1970s, it has been the first-line drug for the treatment of ovarian, testicular, cervical, and lung cancers. Its cytotoxic mechanism is mainly to produce platinum-DNA adducts, which results in DNA interstrand crosslinks to activate apoptosis. 10 Chemotherapy is one of the essential treatment protocols for ovarian cancer. As a first-line drug, cisplatin plays a crucial role in ovarian cancer chemotherapy, and its main mechanism is to induce tumor cell apoptosis. Cisplatin positively affects the initial treatment of tumors, but the relapse may occur because of the resistance of tumor cells during treatment. The reasons for drug resistance are complicated, some of them including reducing drug absorption, increasing drug outflow and secretion, detoxification of glutathione, and increasing repair of damaged DNA. Studies in recent years 11 –13 have found that autophagy can clear the intracellular protein polymer caused by cisplatin treatment and inhibit apoptosis. Application of autophagy inhibitor 3-Ma or chloroquine in lung cancer and cervical cancer cell lines can increase the sensitivity of cancer cells to cisplatin. Autophagy-related ubiquitin-binding protein p62/SQSTM1 is highly expressed in drug-resistant cell lines of ovarian cancer; it also inhibits the apoptosis induced by endoplasmic reticulum stress. The mentioned studies revealed that autophagy plays a major role in tumors exhibiting cisplatin resistance, and studies on its mechanism are conducive to solve this medical issue.
A biological rhythm in nature exists from a single cell to higher plants and animals to adapt to changes in the external environment through the coordination of physiological, biochemical, and metabolic processes of the body. This factor is the core gene controlling the rhythmic system in the organism. Studies have shown that the rhythmic regulator Clock is highly expressed in lung cancer cisplatin-resistant cell lines, but is also highly associated with the tumor cell resistance to cisplatin. 5 Clock is an important regulator of inherent circadian rhythm in mammals. It can form a heterodimer transcription factor complex with another protein Bmal1, which binds to the E-Box element on the DNA to activate the expression of many genes regulating metabolism, eating, physiology, and behaviors. Since the expression of several genes associated with nutritional metabolism and protein degradation accords with circadian rhythm, it can be speculated that autophagy, which is a prime physiological function regulating intracellular metabolism and nutrition stability, will also be regulated by the circadian rhythm. As a matter of fact, several pieces of evidence in recent years have found that the expression of Ulkl that is required to induce autophagy, protein Vps4b that mediates the lysosome, and autophagosome interaction as well as protein Bnip3 that induces autophagy under hypoxic conditions are all present in the circadian rhythm. 6,14,15 Therefore, the rhythmic regulator Clock may potentially affect the tumor cell resistance to cisplatin through the regulation of autophagy. Investigating this molecular mechanism is critically significant for the treatment of tumor resistance.
The results of this study suggested that after the Clock gene was transfected into SKOV3/DDP cell lines, not only the Clock protein expression was significantly increased, but also the expression of LC3 protein reflecting cell autophagy ability was remarkably enhanced. The amount of autophagosomes could be estimated from the MDC fluorescence intensity detected using flow cytometry. The experiments also found that compared with the SKOV3/DDP cells in the control group, few MDC-positive cells occurred in the pSUPER-Clock group, and the fluorescence intensity of MDC-positive cells was significantly increased in the pcDNA3.1-Clock group. Taken together, the mentioned results indicated that the rhythmic regulator Clock can induce autophagy.
In a pre-experiment, the IC50 values of the control and RNAi Clock expression groups were determined after being treated with cisplatin for 12, 24, 36, and 48 hours, respectively. The results indicated that the IC50 values of the interference expression group at different time points of applying cisplatin were lower than those of the control group, especially, the reduction of the IC50 value was most prominent at 48 hours. Thus, a cisplatin concentration of 25.53 μmol/L was selected that corresponded to an IC50 value of SKOV3/DDP cells at 48 hours in the test. Furthermore, the results suggested that after being treated with cisplatin, the apoptosis rate of the Clock inhibiting expression group was significantly increased. Also, with the overexpression of the gene, cisplatin-induced cell apoptosis was weakened, showing a lower apoptotic rate than that of the control group. This suggested that the Clock gene plays a vital role in cisplatin-induced mortality of SKOV3/DDP cells, wherein its interfering expression can upregulate the cisplatin-induced apoptosis signal of SKOV3/DDP cell lines. Previously, some studies have found that the rhythmic regulator gene is highly associated with the cisplatin resistance of tumor cells. 5 The in vitro experiment results further revealed that compared with the that of nontransfected control group and Clock overexpression group, proliferation of SKOV3/DDP cells of the Clock interfering expression group was significantly slowed after being treated with cisplatin, which indicated that combining cisplatin and interfering Clock gene expression exhibited significantly superior cytotoxicity on SKOV3/DDP cell lines as compared with cisplatin alone.
P-gp is an ABC type membrane carrier protein. It can pump a variety of anticancer drugs out of the cells to reduce the intracellular effective drug concentration and enable the tumor cells to escape from the toxicity of drugs. MRP is an ATP-dependent membrane transport protein, of which MRP2 is involved in mediating interaction of cisplatin with glutathione. Previous animal experiments and clinical studies have revealed that MRP2 may be associated with cisplatin resistance of ovarian cancer. 16,17 In this study, it was found that not only the Clock expression in the SKOV3/DDP cell lines of the pSUPER-Clock group was significantly inhibited, but also the expressions of P-gp and MRP2 protein were significantly impeded. This suggested that interfering with Clock expression can enhance cisplatin chemosensitivity of the ovarian cancer SKOV3/DDP cells in vitro, which may be associated with that that it can decrease the expressions of P-gp and MRP2 on the basis of promoting tumor cell apoptosis.
In summary, with indepth studies on autophagy, tumor formation, and growth as well as a variety of anticancer treatment responses, the specific mechanism of autophagy and its related genes to suppress tumors is gradually apparent. Results of this experiment showed that suppressing the Clock gene expression in cisplatin-resistant SKOV3/DDP cell lines of ovarian cancer not only regulated autophagy and inhibited the expression of relevant resistant genes, but also was involved in the mortality process of SKOV3/DDP cell lines; cisplatin could promote apoptosis and suppress the proliferation of tumor cell lines. Utilizing different stages of tumor development as well as variations in the cell differentiation status and signal transduction pathway, it can be looked forward to inducing tumor cell autophagy change through regulation of Clock expression for an anticancer effect. It is speculated that the regulation of tumor cell autophagy will serve as a novel target for inhibiting tumor growth or enhanced efficacy of anticancer drugs, thereby necessitating further investigations.
Footnotes
Acknowledgments
This project was funded by grants from the Natural Science Foundation of Fujian Province of China (no: 2016J01503) and the Excellent Young Doctor Project of Fujian Provincial Hospital (no. 2014YNQN10).
Disclosure Statement
No competing financial interests exist.