
Abstract
Objective:
As a wide-ranging tumor arising from the central nervous system, the exact cause of glioma continues to allude researchers and healthcare providers. This study conducted a bioinformatics approach to perform a comparative analysis among astrocytoma, ependymoma, and oligodendroglioma. Unique disease genes of the three aforementioned glioma subtypes were screened throughout various databases.
Methods:
Genomic functional annotations for unique disease genes and direct interacting genes were obtained with Gene Ontology (GO). The optimal GO terms were selected and the applicable genes were subsequently regarded as type A genes. Differentially expressed genes between the three glioma subtypes were screened as type B genes from the Gene Expression Omnibus. R language was employed in the gene co-expression network analyses between three subtypes, among which the genes with varying correlations were selected as type C genes and genes with different functional modules were selected as type D genes. The common genes among type A–D genes were concluded to be key genes (DISCI and TREM2) followed by the construction of the overexpressed and silenced vectors, as well as cell transfection, MTT assay, scratch test, and Transwell assay.
Results:
In comparison to ependymoma, DISCI exhibited high expression in astrocytoma and oligodendroglioma; TREM2 was upregulated in astrocytoma, but downregulated in oligodendroglioma. DISC1 was found to enhance growth, proliferation, migration, and invasion in both the astrocytoma (U343) and oligodendroglioma cell lines (Hs683), but a negligible effect on the ependymoma cell line (KNS-42). Furthermore, TREM2 had an enhanced impact on U343 cell growth, proliferation, migration, and invasion, while it was observed to be an insignificant contributor regarding the Hs683 cells.
Conclusions:
The key findings of the study provide evidence indicating that DISCI exhibits varying expression levels between astrocytoma and ependymoma, as well as between oligodendroglioma and ependymoma; TREM2 was verified to be differently expressed between astrocytoma and oligodendroglioma.
Introduction
Glioma currently represents one of the most frequently occurring brain malignant tumors worldwide, posing a substantial threat to the health and quality of life of patients around the world. The clinical signs and symptoms of glioma are largely dependent on its respective location and space-occupying effect, as well as the particular function of the affected region of the brain. 1 Glioma is often manifested by symptoms, including headaches, nausea, vomiting, epilepsy, and blurred vision, as well as a host of other space-occupying effects as previously stated. 2,3 Glioma has been noted to consequently result in corresponding symptoms of other local brain functions, such as optic glioma, which can result in the loss of vision 4,5 ; spinal glioma prompting limb pain, numbness, and muscle weakness 6 –8 ; glioma of the central nervous system initiating various sensory and motor disorders 9 ; and glioma in the language region of the brain, resulting in difficulties in language expression and comprehension. 10 Regarding its cell morphology, gliomas are often divided into subtypes, namely that of astrocytoma, oligodendroglioma, and ependymoma. 11,12 Astrocytoma is composed of astrocytes and at present remains the most commonly occurring neuroepithelial tumor. 13,14 Oligodendroglioma is characterized by a pattern of slow growth as well as an overall longer disease course, on average spanning 2–3 years from the initial onset of patient symptoms to medical treatment administration. 15,16 Ependymoma is another type of central nervous system tumor arising from the ependymocytes, often afflicting the ventricles and syringocoele or ependymocytes in the cerebral white matter. 17
Among the glioma subtypes, there appears to be a variation in regard to gene expression and gene mutation, ultimately highlighting the importance of providing further elucidation in regard to the pathogenesis of the different subtypes of glioma. At present, existing literature generally focuses only on the differences between glioma malignancy grades II and III as well as glioma subtypes (astrocytomas and oligodendrogliomas), 18 thus highlighting the urgency for further investigation into the glioma subtypes by researchers and medical providers alike. Previous reports have indicated that high levels of CASC2c and CDC20 are positively associated with the progression of astrocytoma: their overexpression promotes the malignant characteristics of astrocytoma cells, with various studies suggesting there to be a strong correlation with the prognosis of astrocytoma. 19,20 Low levels of TP53INP1 have been demonstrated to play a key role in the unfavorable prognoses of patients with ependymoma. 21
Previous reports have indicated that TCF12 mutation may potentially be associated with the incidence of oligodendroglioma. 22 In addition, by means of quantitative proteomic analysis, Gimenez M claimed that NOVA1 could be used in the identification of both astrocytoma and oligodendroglioma. 23 However, these studies are far from being regarded as complete, with further comparative analysis required for all glioma subtypes and related genes, which play a contributory role, allowing the identification of glioma subtypes in connection with gene expression levels.
Owing to the wide-ranging biological and medical developments being made, particularly with the success of the human genome project, a large amount of biological data are continually being produced due to the findings of the project, which are both rich in connotation and biological knowledge. It remains an ominous challenge for biologists and mathematicians to transform the newly obtained information and data, and subsequently make sense of it through data analysis and processing. Fortunately, bioinformatics represents a powerful interdisciplinary tool that has been developed to meet this challenge. At present, bioinformatics is widely applied in various fields of life science research, and has assumed an indispensable role in the discovery and identification of human diseases and functional genes, in addition to aiding in gene and protein function studies.
The authors have observed an evolution in regard to biological experiment methods and data evaluation. In recent years, thousands of databases have emerged equipped with various classifications, collections, and arrangements of a large number of biological experimental data, in an attempt to efficiently accommodate the growing number of biological data and enable researchers all over the world to share their respective existing research findings. Furthermore, database technology continues to become a vital tool in the processing and storage of biological data. Perhaps the most intriguing element of bioinformatics relates to its use of computational methods in its analyses of biological data, providing research direction when reliable experimental data are otherwise unavailable.
During this study, the authors aimed to identify the differential genes among the three glioma subtypes: astrocytoma, ependymoma, and oligodendroglioma, using bioinformatics methods, in an attempt to further elucidate the relationship between differential gene and glioma subtypes through in vitro cell experiments, to identify the molecular mechanisms associated with the events leading to the occurrence of glioma and the subsequent manifestation of its subtypes from a genetic perspective.
Materials and Methods
Mining for genes associated with different glioma subtypes
Four databases were employed for the retrieval of disease–gene associations, including Online Mendelian Inheritance in Man (OMIM;
Comparative function analysis of the unique disease genes
Gene–gene interaction and molecular function analyses were conducted using the STRING database (
With the use of the mRMRe package in R language (
Comparative analysis of the differentially expressed genes in three glioma subtypes
“Ependymoma,” “Astrocytoma,” and “Oligodendroglioma” were the key words employed, with the datasets GSE21687 (ependymoma), GSE68848 (astrocytoma), and GSE68848 (oligodendroglioma) obtained from the Gene Expression Omnibus (GEO) database (
Gene co-expression network analysis
The gene co-expression network analysis was implemented based on the expression data in GSE21687 (ependymoma), GSE68848 (astrocytoma), and GSE68848 (oligodendroglioma) through pairwise comparison. Genes with different gene expression correlations between two subtypes were identified using Differential Gene Correlation Analysis (DGCA) software (
Selection for key genes
Multiple comparisons of the A–D type genes (A, Optimal GOs; B, DEGs; C, average.DCGs; and D, DC.modules) were conducted for the selection process of the common genes using the UpSetR package in R language (
Cell lines and cell culture
Astrocytoma U343 cells, ependymoma KNS-42 cells, and oligodendroglioma Hs683 cells were acquired from ATCC (Manassas, VA). All cells were incubated at 37°C with 5% CO2 in Dulbecco's modified Eagle's medium (DMEM; Corning, NY) supplemented with 50 μg/mL streptomycin, 50 U/mL penicillin, as well as 10% fetal bovine serum (FBS). The cell lines were confirmed to be negatively free of any mycoplasma contamination.
Reverse transcription–quantitative polymerase chain reaction
Total RNA was extracted from the cell lines and tissues using TRIzol reagent (Thermo Fisher Scientific, San Jose, CA), in accordance with the manufacturer's protocols. The RNA was then converted into complementary DNA using the TaqMan Reverse Transcription kit (N8080234; Thermo Fisher Scientific, San Jose, CA), followed by real-time PCR using the Power SYBR Green kit (4368702; Thermo Fisher Scientific, Inc., San Jose, CA). The primers employed were as follows: TREM2, forward 5′-ACAACTTGTGGCTGCTGTCCTT-3′ and reverse 5′-TTCCGCAGCGTAATGGTGAGAGT-3′; DISC1, forward 5′-CTGCTGCTAGATCTTCCATGTG-3′ and reverse 5′-CTGCTGCTAGATCTTCCATGTG-3′; and GAPDH (as an internal reference), forward 5′-ACAACTTTGGTATCGTGGAAGG-3′ and reverse 5′-GCCATCACGCCACAGTTTC-3′. The reaction conditions were set for a 10-min period at 95°C followed by 40 cycles of 15 s at 95°C and 30 s at 60°C. The relative expressions were subsequently calculated using the 2−ΔΔCt method. 29
Construction of overexpression vector and RNA interference of DISC1 and TREM2 genes
To investigate the effect of DISC1 and TREM2 knockdown on glioma cell proliferation, invasion, and migration, pcDNA3.1-TREM2 and pcDNA3.1-DISC1 plasmids were constructed, with siRNAs against TREM2 and DISC1 synthesized by Shanghai GenePharma Co. Ltd. (Shanghai, China). The siRNA sequences were as follows: DISC1, GCAGGUCCAGAAGUAGAUATT (sense) and UAUCUACUUCUGGACCUGCTT (antisense); and TREM2, GCUGCUAUCUGGAAGACUATT (sense) and UAGUCUUCCAGAUAGCAGCTT (antisense). Six-well plates were used over a 24 h period of transfection, with siRNAs as well as the negative control (NC) RNA followed by infection with the duck enteritis virus. The cell samples were collected at 48 hpi to determine the effects involved with silencing in subsequent experiments.
Cell transfection and grouping
Lipofectamine 2000 (Thermo Fisher Scientific, San Jose, CA) was employed, and human glioma cells were transfected with pcDNA3.1-TREM2 plasmid or pcDNA3.1-DISC1 plasmid, or empty pcDNA3.1 vector as a control (all from Yearthbio, Changsha, China). The cells were subsequently divided into the NC group (normal glioma cells without treatment), vector group (cells treated with empty pcDNA3.1 vector), DISC1+ group (cells treated with pcDNA3.1-DISC1), DISC1− group (cells treated with deleted DISC1), TREM2+ group (cells treated with pcDNA3.1-TREM2), and TREM2− group (cells treated with deleted TREM2).
3-(4,5-Dimethylthiazol-2-yl)-2,5-diphenyltetrazolium bromide assay
3-(4,5-Dimethylthiazol-2-yl)-2,5-diphenyltetrazolium bromide (MTT) assay was conducted using a modified version. Concretely, the transfected cells were inoculated into the 96-well plates (5 × 10³ cells/well) and incubated for 4 h at 37°C with MTT (50 μL). Thereafter, the supernatant was removed and 200 μL of dimethylsulfoxide was added to all the wells at room temperature. After 10 min, the absorbance value was detected at 530 nm using a multiwell microplate reader.
Scratch test
After the glioma cells were confirmed to have reached full confluence, wounds with a width of 1 mm were made using a plastic scriber. Following that, the glioma cells were rinsed with phosphate-buffered saline and incubated for 24 h in serum-free DMEM at 37°C. DMEM was subsequently supplemented with 10% FBS, which was utilized over a 24 h period of cell culture at 37°C. The cell images were captured using a microscope.
Transwell assay
Cell invasion capacity was evaluated using the Transwell chambers (BD Biosciences, Franklin Lakes, NJ). Initially, cell suspension (106 cells/mL) was prepared in DMEM, with 300 μL of suspension added to the upper chamber. Next, 300 μL DMEM with 10% FBS was added to the lower chamber. After 24 h of incubation at 37°C, a cotton-tipped swab was used to wipe off the noninvasive cells. The invaded cells were fixed with 90% ethanol, stained for 10 min at room temperature with crystal violet (Sigma-Aldrich; Merck KGaA, Darmstadt, Germany), and then counted under an inverted microscope (Olympus, Tokyo, Japan).
Statistical analysis
The Statistical Package for the Social Sciences Version 20.0 software (IBM Corp., Armonk, NY) was employed for statistical analyses of experimental data of this study. All data were analyzed using the Bonferroni test and one-way analysis of variance (ANOVA). The values were expressed as the mean ± standard error of mean. GraphPad Prism 5 was used for log-rank test for the construction of the survival analysis. p-Values <0.05 were indicative of statistical difference (*p < 0.05; **p < 0.01; ***p < 0.001).
Results
Genes associated with different subtypes of gliomas
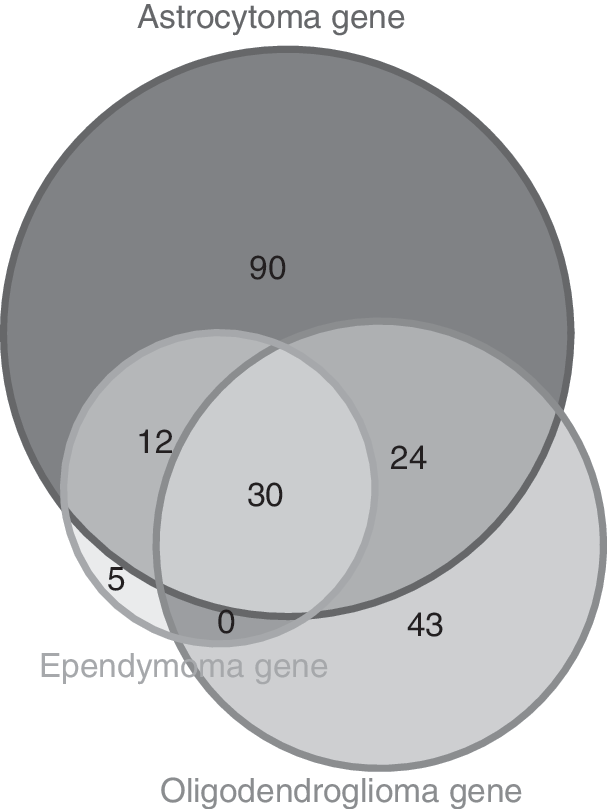
Disease genes associated with the three subtypes of gliomas (astrocytoma, ependymoma, and oligodendroglioma) were retrieved from the four databases OMIM, COSMIC, DisGeNET, and GAD, as well as the PubMed database. In concert with the bioinformatics methods, 156, 47, and 97 genes associated with astrocytoma, ependymoma, and oligodendroglioma, respectively, were retrieved (Supplementary Table S1; Supplementary Data are available online at
After genomic functional annotation for the unique disease genes and their directly interacted genes by application of GO, the optimal GO terms were obtained by pairwise comparison judgment means using the mRMR method. The top 20 optimal GO terms are displayed in Tables 1 –3. The genes contained in these GO terms (type A genes) were identified as candidate genes for the pairwise comparison among the three subtypes (Supplementary Table S3). In accordance with the gene expression data from GSE21687 (ependymoma), GSE68848 (astrocytoma), and GSE68848 (oligodendroglioma), DEG screening was performed using adj.p.Val <0.05 and |log fold change (logFC)| >1 as the thresholds. The DEGs (type B genes) by pairwise comparison among the three glioma subtypes are depicted in Supplementary Table S4.
Top Twenty Optimal Gene Ontology Terms Between Ependymoma and Oligodendroglioma
GO, Gene Ontology.
Top Twenty Optimal Gene Ontology Terms Between Astrocytoma and Oligodendroglioma
Top Twenty Optimal Gene Ontology Terms Between Astrocytoma and Ependymoma
Gene co-expression network analysis
Based on the gene expression data from GSE21687 (ependymoma), GSE68848 (astrocytoma), and GSE68848 (oligodendroglioma), pairwise comparison of gene co-expression in relation to the glioma subtypes was performed. Genes with differential gene expression correlations (type C genes) between two subtypes were identified using the DGCA package in R language (Supplementary Table S5), while the genes with different functional modules (type D genes) were determined in connection with the MEGENA software (Supplementary Table S6). Owing to the fact that fewer DEGs were observed between astrocytoma and oligodendroglioma, it was considerably problematic to conduct a full analysis on the co-expression changes between genes. Hence, there were no type C and type D genes in astrocytoma and oligodendroglioma.
The key genes
Type A–D genes were compared among the different subtypes of gliomas. There were six common genes detected between astrocytoma and ependymoma: DISCI, DSCAM, FBXO4, PCDHB1, POU4F2, and SEMA7A (Fig. 2A); seven common genes between astrocytoma and oligodendroglioma: AIFI, CD74, LTC4 S, P2RT12, PRKCD, TREM2, and VCAM1 (Fig. 2B); and three common genes between ependymoma and oligodendroglioma: BID, DISC1, and OTX1 (Fig. 2C).
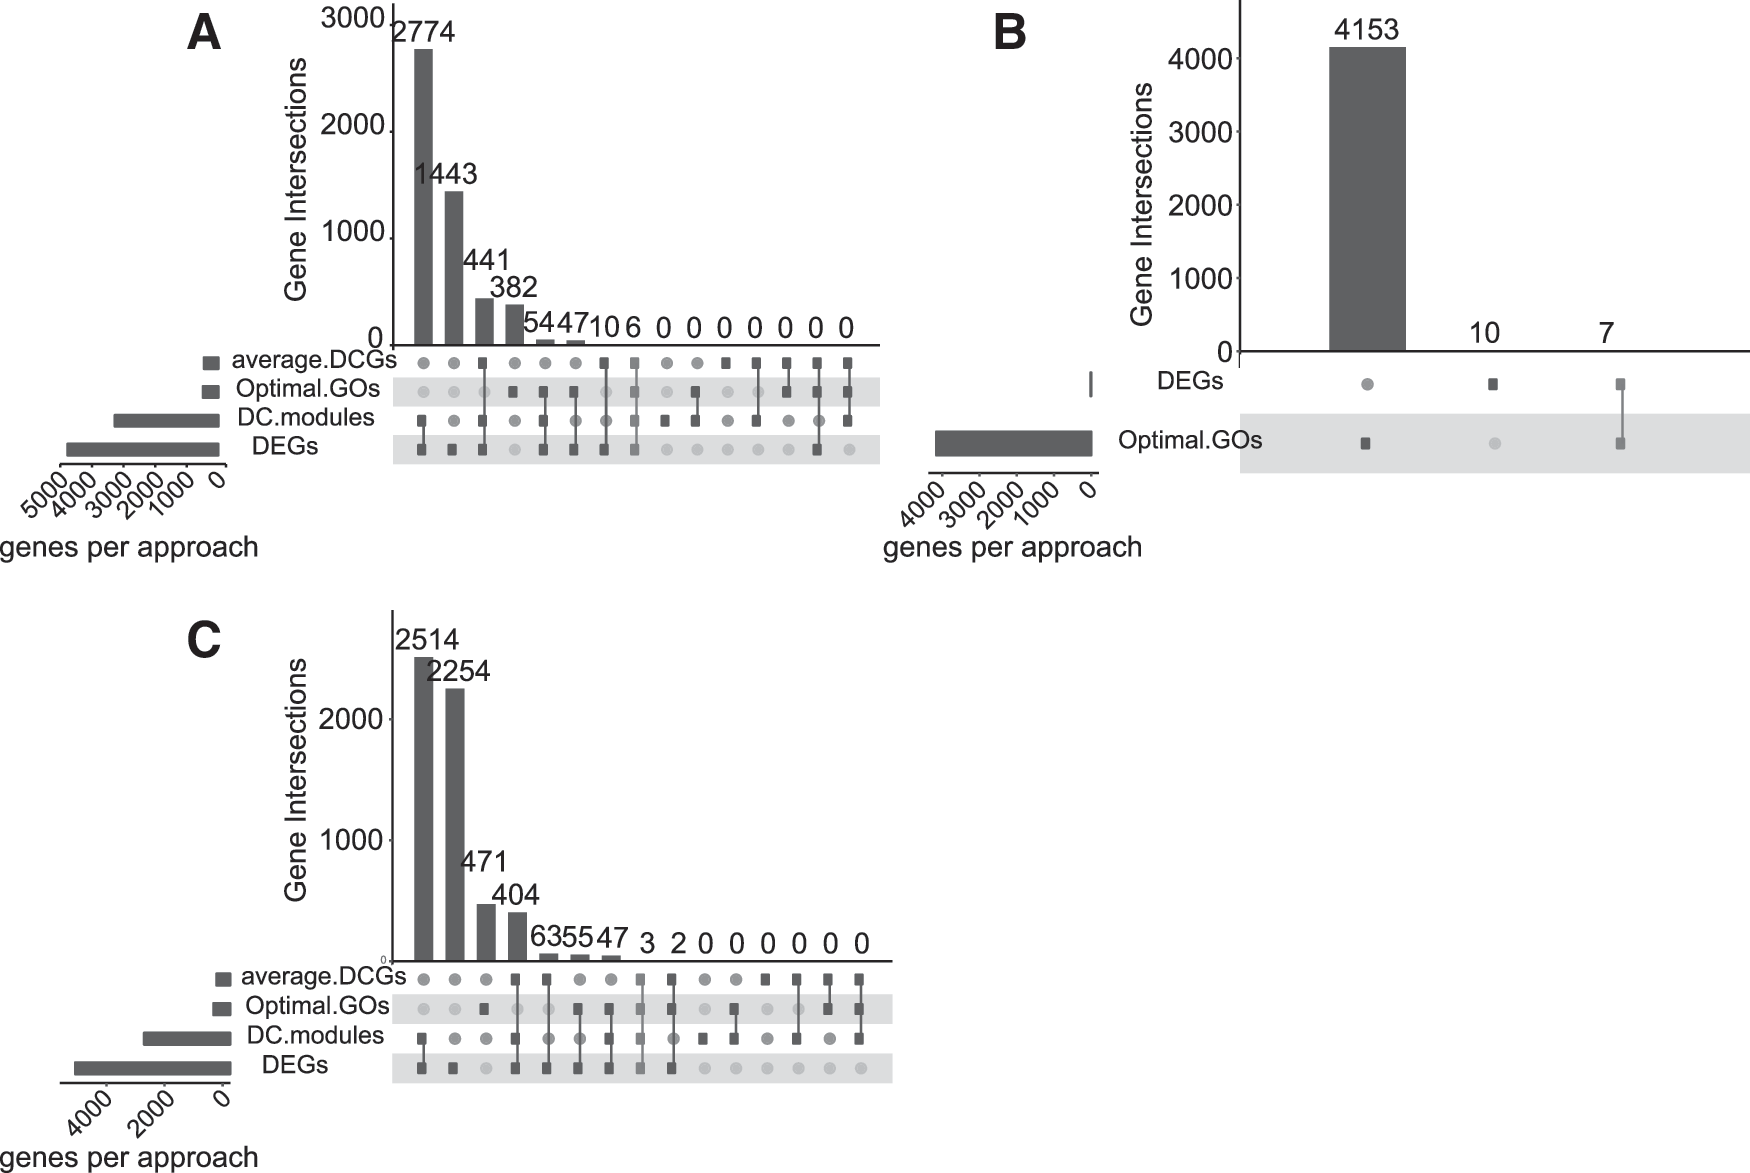
Difference between different glioma subtypes on a genetic level. Among type (A–C) genes, there were six common genes between astrocytoma and ependymoma
Expression levels of DISC1 and TREM2 in the three glioma subtypes before cell transfection
Previous literature has revealed there to be an association between DISC1 and a host of mental disorders, including schizophrenia, while TREM2 has been linked with the occurrence of Alzheimer's disease, and other neurodegenerative disorders such as Parkinson's disease. However, the differences of the two genes in relation to the subtypes of gliomas (astrocytoma, ependymoma, and oligodendroglioma) are yet to be reported on. In comparison to ependymoma, DISC1 expression was elevated in astrocytoma (Fig. 3A) and oligodendroglioma (Fig. 3B); TREM2 expression was upregulated in astrocytoma, while exhibiting a downregulated level in oligodendroglioma (Fig. 3C).

Expression levels of DISC1 and TREM2 in different glioma subtypes before transfection.
In accordance with the gene co-expression network among the three subtypes of gliomas, the variations in the gene function module of DISC1 are displayed in Figure 4A (between ependymoma and oligodendroglioma) and Figure 4B (astrocytoma and ependymoma), identified using the MEGENA package in R language. Following the gene interaction analysis of unique disease genes, the authors determined that DISC1 had a distinctly positive correlation with NTRK2 in astrocytoma; however, no such observation was made in regard to the correlation between NTRK2 in ependymoma (Fig. 4C). Meanwhile, DISC1 was observed to have a significantly positive correlation with KIF21A in oligodendroglioma, while no such observation was made in regard to the correlation with KIF21A in ependymoma (Fig. 4D). In addition, TREM2 and BRCA2 were found to share a distinctly positive correlation to astrocytoma, but were not correlated in oligodendroglioma (Fig. 4E).
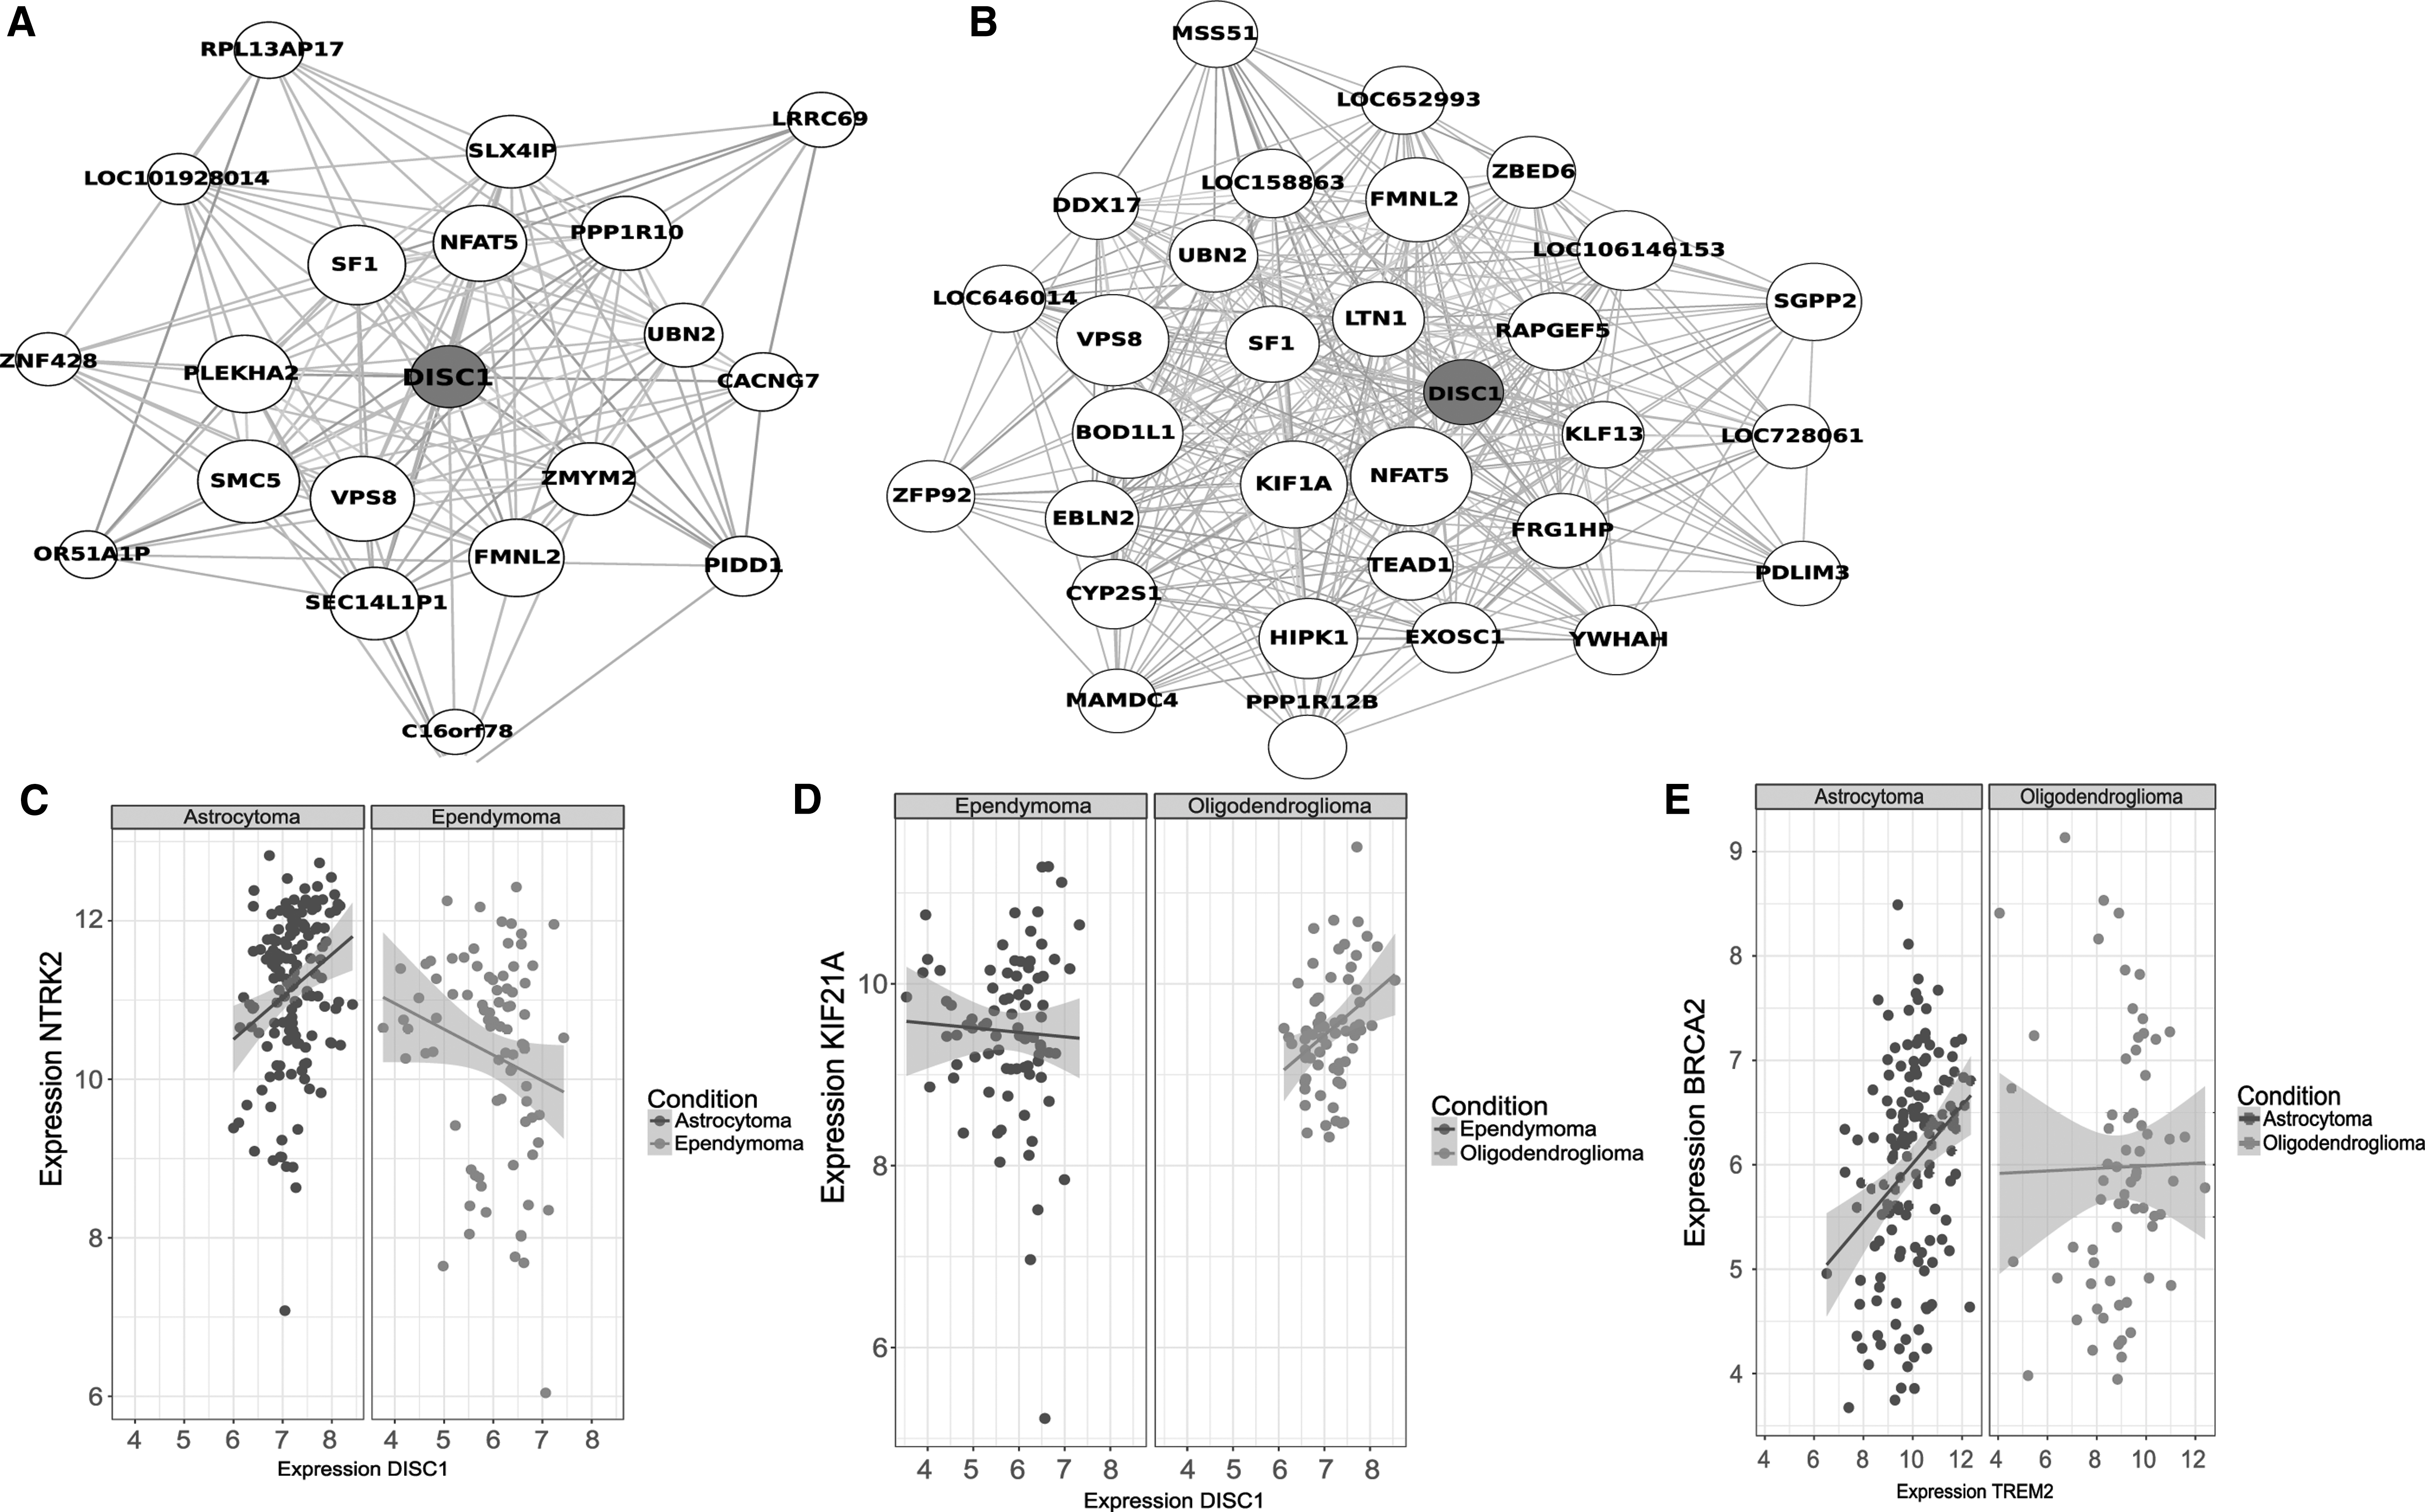
Changes in gene functional module of DISC1 and regulatory relationship of DISC1 and TREM2 with unique disease genes in different glioma subtypes.
The aforementioned results suggested that the expression of DISC1 varied between ependymoma and oligodendroglioma, as well as between astrocytoma and ependymoma; TREM2 expression was a distinctive factor between astrocytoma and oligodendroglioma. The two genes may play roles in tumors by interaction with NTRK2, KIF21A, and BRCA2 on account of their differences among the three subtypes, whereas the specific molecular mechanism is yet to be explored.
Expression levels of DISC1 and TREM2 in the three glioma subtypes after cell transfection
After transfection with DISC1-/TREM2-overexpressed vectors or knockout of DISC1/TREM2 genes individually, the results of reverse transcription–quantitative polymerase chain reaction (RT-qPCR) and Western blot analysis revealed that (Fig. 5A–C), compared with the NC and vector groups, the mRNA and protein expression of DISC1 in U343 and Hs683 cells were significantly increased in the DISC1 + group (p < 0.01). When DISC1 was knocked out or interfered, the mRNA and protein expression of DISC1 was evidently decreased (p < 0.05). However, no significant difference in regard to the expression of DISC1 was detected among the KNS-42 cells. The mRNA and protein expression of DISC1 in KNS-42 cells were lower than that in U343 and Hs683 cells (p < 0.05).
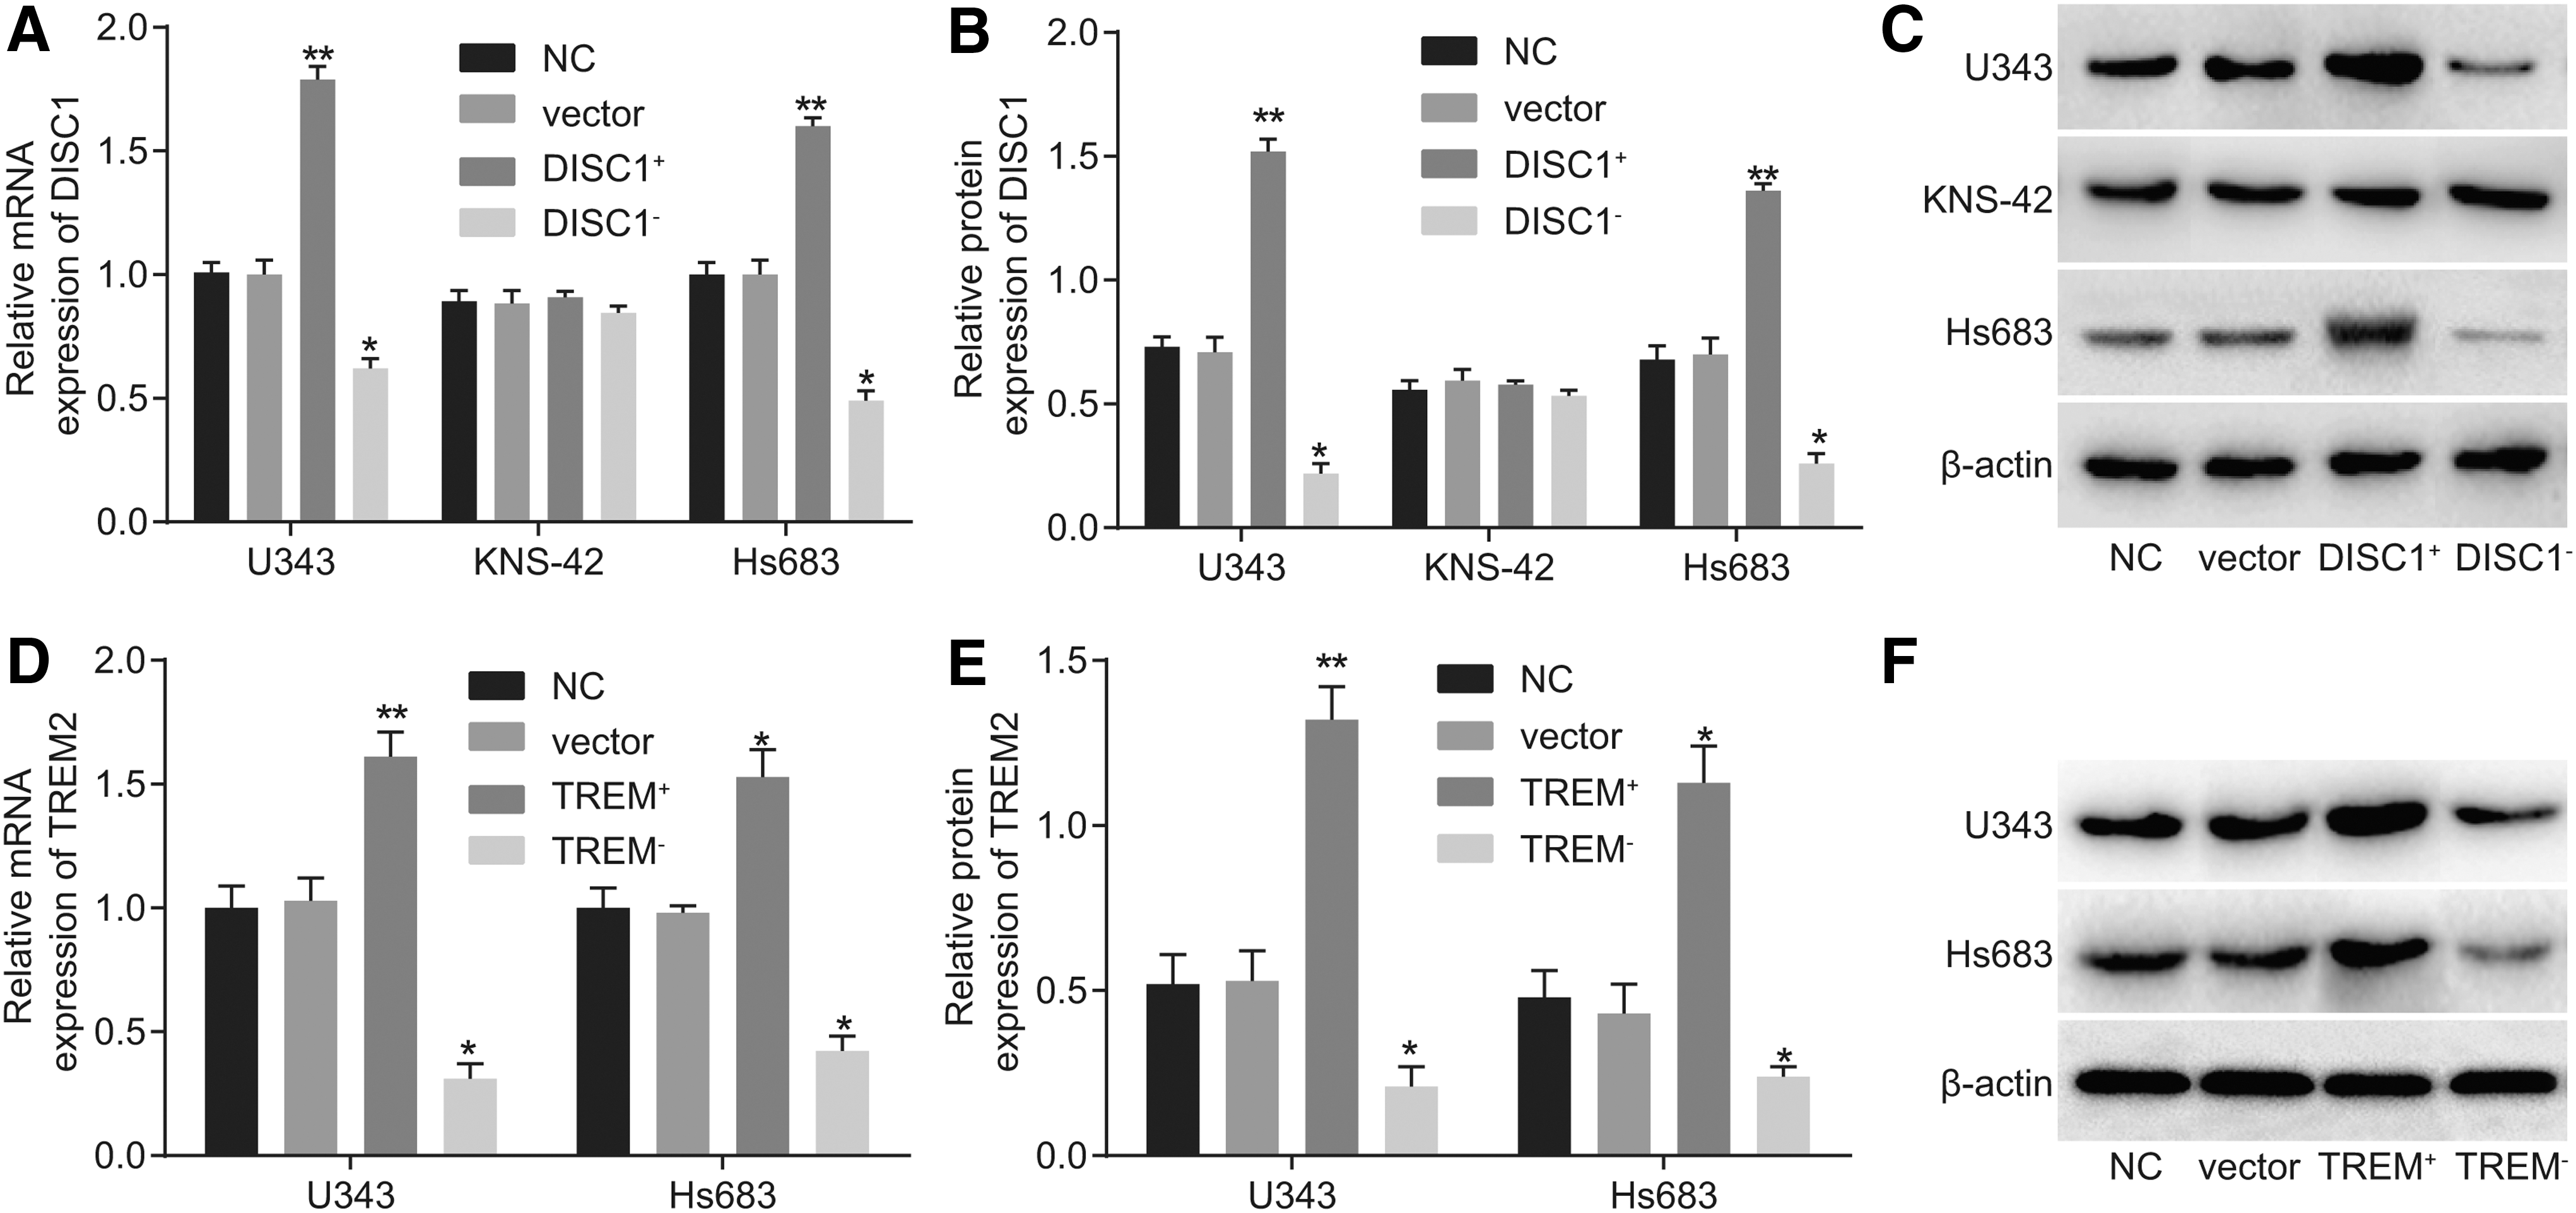
DISC1 and TREM mRNA and protein expression in different cell lines of three subtypes of glioma after gene knockout, based on RT-qPCR and Western blot analysis.
The obtained data inferred that the expression of DISC1 in U343 and Hs683 cells was higher compared with the KNS-42 cells, which was in parallel with the previous bioinformatics prediction result. The results of the detection of mRNA and protein expression of TREM2 by RT-qPCR and Western blot analysis are illustrated in Figure 5D–F. The mRNA and protein expression of TREM2 in the U343 cells was higher than that in the Hs683 cells (p < 0.05). Compared with the NC and vector groups, the mRNA and protein expression of TREM2 in the U343 and Hs683 cells were increased in the TREM2 + group (p < 0.01). In the event of the TREM2 gene knocked out or interfered, the opposite results were observed (p < 0.05). These results implied that cell transfection and gene knockout were not only successful but also effective.
Effects of DISC1 and TREM2 on cell proliferation in the three glioma subtypes
DISC1 has been reported to promote the proliferation of non-small cell lung cancer. 30 To identify the effect of DISC1 and TREM2 on cell proliferation among the different glioma subtypes, the MTT assay was implemented. The results obtained revealed that compared with the NC and vector groups, cell proliferations in U343 cells (Fig. 6A) and Hs683 cells (Fig. 6C) were remarkably increased after transfection with DISC1-overexpressed vectors (p < 0.01), but were decreased after DISC1 knockout (p < 0.05). There was no significant difference observed in the KNS-42 cells (Fig. 6B). Mechanically, TREM2 overexpression was noted to have enhanced the proliferation of the U343 cells (p < 0.01) (Fig. 6D); however, a slightly reduced level of Hs683 cell proliferation was observed (p < 0.01) (Fig. 6E), which was contrary to the effect observed with TREM2 knockout (p < 0.05). These results suggested that DISC1 and TREM2 have different effects on the proliferation of different cell lines.

The viabilities of different cell lines in three subtypes of glioma were affected by gene knockout of DISC1 and TREM, as assessed by MTT assay.
Effects of DISC1 and TREM2 on cell migration and cell invasion in the three glioma subtypes
A previously published article revealed that DISC1 plays a role in the proliferation, migration, and invasion of astrocytoma and oligodendroglioma cell lines. 31 Furthermore, evidence was presented indicating that TREM2 takes a part in the proliferation, migration, and invasion of astrocytoma cell lines. 32 A scratch test was conducted to observe the migration ability of the cells in each group (Fig. 7), while a Transwell assay was performed to assess the invasion ability of the cells in each group (Fig. 8). The results indicated that when compared with the NC and vector groups, the DISC1 + group displayed enhanced migration and invasion abilities among the U343 and Hs683 cells (p < 0.01), while no significant difference in relation to the KNS-42 cells was detected. In comparison to the NC and vector groups, the migration and the invasion abilities of the KNS-42 cells were markedly elevated in U343 cells in the TREM2 − group (p < 0.01) and attenuated in Hs683 cells in the TREM2 − group (p < 0.05). In comparison to the NC and vector groups, the migration and invasion abilities were significantly reduced in TREM2− and DISC1 − groups (p < 0.01). The results showed that a decreased expression of DISC1 and TREM2 could inhibit cell migration and invasion abilities in astrocytoma. The results obtained were consistent with bioinformatics excavation results. The different impacts of DISC1 and TREM2 on the migration and invasion of different cell lines were also noted.

The migration abilities of different cell lines in three subtypes of glioma were affected by gene knockout of DISC1 and TREM, as detected by scratch test.

The invasion abilities of different cell lines in three subtypes of glioma were affected by gene knockout of DISC1 and TREM, as detected by Transwell assay.
Discussion
Glioma remains one of the most common intracranial malignant tumors, generally arising from the glaciates of the central nervous system. 33,34 Glioma can be classified into subtypes namely that of astrocytoma, oligodendroglioma, and ependymoma based on the morphology of the tumor cells. 12 All three glioma subtypes possess varying levels of invasiveness as well as transformation trends ranging from low to high grades, largely associated with their respective clinical and surgical difficulties in relation to full resection, high postoperative recurrence rates, poor prognoses, short survival periods, and high mortality. A high degree of complexity is associated with total resection, often accompanied by high recurrence rates, poor prognosis, short survival time, high mortality rate, and difficulty in treatment. However, each subtype has its own specificity, hence deeper exploration of the genes associated with the different subtypes of glioma may ultimately help to improve the processes involved with glioma diagnoses, which will be of particular benefit to the patient and help clinicians select the most appropriate treatment strategy.
To effectively and accurately screen the genes associated with the three subtypes of glioma, the unique disease genes were initially selected and compared using the disease gene prediction databases (OMIM, COSMIC, DisGeNET, and GAD) and PubMed website. Next, functional annotation was performed on the unique disease genes and their direct interaction with other genes using GO. The genes included in the optimal GO entry were referred to as type A genes. In addition, DEGs between the three glioma subtypes were screened as type B genes from GEO database, while the genes involved in gene correlation change or gene function module were selected as type C and D genes, respectively. By means of comparative analysis of type A–D genes, DISC1 and TREM2 were both identified as the key genes among the three glioma subtypes.
Based on the cellular function and location of the protein coded by DISC1, the phenotype associated with DISC1 in the (1; 11) translocation family included conditions such as schizoaffective disorder, schizophrenia, bipolar disorder, and recurrent major depression. 35 TREM2 is primarily expressed in the microglia of the central nervous system and mediates the phagocytosis of apoptotic neurons through TREM2 connection. 36 Previous studies have demonstrated that rare TREM2 variations could confer elements of risk in regard to both Parkinson's Disease and Alzheimer's disease. 37 –39 By analyzing the correlation between the key genes (DISC1 and TREM2) and the unique disease genes of the three glioma subtypes, the authors determined that the role of DISC1 and TREM2 in the glioma subtypes may be influenced by NTRK2, KIF21A, and BRCA2. A previous study asserted that astrocytoma is the most common primary human brain tumor. 40 Tyrosine receptor kinase B (TrkB), a member of receptor tyrosine kinase, is encoded by the neurotrophic tyrosine kinase receptor type 2 (NTRK2), and is often observed in cases of astrocytoma by means of rearrangement or fusion. 41 The activation of TrkB contributes to astrocytoma development, and as a result, NTRK2 is considered to be a pathogenetic gene as well as a therapeutic target for astrocytoma. 41,42
In the light of the gene functional module, DISC1 has been shown to share a close correlation with NTRK2 (a unique disease gene in astrocytoma). Reports have suggested that BRCA2 is associated with numerous types of tumors, including breast cancer, ovarian cancer, prostate cancer, gallbladder cancer, gastric cancer, and pancreatic cancer, as well as malignant melanoma. Subsequently, BRCA2 mutation has been reported to be associated with astrocytoma and neurocytoma. 43 Likewise, a previous report also suggested that BCCIP encodes a BRCA2- and CDKN1A (p21)-interacting protein, and its deletion represents a key factor in the degree of invasiveness of astrocytoma. 44 Similarly, a significant positive correlation was detected between TREM2 and BRCA2 (the unique disease gene in astrocytoma) in accordance with gene functional module.
Kinesin, an intracellular motor protein involved in the process of intracellular transport and chromosome movement, has been reported to play a role in human tumor cells, including that of chromosome congression, centrosome disjunction, cilium depolymerization, and microtubule nucleation in the mitosis processes. KIF21A has been widely reported to be associated with extraocular muscle fibrosis and has been identified as an essential protein in relation to cancer cell survival. 45 Other kinesins, KIF11 and KIF20A have been reported to participate in the physiological processes of tumors. 46,47 What is more, a positive correlation between DISC1 and KIF21A (the unique disease gene in oligodendroglioma) has been identified.
DISC1 has been asserted to elicit a stimulatory effect on the growth and invasion of non-small cell lung cancer cells. 30 DISC1 has been shown to regulate the proliferation and migration of mouse neural stem cells in vitro, 48 which is in concert with the results observed in this study, in which DISC1 promoted cell proliferation, invasion, and migration in both astrocytoma and oligodendroglioma. Furthermore, this study also demonstrated that TREM2 aided in the facilitation of cell proliferation, invasion, and migration of astrocytoma. Supportively, the mRNA and protein expression levels of TREM2 were reported to have exhibited significant increases in gastric carcinoma cells. 49 The downregulation of TREM2 resulted in a marked decrease in cell proliferation, migration, as well as the invasiveness in glioma cell lines. 32
In conclusion, the key findings of this study suggest that the enhanced effects of DISC1 on the proliferation, migration, and invasion of the astrocytoma, as well as the oligodendroglioma cell lines were more distinct than on those of the ependymoma cell line. Furthermore, evidence was provided indicating that TREM2 enhanced the proliferation, migration, and invasion of astrocytoma cell lines, while attenuated levels of those in oligodendroglioma cell line were observed. More importantly, the authors also speculate that the regulation of DISC1 and TREM2 in different glioma subtypes may be associated with NTRK2, KIF21A, and BRCA2. However, further studies are required to define the finer detailed mechanisms of DISC1 in connection with TREM2 for the development of glioma. Although there is a lack of supporting literature in regard to the specific mechanism and absence of in vivo verification, this study and its key findings may help provide a basis for which future elucidations may be premised upon in regard to the pathogenesis of different glioma subtypes.
Footnotes
Acknowledgment
The authors would like to give their sincere appreciation to the reviewers for their helpful comments on this article.
Disclosure Statement
No competing financial interests exist.
References
Supplementary Material
Please find the following supplemental material available below.
For Open Access articles published under a Creative Commons License, all supplemental material carries the same license as the article it is associated with.
For non-Open Access articles published, all supplemental material carries a non-exclusive license, and permission requests for re-use of supplemental material or any part of supplemental material shall be sent directly to the copyright owner as specified in the copyright notice associated with the article.