
Abstract
Cancer Biotherapy and Radiopharmaceuticals
officially retracts the article entitled, “Silencing of MEOX1 Gene Inhibits Proliferation and Promotes Apoptosis of LNCaP Cells in Prostate Cancer” by Zhi-Yuan Zhu, Xiao-Le Wang, and Da-Peng Li (Cancer Biother Radiopharm. 2019;34(2):91–102; doi:10.1089/cbr.2018.2545) due to oddly styled Western blots in Figs. 3B and 4B and questionable flow-cytometry results in Fig. 7A in the article. These issues were originally questioned in a comment on the PubPeer platform in 20201 but were again reported as being part of a large paper mill in September 2021.2
The corresponding author, Dr. Da-Peng Li, did not respond to requests for the raw data as it pertained to the work for further examination.
Submission of manuscripts from a paper mill is a violation of the journal's standard protocols and is considered an infraction against the rigorous standards of scientific publishing.
The Editor and Publisher of Cancer Biotherapy and Radiopharmaceuticals are committed to preserving the scientific literature and the community it serves and does not tolerate any misconduct.
References
1. PubPeer.
2. Smut C. The scientific sea of miR- and exosome-related knowledge. For Better Science. Sept 22, 2021;
Introduction
Prostate cancer (PC) is a commonly occurring tumor, localized to the prostate tissue among men, with an estimated incidence of 382,000 cases in 2008 in Western countries. 1 The incidence and mortality of PC in China have also shown a rise in recent years. 2 It is usually believed that the occurrence of PC is related to smoking history, coffee consumption, heredity, and a family history of PC. 3 –5 Due to the early asymptomatic, easily worsening and complicated pathogenesis, the majority of patients are diagnosed as middle or advanced PC. 6 Based on the occurrence of dysuria, PC is classified into hormone-dependent PC (HDPC) and hormone-independent PC (HIPC). 7 The mainstay treatments for patients with PC include endocrine therapy, surgery, chemotherapy, hormone therapy, radionuclide therapy, and traditional Chinese medicine. 8,9 Nevertheless, these treatments have limited clinical efficacy for early HDPC but turned to be inefficient for HIPC, and PC patients eventually develop skeletal complications and bone metastasis. 10,11 Gene therapy, as a targeting and noninvasive method for treating PC, has attracted the attention of various researchers. 12
Multiple studies have demonstrated that the abnormal expression of some genes in PC cells is related to the pathogenesis of PC. 13,14 Homeobox protein MOX-1 (MEOX1) is located at chromosome 17q21.31 and encodes 254 amino acid proteins. 15 MEOX1 belongs to a protein family of releasing homeodomain transcription factor. 16 Various homeodomain transcription factors have been revealed to exert a great impact on cells development and differentiation. 17 Among normal human tissues, MEOX1 was highly expressed in the colon, but it was lowly expressed in the uterus and prostate. 18 Similarly, MEOX1 was proved to be closely related to the occurrence and development of gastric cancer. 16 In addition, the abnormal expression of MEOX1 has also been detected in ovarian cancer. 19 Up to now, there is little information about the relationship between the expression of MEOX1 and the occurrence and development of PC. More importantly, ectopically expressed MEOX1 was demonstrated to be correlated to lymph node metastasis and cancer progression. 20 We herein proposed a hypothesis that inhibition of MEOX1 might suppress the proliferation and invasion of PC cells. In this study, we devoted to test the possible inhibitory effects of MEOX1 gene silencing on the proliferation, migration, and invasion of LNCaP cells, with the expectation to provide a new target for PC treatment.
Materials and Methods
Ethical statements
The collection of specimens and clinical data was approved by the Moral and Ethical Committee of Shanghai General Hospital, and signed informed consent was obtained from all patients and their families before collection of specimens. All animal experiments were in line with the social guidelines of the China Animal Ethics Committee, and all efforts were made to minimize the suffering of the included animals.
Microarray analysis
The Gene Expression Omnibus (GEO) database (
Immunohistochemistry
Immunohistochemistry was employed to examine the positive expression of the MEOX1 protein. PC tissues and adjacent normal tissue samples were collected, and fixed with 4% paraformaldehyde for 24 h, dehydrated with ethanol of varying concentrations (80%, 90%, and 100%), and n-butyl alcohol, immersed in wax at 60°C, embedded with paraffin, and sliced into 5 μm serial sections. The sections were spread out at 45°C, floated, baked at 60°C for 1 h, and dewaxed using xylene. Next, the sections were dehydrated with gradient alcohol, soaked in 3% H2O2 for 10 min, washed with distilled water, repaired with antigens at high pressure for 90 min, and allowed to cool down to room temperature. Then, the sections were rinsed with phosphate-buffered saline (PBS) 4 times (3 min each time), and blocked with 5% bovine serum albumin (BSA) (100 μL) at 37°C for 30 min. Subsequently, the sections were incubated with 100 μL MEOX1 primary antibody rabbit antibody (dilution ratio of 1:1000, ab10534; Abcam, Cambridge, MA) at 4°C overnight, rinsed with PBS 3 times (3 min each time), incubated with biotin-labeled goat antirabbit secondary antibody working fluid (dilution ratio of 1:100, HY90046; Shanghai Hengyuan Bio Technology Co., Ltd, Shanghai, China) at 37°C for 30 min and rinsed with PBS another time. After rinsing, the sections were incubated with streptomycin anti avidin-peroxidase solution (Beijing Zhongshan Biotechnology Co. Ltd., Beijing, China) at 37°C for 30 min, rinsed with PBS 3 times (3 min each time), and developed with diaminobenzidine (DAB) (Beijing Bioss Biotechnology Co. Ltd., Beijing, China) at room temperature. After being soaked in hematine for 5 min, the sections were washed under running water, rinsed with 1% hydrochloric ethanol for 4 s, and returned to blue coloration by running water for 20 min. The normal positive cells presenting with brown-yellow coloration were regarded as the protein-positive cells. Quantitative analysis was performed using the Image-Proplus (Media Cybernetics, Inc., Maryland) at high magnification to examine the optical density (OD) average of MEOX1 positive coloration. The criterion for judging protein-positive cells was that the normal positive cells presented brown-yellow coloration. 22 The criteria for judging positive protein expression were as follows: 5 high-power fields (magnified at × 400) for each section were randomly selected, and 100 cells in each field were counted to calculate the percentage of positive cells in total cells. The experiment was independently repeated three times.
Cell culture
Human PC-3, VCaP, DU145, and LNCaP cell lines, and umbilical vein endothelium cell line HEUVCs obtained from the laboratory of Nanfang Hospital Affiliated to Southern Medical University (Guangzhou, China) were cultivated in Roswell Park Memorial Institute (RPMI) 1640 medium (Solarbio Bioscience & Technology Co., Ltd., Shanghai, China) containing 10% fetal bovine serum (FBS) (Solarbio Bioscience & Technology Co., Ltd.) at 37°C in a humidified atmosphere with 5% CO2 in air. The cells were passaged two to three times every week. Reverse transcription–quantitative polymerase chain reaction (RT-qPCR) and western blot analysis were employed to examine the mRNA and protein expressions of MEOX1 in PC-3, VCaP, DU145, LNCaP cell lines, and HEUVCs cell line.
Construction of MEOX1-siRNA recombinant expression vector
According to the siRNA sequences provided by Invitrogen, Inc. (Carlsbad, CA), the sequence for MEOX1 siRNA-1 was 5′-CCAGGAGGAGCACAUCUUCACUGAG-3′, for MEOX1 siRNA-2 was 5′-CCAAGAGAAGCACACCAACACUGAG-3′, and for MEOX1 siRNA-3 was 5′-CCAGGAGUUGCACAGAGCACUGAG-3′. The sequence for negative control (NC) was 5′-CACUGCCAAUGAGACAGAGAAGAAA-3′. 19 The recombinant sequences of MEOX1 were purchased from the Proptech Company. All primers used in the current study were synthetized by Shanghai GenePharma Co. Ltd (Shanghai, China). The cells were divided into three following groups: the siRNA group (transfected with MEOX1-siRNA sequence), NC group (transfected with randomized controlled sequence), and blank group (without any transfection). After 48 h of transfection, the RNA interference effect was measured.
Cell transfection and grouping
Human PC LINCAP cells were assigned into the blank group (transfected with empty vector), NC group (transfected with MEOX1-NC plasmid) and siRNA group (transfected with MEOX1-siRNA plasmid). LINCAP cells in logarithmic phase of growth were treated with trypsin to prepare a cell suspension (DMEM +10% FBS). Then, the treated cells were inoculated into a cell culture dish and were allowed to reach 50%–60% cell confluence. Then, the LNCaP cells were transfected according to the instructions of Lipofectamine™2000 (Invitrogen, Inc.). Lipofectamine 200 and RNA were placed into two sterile Eppendorf (EP) tubes and thoroughly mixed, and were allowed to stand at room temperature for 20 min. Next, the LNCaP cells were incubated with the mixture at 37°C with 5% CO2 in air. After 6–8 h of incubation, the cells were added in complete medium.
Reverse transcription–quantitative polymerase chain reaction
LNCaP cells were collected 48 h after transfection. Total RNA content was extracted using a miRNeasy Mini Kit (Qiagen, Valencia, CA). Next, 5 μL RNA was diluted 20 times with RNase-free ultrapure water. The OD values were measured at wavelengths of 260 and 280 nm in an ultraviolet spectrophotometer, and the concentration and purity of RNA were determined. The ratio of OD260 to OD280 was determined to be between 1.7 and 2.1, indicating that purity was high, which met the needs of the follow-up experiments. RNA was reversely transcribed into cDNA using a PCR amplification instrument according to the instructions of the reverse transcription kit (Beijing TransGen Biotech Co., Ltd., Beijing, China). Primers of GAPDH, MEOX1, and p53 were designed and synthetized by Sangon Biotech Co. Ltd. (Shanghai, China), as shown in Table 1. In accordance with the instructions of EasyScript First-Strand cDNA Synthesis SuperMix (AE301-02; Transgen, Beijing, China), reverse transcription (20 μL) was carried out as follows: 5 μL Mix regent, 5 μL total RNA, 1 μL random primers, and 9 μL RNase Free H2O were mixed in EP tube through centrifugation. Next, a PCR instrument (9700; Beijing Dingguo Changsheng Biotech Co., Ltd, Beijing, China) was used for reverse transcription, and the reaction conditions were as follows: at 37°C for 15 min, at 85°C for 5 s, and at 4°C to terminate the reaction. Then, the obtained cDNA was stored at 20°C, and then subjected to real-time quantitative PCR according to the instructions of SYBR®Premix Ex TaqTM II Kit (TaKaRa, Dalian, China). The reaction system (20 μL) comprised of the following: 10 μL SYBR Premix, 2 μL cDNA, 0.6 μL forward primers, 0.6 μL reverse primers, and 6.8 μL sterile water. RT-qPCR was performed using ABI 7300 real-time fluorescent quantitative PCR (Thermo Fisher Scientific, MA) with GAPDH serving as the internal reference. The reaction conditions were as follows: predenaturation at 95°C for 30 s; 35 cycles of denaturation at 94°C for 30 s, annealing for 20 s, and extension at 72°C for 30 s. Subsequently, the expression of each gene was detected. The 2−ΔΔCt method was applied to analyze the relative expressions of target genes between the experimental group and the control group. The applied formulas were as follows: ΔCt = CT(the target gene) − CT(the internal reference). ΔΔCT = ΔCt(the experimental group) − ΔCt(the control group). 23 The threshold cycle (Ct) was the amplification cycle when the fluorescence signal reached the threshold. At this point, amplification was shown in the logarithmic phase of growth. This experiment was independently repeated three times.
Primer Sequences for Reverse Transcription-Quantitative Polymerase Chain Reaction
Bax, Bcl-2-associated X; Bcl-2, B-cell CLL/Lymphoma 2; F, forward; GAPDH, glyceraldehyde-3-phosphate dehydrogenase; MEOX1, homeobox protein MOX-1; R, reverse; RT-qPCR, reverse transcription–quantitative polymerase chain reaction.
Western blot analysis
Protein content was extracted from the cells collected in the experiment, and then the protein content was determined using ultraviolet spectrophotometry. The proteins were split, fully mixed with 3 × sample loading buffer, boiled in boiling water for 10 min, and centrifuged at 17,892 g for 5 min. Next, the proteins underwent gel electrophoresis by 15% sodium dodecyl sulfate-polyacrylamide gel electrophoresis (SDS-PAGE), transferred into nitrocellulose membrane using the semi-dry method at 20 V for 12 min, and predyed by ponceau dye liquor, and the molecular weight of protein was labeled. The membrane was rinsed with tris-buffered saline tween (TBST) buffer and incubated with the primary antibodies rabbit antihuman MEOX1 (ab105349, 1 μg/mL) polyclonal antibody, GAPDH (ab37168, 1 μg/mL) polyclonal antibody, and rabbit antihuman p53 (Cell Signaling Technology, TX) at 4°C overnight. Then, the membrane was incubated with the secondary antibodies goat antirabbit immunoglobulin G-horseradish peroxidase (IgG-HRP) and goat antimouse IgG-HRP (dilution ratio of 1:5000; Abcam, Inc.) at 37°C for 2 h, rinsed with TBST 3 times (10 min for each), and washed with TBS for 10 min. Last, the membrane was developed with Lumi-Light Electrochemiluminescence (ECL) kit (Roche Diagnostics GmbH, Mannheim, Germany) and pressed by X-ray film, followed by developing and fixing, washing, and drying. Western blot analysis was used to examine the expression of apoptosis-related proteins, the Image J software was used to analyze the gray value of protein bands, and the relative protein expression was presented by the gray value of target gene to internal reference.
Cell count kit-8 (CCK-8) assay
The transfected LNCaP cells were collected and seeded in a 96-well plate (cell density of 2 × 10³ cells/well). Subsequently, 200 μL cell medium was added to each well. Three replicated wells were set for each group, and each experiment was repeated three times. CCK-8 assay was applied to determine the cell viability at different time intervals (0, 24, 48, and 72 h), and eight wells of each group were detected at each time point. The OD in three groups was measured every 24 h at a wavelength of 450 nm using a microplate reader. The cell growth curve was plotted using the time as the abscissa axis and A450 nm as the vertical axis. This experiment was independently repeated three times.
Colony formation assay
LNCaP cells in logarithmic phase of growth were obtained, 500 of which were evenly inoculated into a plate with a diameter of 10 cm. The cells were transfected every 3 d according to cells grouping. Subsequently, the cells were routinely cultured for 10 d. The plate was taken out when the macroscopic cell colonies formed, and then the cells were rinsed with PBS two times, and fixed with methyl alcohol for 15 min. After the fixation fluid was discarded, Wright's staining was performed to count the number of cells. The colony formation rate of cells was calculated as well. This experiment was independently repeated three times.
Scratch test
The LNCaP cells were seeded in a six-well plate (cell density of 5 × 10⁵/well). After 24 h of transfection, the cells were cultured with serum-free culture medium. A straight line was scratched using a sterile pipet and a ruler, and photographed under an inverted microscope, and this time point was recorded as 0 h. Subsequently, the cells were cultured in saturated humidity with 5% CO2 in air at 37°C. After 24 h, the scratch wound healing in the same location was observed, and the healing status in the blank, NC, and siRNA groups was compared. By measuring the scratch width of multiple locations, the mean rate of scratch wound healing was calculated. The rate of scratch wound healing (%) = (the scratch width at 0 h − the scratch width at 24 h)/the scratch width at 0 h × 100%. This experiment was independently repeated three times.
Transwell assay
Matrigel gel was diluted to 300 μL/mL by serum-free medium at 4°C. The diluted Matrigel (400 μL) was evenly coated on the surface of the polyethylene terephthalate (PET) membrane in invasion chamber, and then the membrane was air-dried. The transfected cells in good growth condition were treated with trypsin, and the cell concentration was adjusted to 3 × 10⁵ cells/mL. Next, 300 μL cells were inoculated in the upper chamber. RPMI 1640 medium (600 μL) containing 10% serum (serum as chemokine) was added into the lower chamber, 12 h after which the cells were fixed with 70% methanol solution for 20 min, stained with trypan blue, and observed under an inverted microscope. The number of cells invaded on the surface of PET membrane was obtained by calculating the mean from selecting five fields under microscope. This experiment was repeated three times.
Flow cytometry
BD Annexin V-EGFP kit (BD Bioscience) was employed to determine the cell cycle. At first, the cells were seeded in a six-well plate (cell density of 2 × 10⁵ cells/well) and transfected for 48 h. Then, 5 mL of supernatant was collected in a tube and detached with 400 μL typsin. The reaction was terminated by the addition of extra supernatant after cells attained round shapes. Cells were then centrifuged at 716 g for 5 min with the supernatant discarded, rinsed with 5% PBS two times with the supernatant discarded, resuspended in 5% PBS (300 μL), and fixed in 700 μL of absolute ethanol for 24 h at −20°C. After being centrifuged at 716 g for another 5 min with the supernatant removed, the cells were washed twice with 2% BSA and suspended in 500 μL Binding Buffer. Then, the cells were added with 5 μL Annexin V-EGFP and 5 μL propidum iodide (PI) to mix and react at room temperature for 5–15 min in dark conditions. BD flow cytometry (BD Bioscience) was applied to analyze the cell cycle. The experiment was independently repeated three times.
Annexin V-FITC/PI staining
Cells were seeded in a six-well plate, and incubated at 37°C in incubator with 5% CO2 in air. Upon reaching 80% confluence, the cells were cultured with new DMEM medium. After being treated with trypsin without ethylene diamine tetraacetic acid (EDTA), 1 × 10⁵ cells were collected and resuspended with 500 μL binding buffer, incubated with 5 μL Annexin V-FITC and 5 μL PI (Nanjing KeyGen Biotech, Nanjing, China) at room temperature for 5–15 min in dark conditions. FACS Calibur flow cytometry was used for the detection of cell apoptosis. Early apoptotic cells were located in the Annexin V−/PI− quadrant, while late apoptotic cells were located in the Annexin V+/PI+ quadrant. The early and late apoptotic cells were counted together. The experiment was independently repeated three times.
Tumor formation in nude mice
A total of 24 BALB/c nude mice (aged 6–7 weeks, weighing 18–20 g) were purchased from Shanghai SLAC Laboratory Animal Co., Ltd (Shanghai, China), and then raised under specific-pathogen-free condition in the Experimental Animal Center of Chongqing Medical University (Chongqing, China). The mice were randomly assigned into the siRNA group, NC group, and blank group with eight mice in each group. Under aseptic conditions, the nude mice in the siRNA group were subcutaneously injected on their backs with equivalent LNCaP cells that steadily expressed MEOX1-siRNA, the nude mice in the NC group were subcutaneously injected on their backs with the LNCaP cells that were transfected with scramble siRNA, and the nude mice in the blank group were subcutaneously injected on their backs with equivalent LNCaP cells. The long diameter (a) and short diameter (b) of subcutaneous tumor of nude mice were measured, and the tumor volume (TV) was calculated; the formula was as follows: TV = 1/2 × a × b 2 . The tumor growth of LNCaP cells was observed to plot the growth curve. The nude mice were sacrificed 30 d later, and then their tumor tissues were collected, weighed, fixed with neutral formalin, dehydrated, and embedded with paraffin. In addition, immunohistochemical staining was applied to measure the level of proliferative cell nuclear antigen (PCNA) in each group; then tissues were added with serum sealing fluid, rinsed with PBS 3 times (5 min each time), washed with 3% H2O2 for 10 min, and then rinsed again with PBS 3 times (5 min each time). Next, the tissues were added with PCNA primary antibody (dilution ratio of 1:1000; Cell Signaling Technology) at 4°C overnight, rewarmed at room temperature for 45 min the following day, and rinsed with PBS 3 times (5 min each time). Tissues were added with the secondary antibody (dilution ratio of 1:5000; Cell Signaling Technology) at room temperature for 20 min, and rinsed with PBS 3 times (5 min each time). The double-blind method was employed to evaluate the results. A total of 5 high-power fields ( × 400) for each tissue section were randomly selected, and 100 cells were counted in each field, and then the percentage of positive cells in total tumor cells was calculated.
Statistical analysis
Statistical analyses were performed using the SPSS 21.0 software (IBM Corp., Armonk, NY). All measurement data were presented as mean ± standard deviation (SD). The test of normality for multiple data was conducted using the Kolmogorov–Smirnov method, the post hoc test (Tukey–Kramer Multiple Comparisons Test) was performed to compare the data of normal distribution among groups, and the post hoc test (Kruskal–Wallis Dunn's multiple comparison) was used to analyze the data of skew distribution. Comparisons of data of homogeneity of variance in normal distribution between two groups were conducted using the unpaired t-test while comparisons within the same group were conducted using the paired t-test. Comparisons of data of heteroscedasticity of normal distribution were conducted using the Welch's adjusted t-test. Cell proliferation was analyzed by double-way analysis of variance. Enumeration data were presented as %, and examined by the chi-square test. p < 0.05 was regarded as statistically significant.
Results
Highly expressed MEXO1 is likely to affect PC
R language was applied to screen the differentially expressed genes in the GSE46602 chip with the screening criteria of |log2FC| > 2.0 and adj.p.Val < 0.05. Next, 828 differentially expressed genes were obtained and then the heatmap of first 10 genes was drawn (Fig. 1A). To better understand the expression of the first 10 differentially expressed genes (CYP3A5, KRT23, LAMB3, MIR205HG PPARGC1A, MEOX1, SLC18A2, AJUBA, SLC14A1, and HPN) in PC, Chilibot was applied to search the relationship between differentially expressed genes and cancer, and then the relational network of differentially expressed genes and PC was plotted. As shown in Figure 1B, the aforementioned 10 genes except MEOX1 and LAMB3 were directly or indirectly related to PC, indicating that MEOX1 and LAMB3 were expressed relatively poorly in PC. Similarly, previous studies have reported correlations between the differential expression of LAMB3 and PC, 24,25 while there remains to be a vacancy in studies focusing on the relationship between the expression of MEOX1 and PC. Therefore, this study focused on studying the effect of MEOX1 expression on PC. In the heatmap of the GSE46602 chip (Fig. 1A), the expression of MEOX1 was found to be higher in PC tumor tissues than in normal tissues. Furthermore, MEOX1 was previously reported to be related to poor prognoses of breast cancer patients and lymph node metastasis. 20 Hence, we speculated that higher expression of MEOX1 is likely to affect PC.
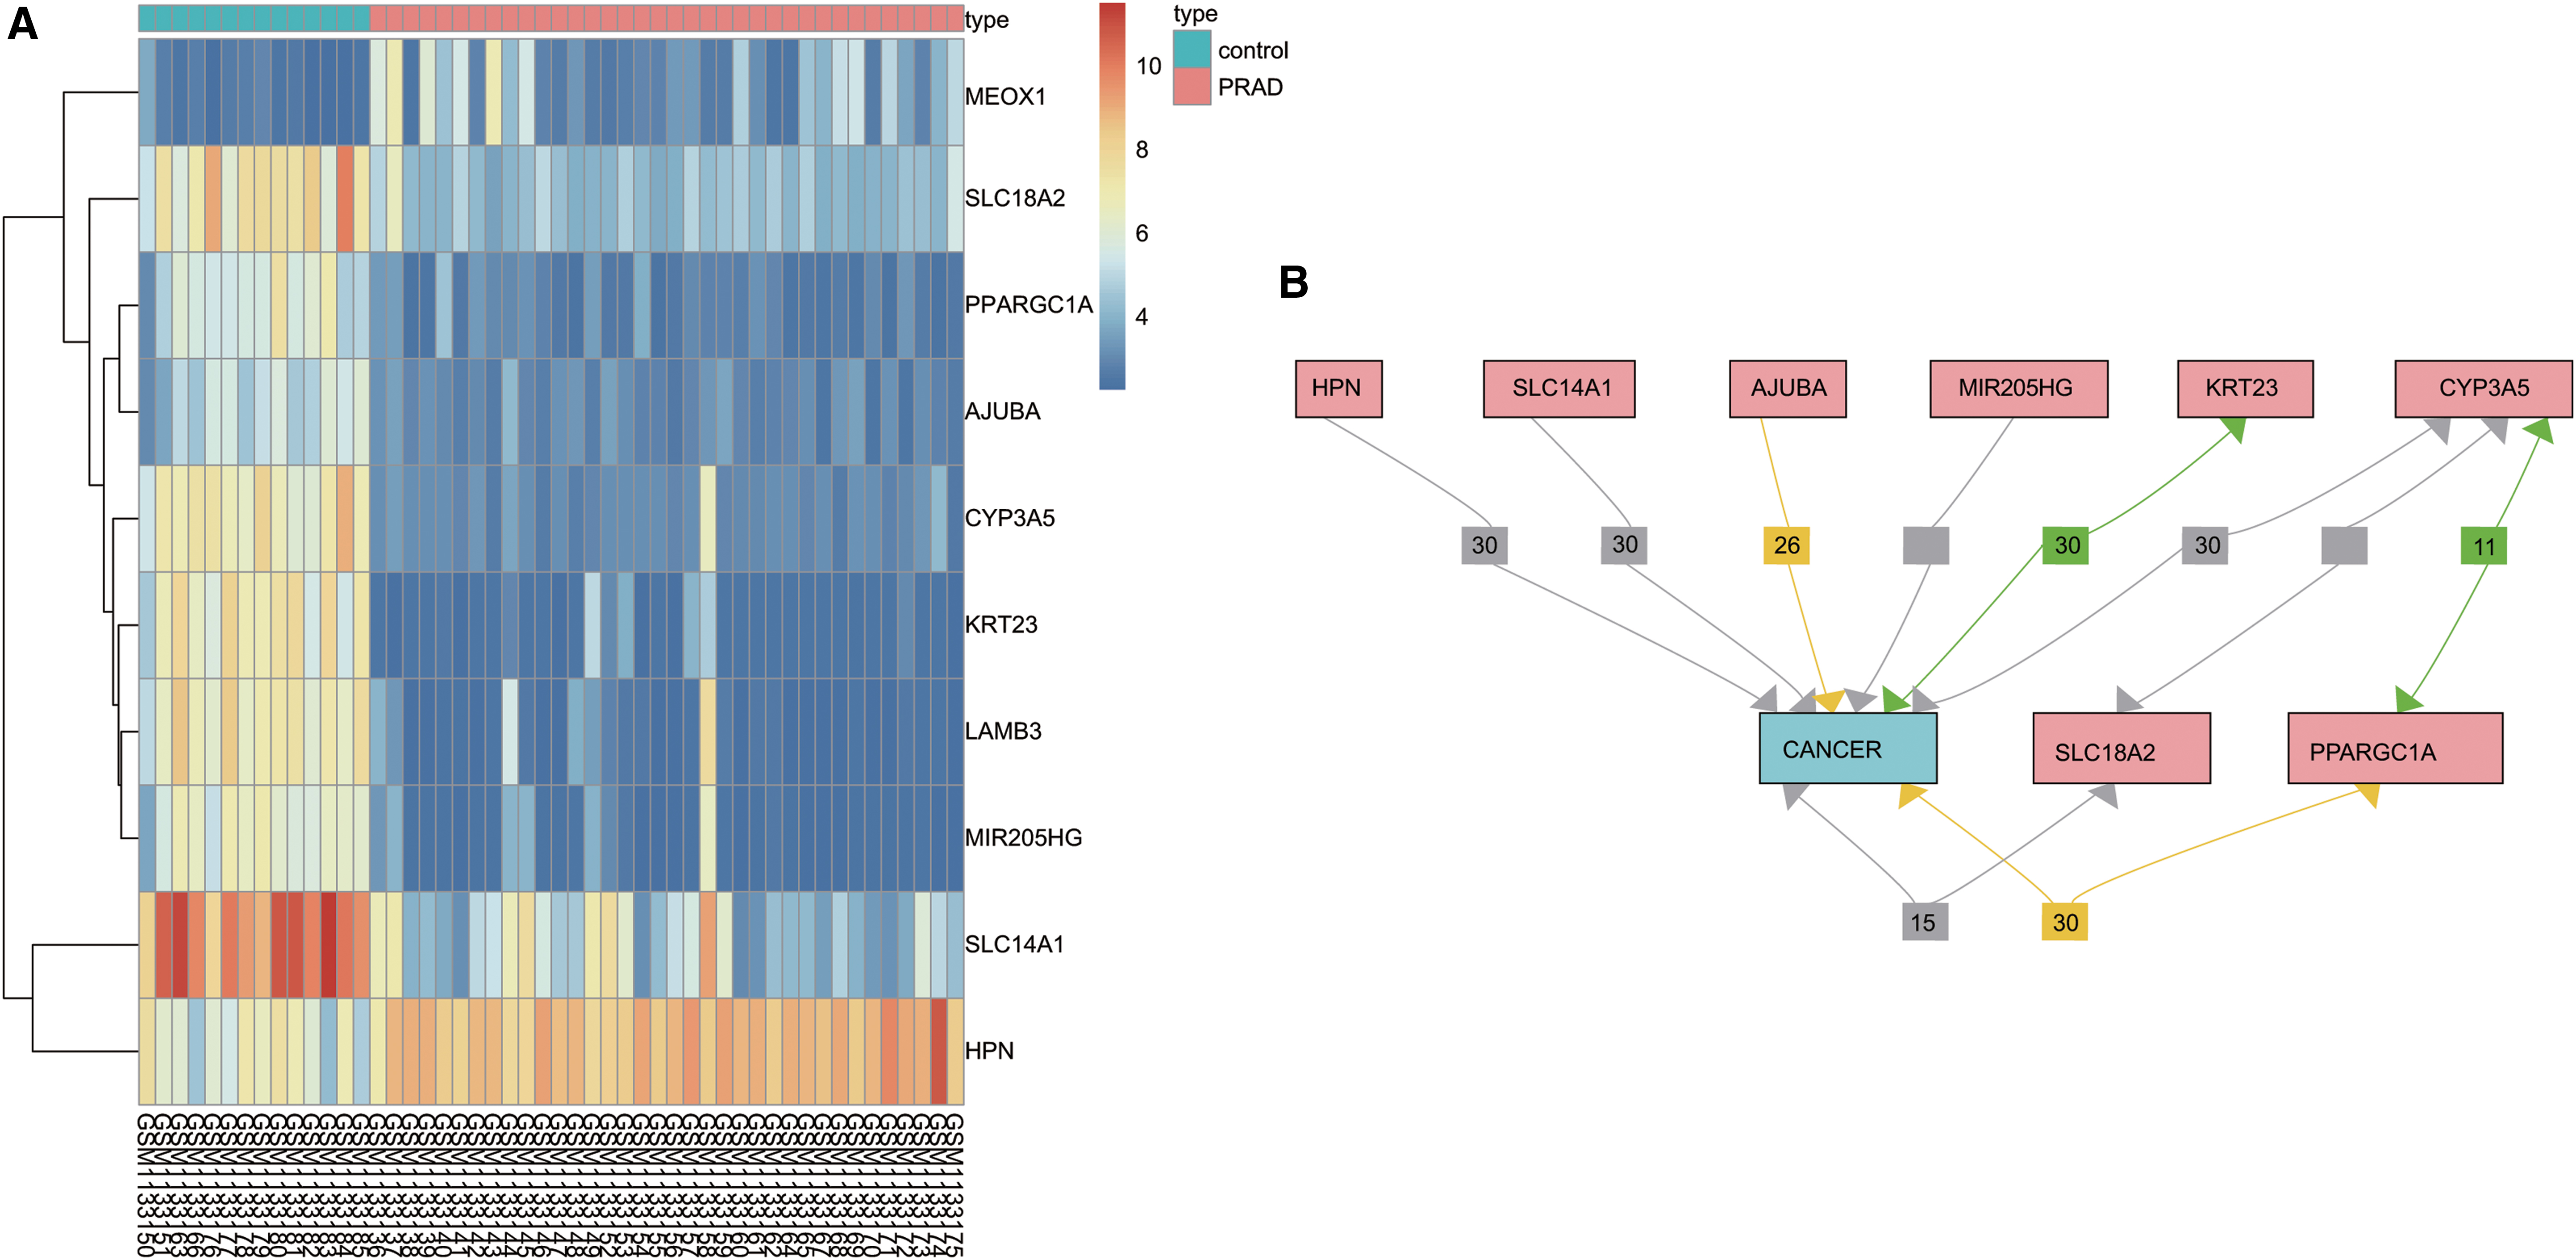
MEOX1 expresses highly in PC.
PC tissues exhibit a higher positive expression of MEOX1 protein
Immunohistochemistry was employed to examine the positive expression of MEOX1 protein in PC tissues and adjacent normal tissues, and the results are shown in Figure 2A and B. The positive cells of MEOX1 protein were stained dark-brown. The positive expression rate of MEOX1 protein in the PC tissues (81.429% ± 5.423%) was found to be significant higher than that in the adjacent tissues (32.175% ± 3.420%), indicating a significant difference (p < 0.05). Therefore, it was found that PC tissues exhibited an increased positive expression of MEOX1 protein.
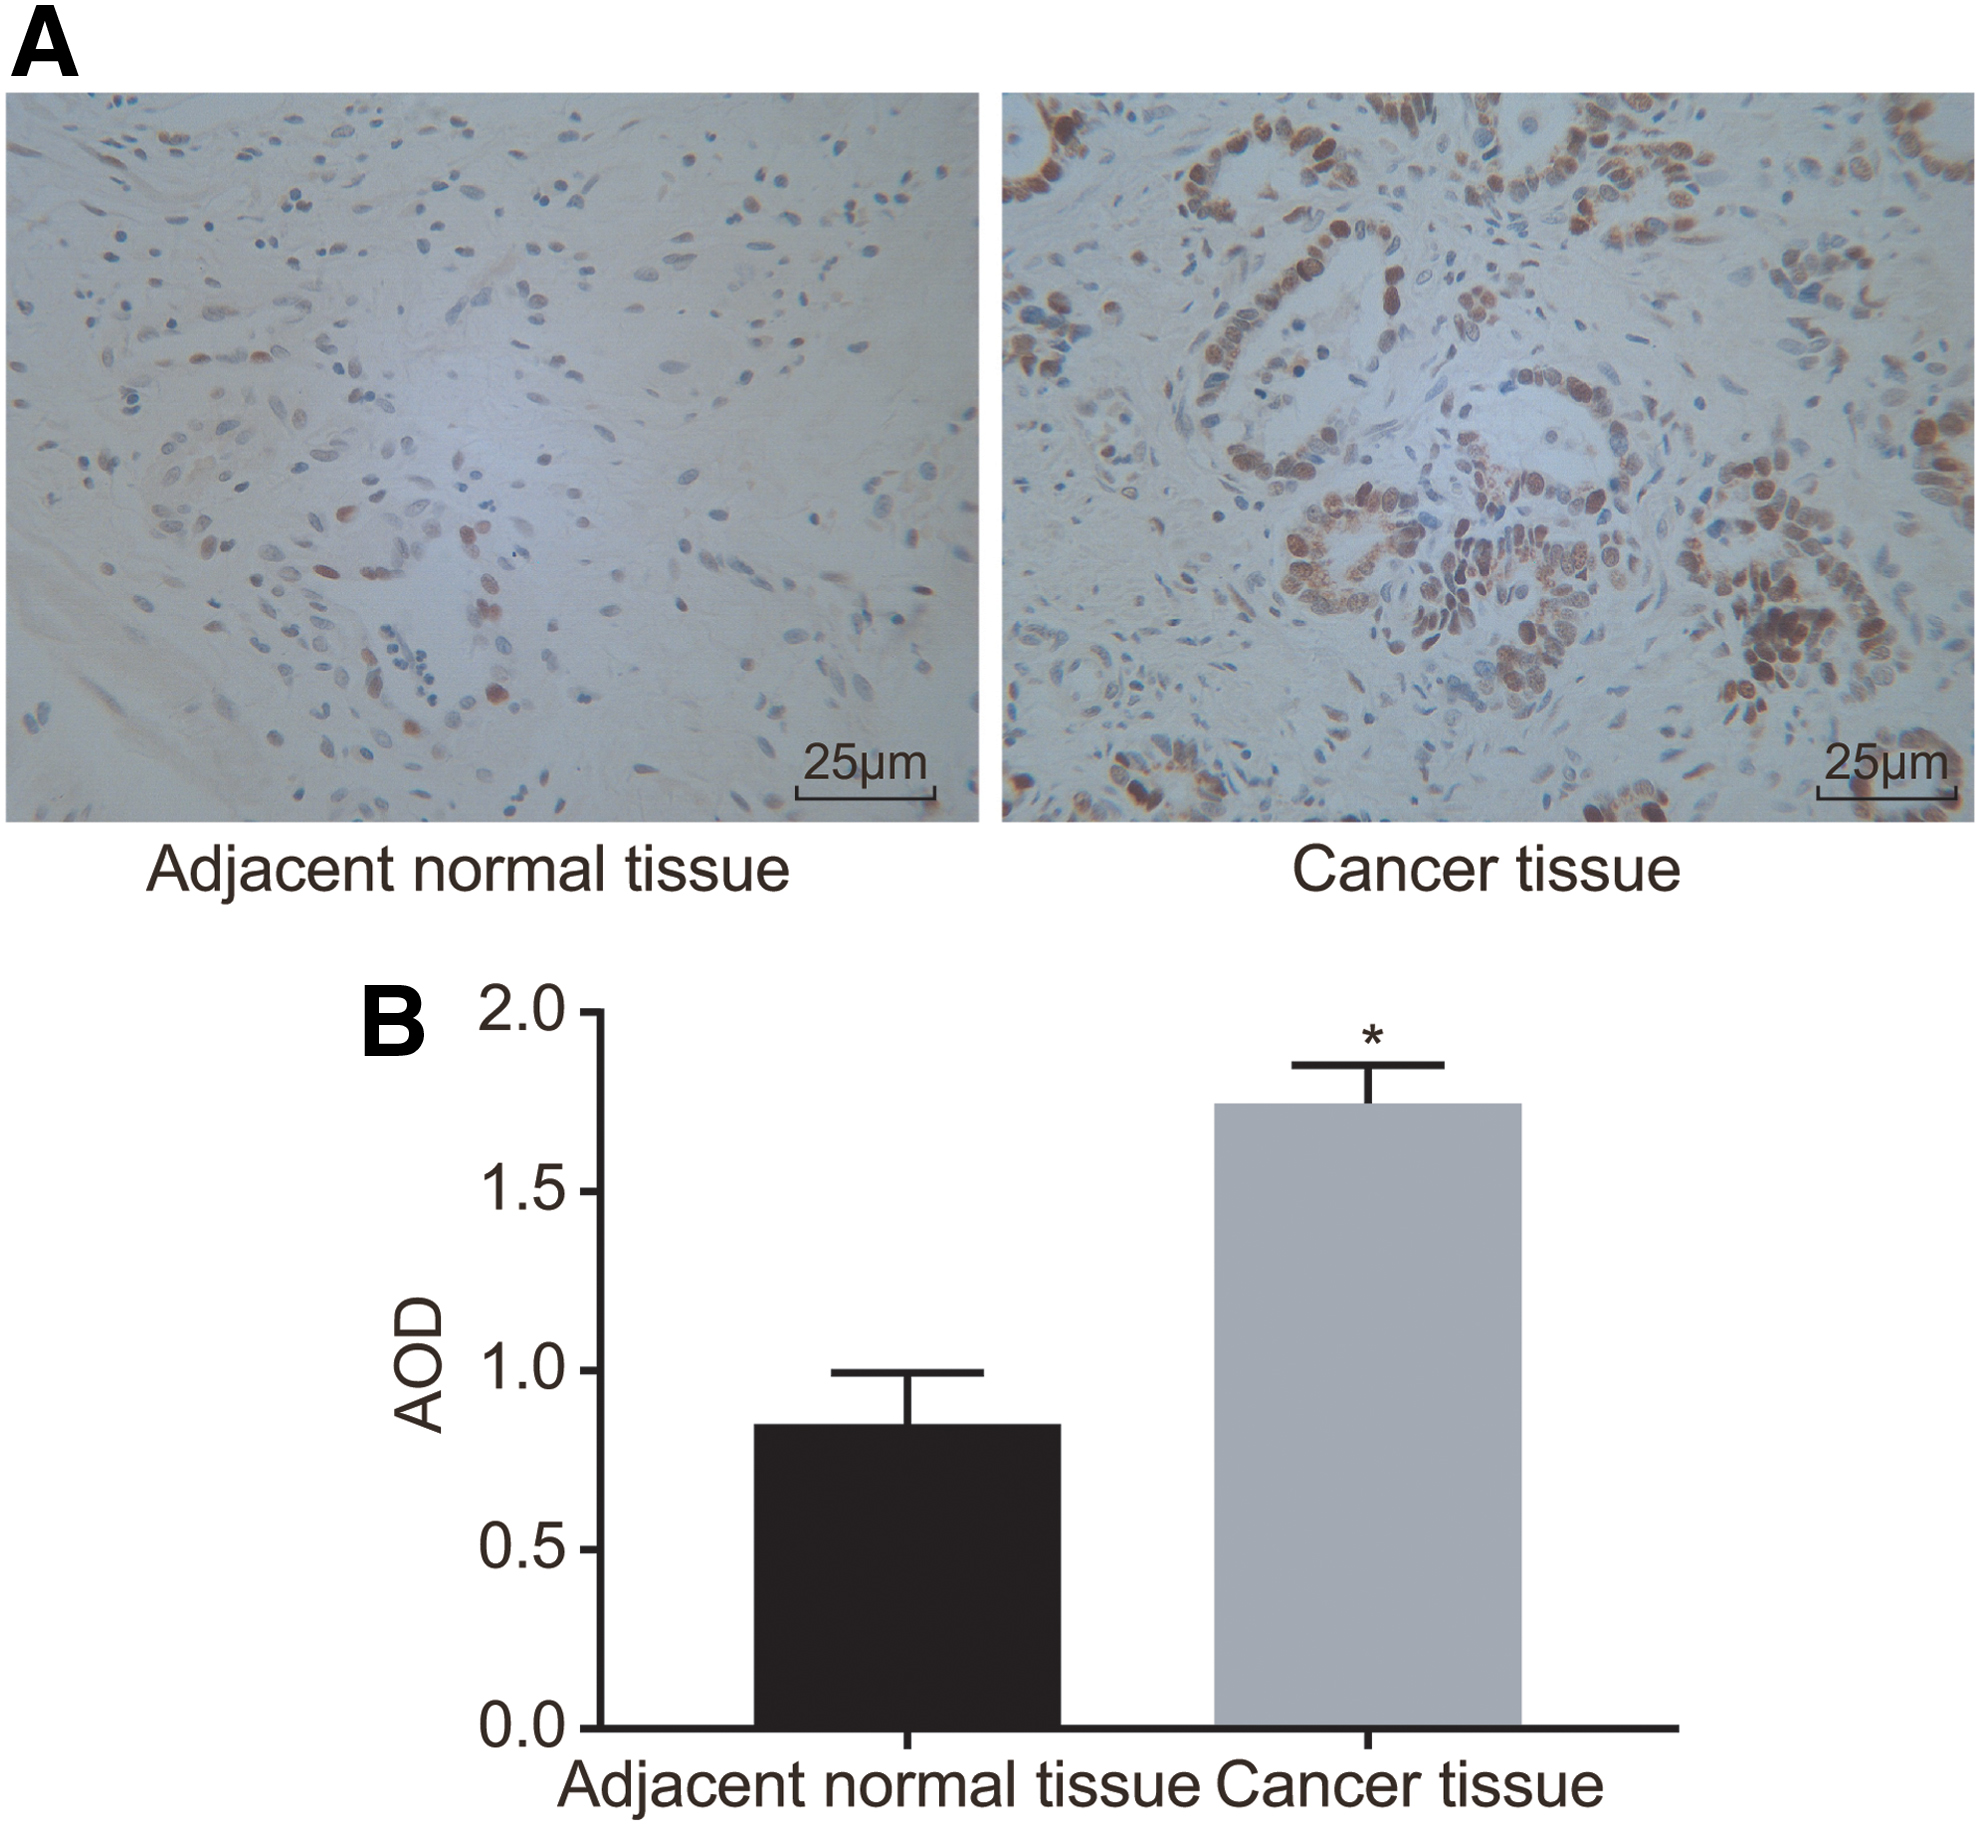
Higher positive expression of MEOX1 protein is found in PC tissues.
LNCaP cell shows the highest mRNA and protein expression of MEOX1 and siRNA-1 puts strongest suppressive effect on MEOX1
RT-qPCR and western blot analysis were employed to examine the mRNA and protein expressions of MEOX1 in PC-3, VCaP, DU145, LNCaP cell lines, and HEUVCs. The results of RT-qPCR and western blot analysis (Fig. 3A–C) showed that the mRNA and protein expression of MEOX1 in PC-3, VCaP, DU145, and LNCaP was higher than that in HEUVCs (all p < 0.05), and was the highest in the LNCaP cell line (all p < 0.05) (GAPDH as an internal reference). Therefore, the LNCaP cell was selected for following experiment. After 48 h of transfection, green fluorescence was observed in the cultured cells using a fluorescence microscope. The results showed that the cell confluence was 90%, and the fluorescence rate was 70% in the siRNA and NC groups, while no green fluorescence was observed in the blank group, indicating that transfection was successful in the siRNA and NC groups (Fig. 3D). Subsequently, the siRNA-1 group was selected for further experimentation due to its best inhibitory effect on MEOX1.
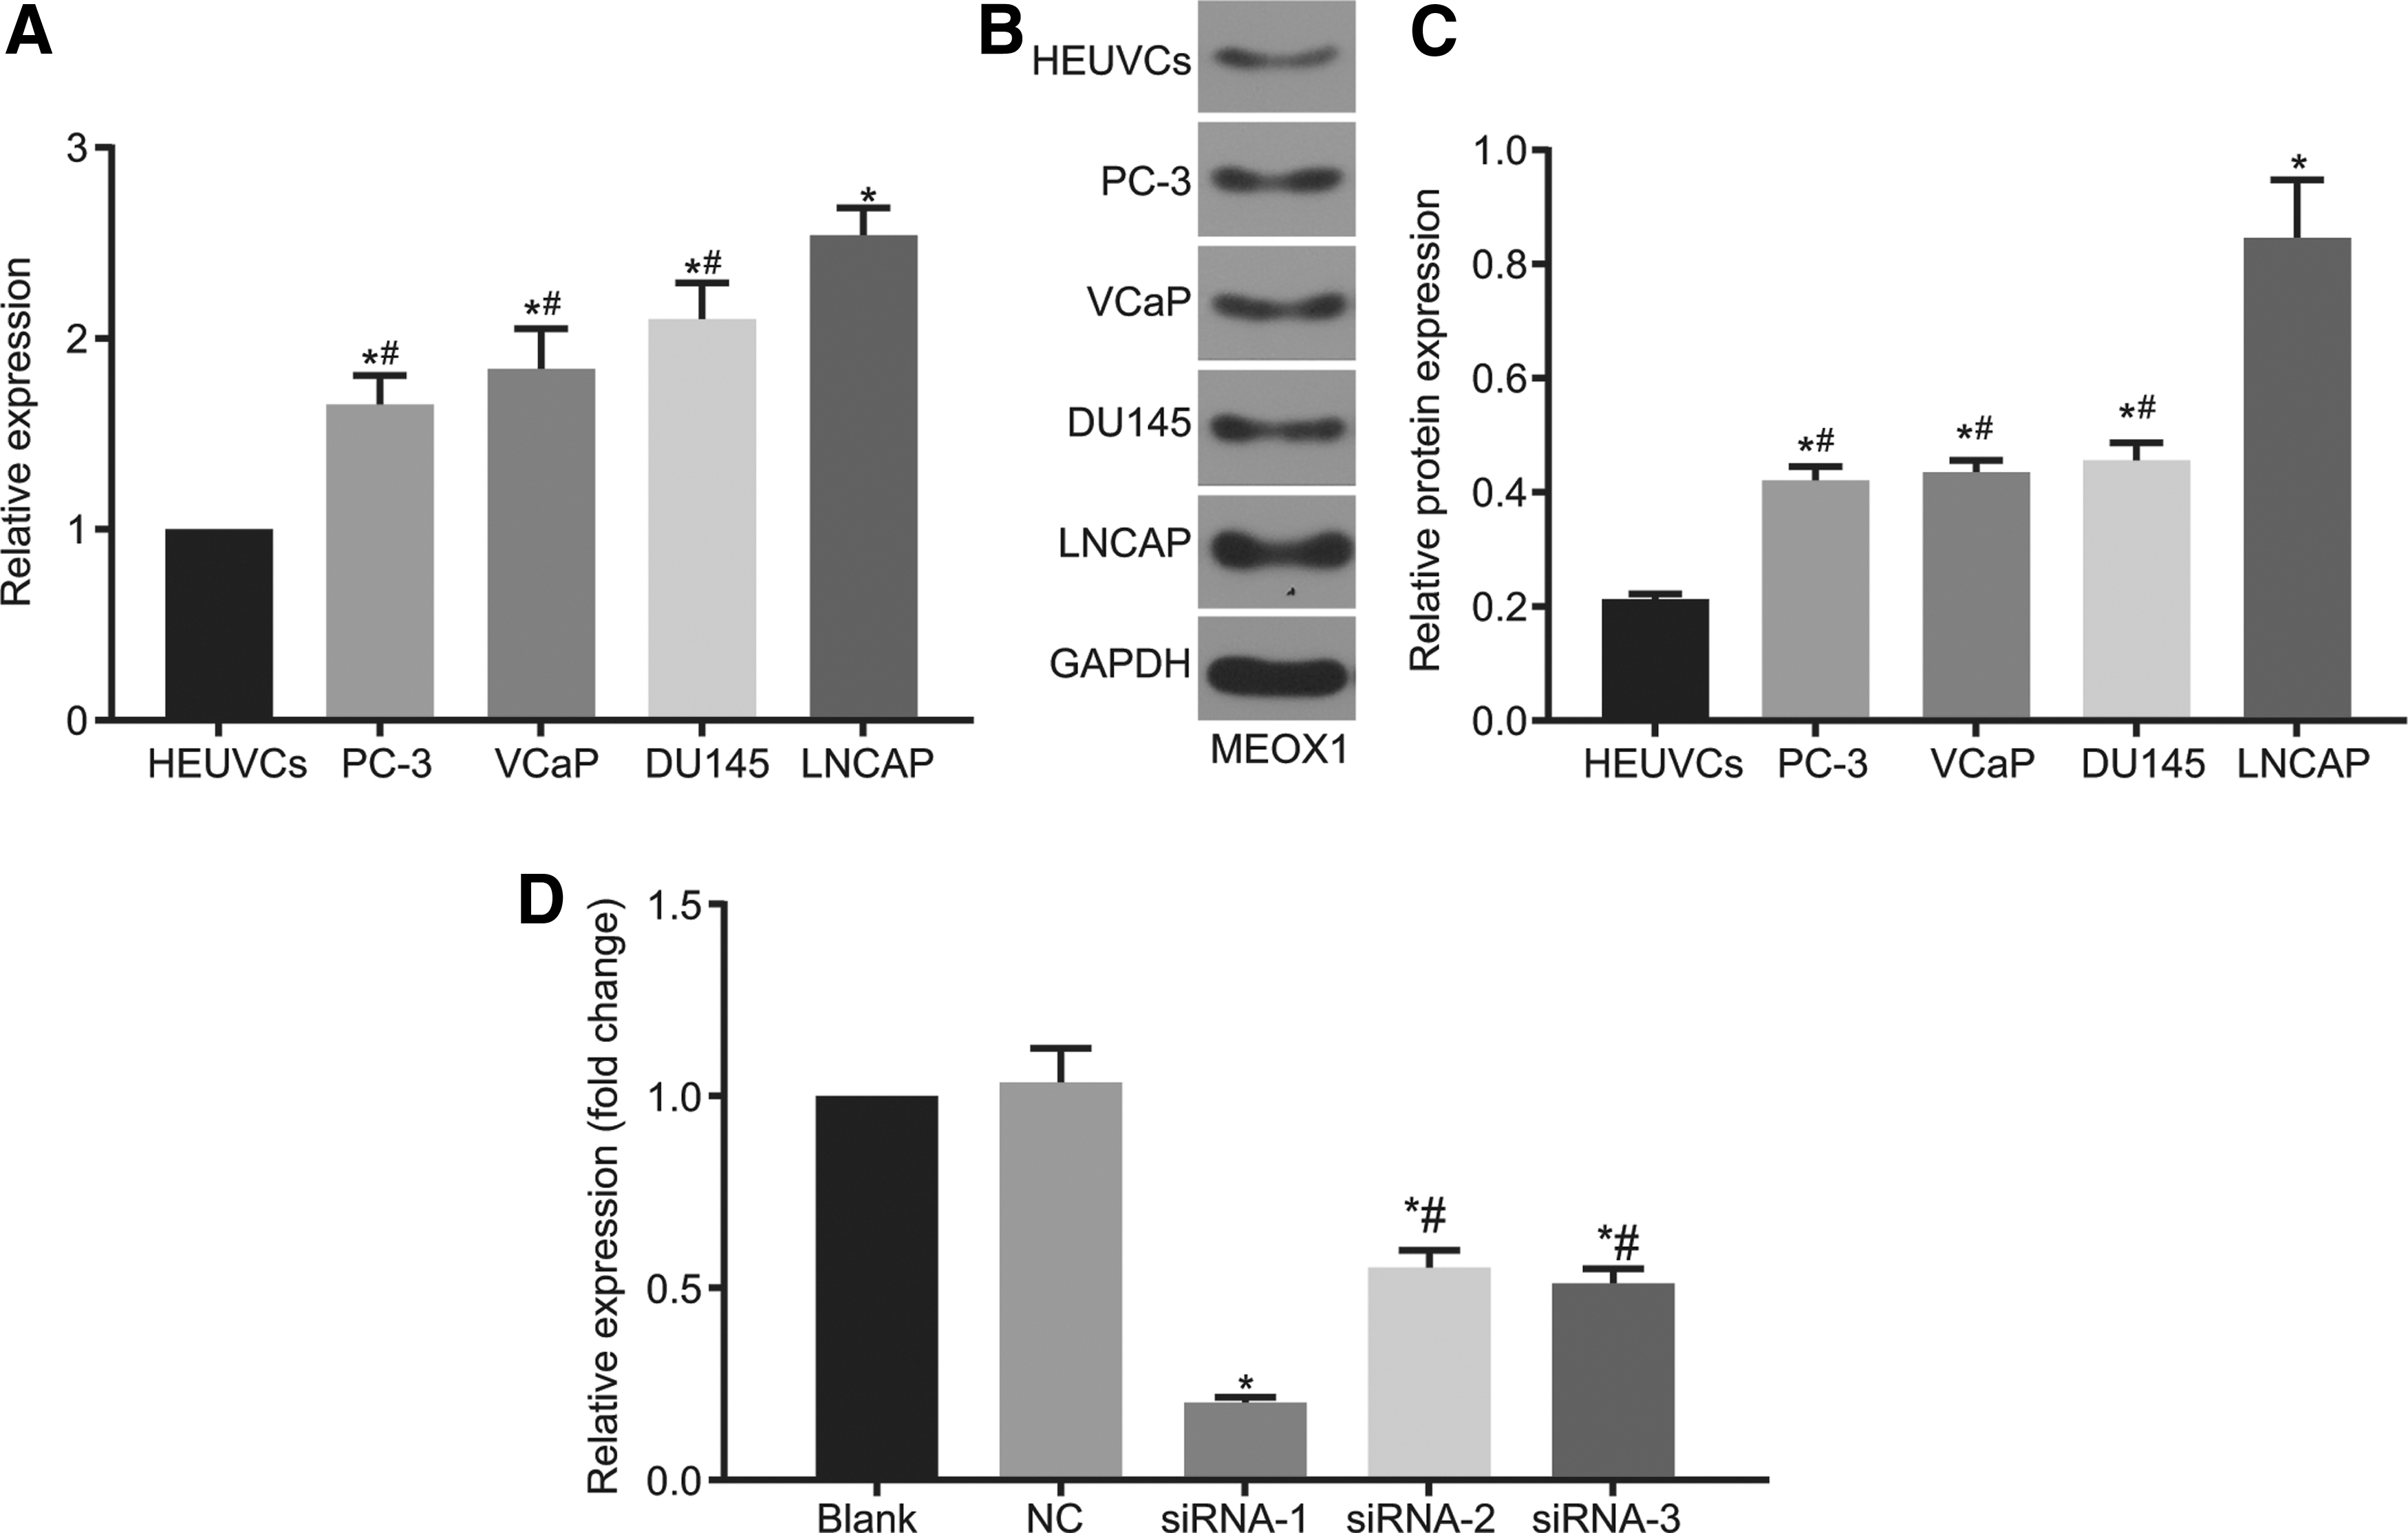
The mRNA and protein expression of MEOX1 expresses highest in the LNCaP cells, and si-RNA-1 exerts the strongest inhibitory effect on MEOX1 mRNA expression.
Suppressed MEOX1 promotes apoptosis of LNCaP cells
RT-qPCR and western blot analysis were employed to detect the effect of mRNA and protein expression of MEOX1 on PC cell apoptosis. RT-qPCR results demonstrated that the mRNA expression of MEOX1 (0.512 ± 0.042) in the siRNA group was significantly decreased when compared with the NC and blank group (both p < 0.05). No significant differences were observed between the NC and blank group (p > 0.05). In addition, the mRNA expression of Bax was found to be higher while that of Bcl-2 was lower in the siRNA group than that in the NC and blank group, indicating a significant difference (p > 0.05). These results suggested that inhibition of the mRNA expression of MEOX1 could inhibit the expression of apoptosis-related factor Bcl-2 while promoting that of Bax and p53 (Fig. 4A). Results of western blot analysis showed that the protein expression of MEOX1 in the siRNA group was significantly decreased when compared with the blank and NC group (GAPDH serving as an internal reference) (both p < 0.05), while no significant differences were detected between the blank and NC group (p > 0.05). The protein expression of Bax and p53 was found to be higher while that of Bcl-2 was lower in the siRNA group than that in the NC and blank group, suggesting a significant difference (p < 0.05). These aforementioned results indicated that inhibiting the protein expression of MEOX1 could improve the apoptosis of LNCaP cells (Fig. 4B).

Suppressed MEOX1 promotes the apoptosis of LNCaP cells.
MEOX1 gene silencing inhibits proliferation and colony formation of LNCaP cells
A CCK-8 assay was employed to detect cell proliferation, and the results showed that the OD values in the siRNA group were significantly lower than those in the NC and blank groups at the 48 and 72 h time intervals after transfection, indicating that cell growth in the siRNA group was significantly decreased when compared with the NC and blank groups (all p < 0.05). There were no significant differences in OD values between the NC and blank group at any time intervals (all p > 0.05). Gradually, cell numbers in each group were found to be elevated correspondently (Fig. 5A). The aforementioned results indicated that silencing of MEOX1 inhibited proliferation of LNCaP cells. Additionally, the results of colony formation assay showed that compared with the NC and blank groups, the colony formation rate in the siRNA group was significantly reduced (both p < 0.05), while no significant differences were found between the NC and blank groups (p > 0.05) (Fig. 5B, C). The results suggested that silencing of the MEOX1 gene exerted an inhibitory effect on colony formation of LNCaP cells.
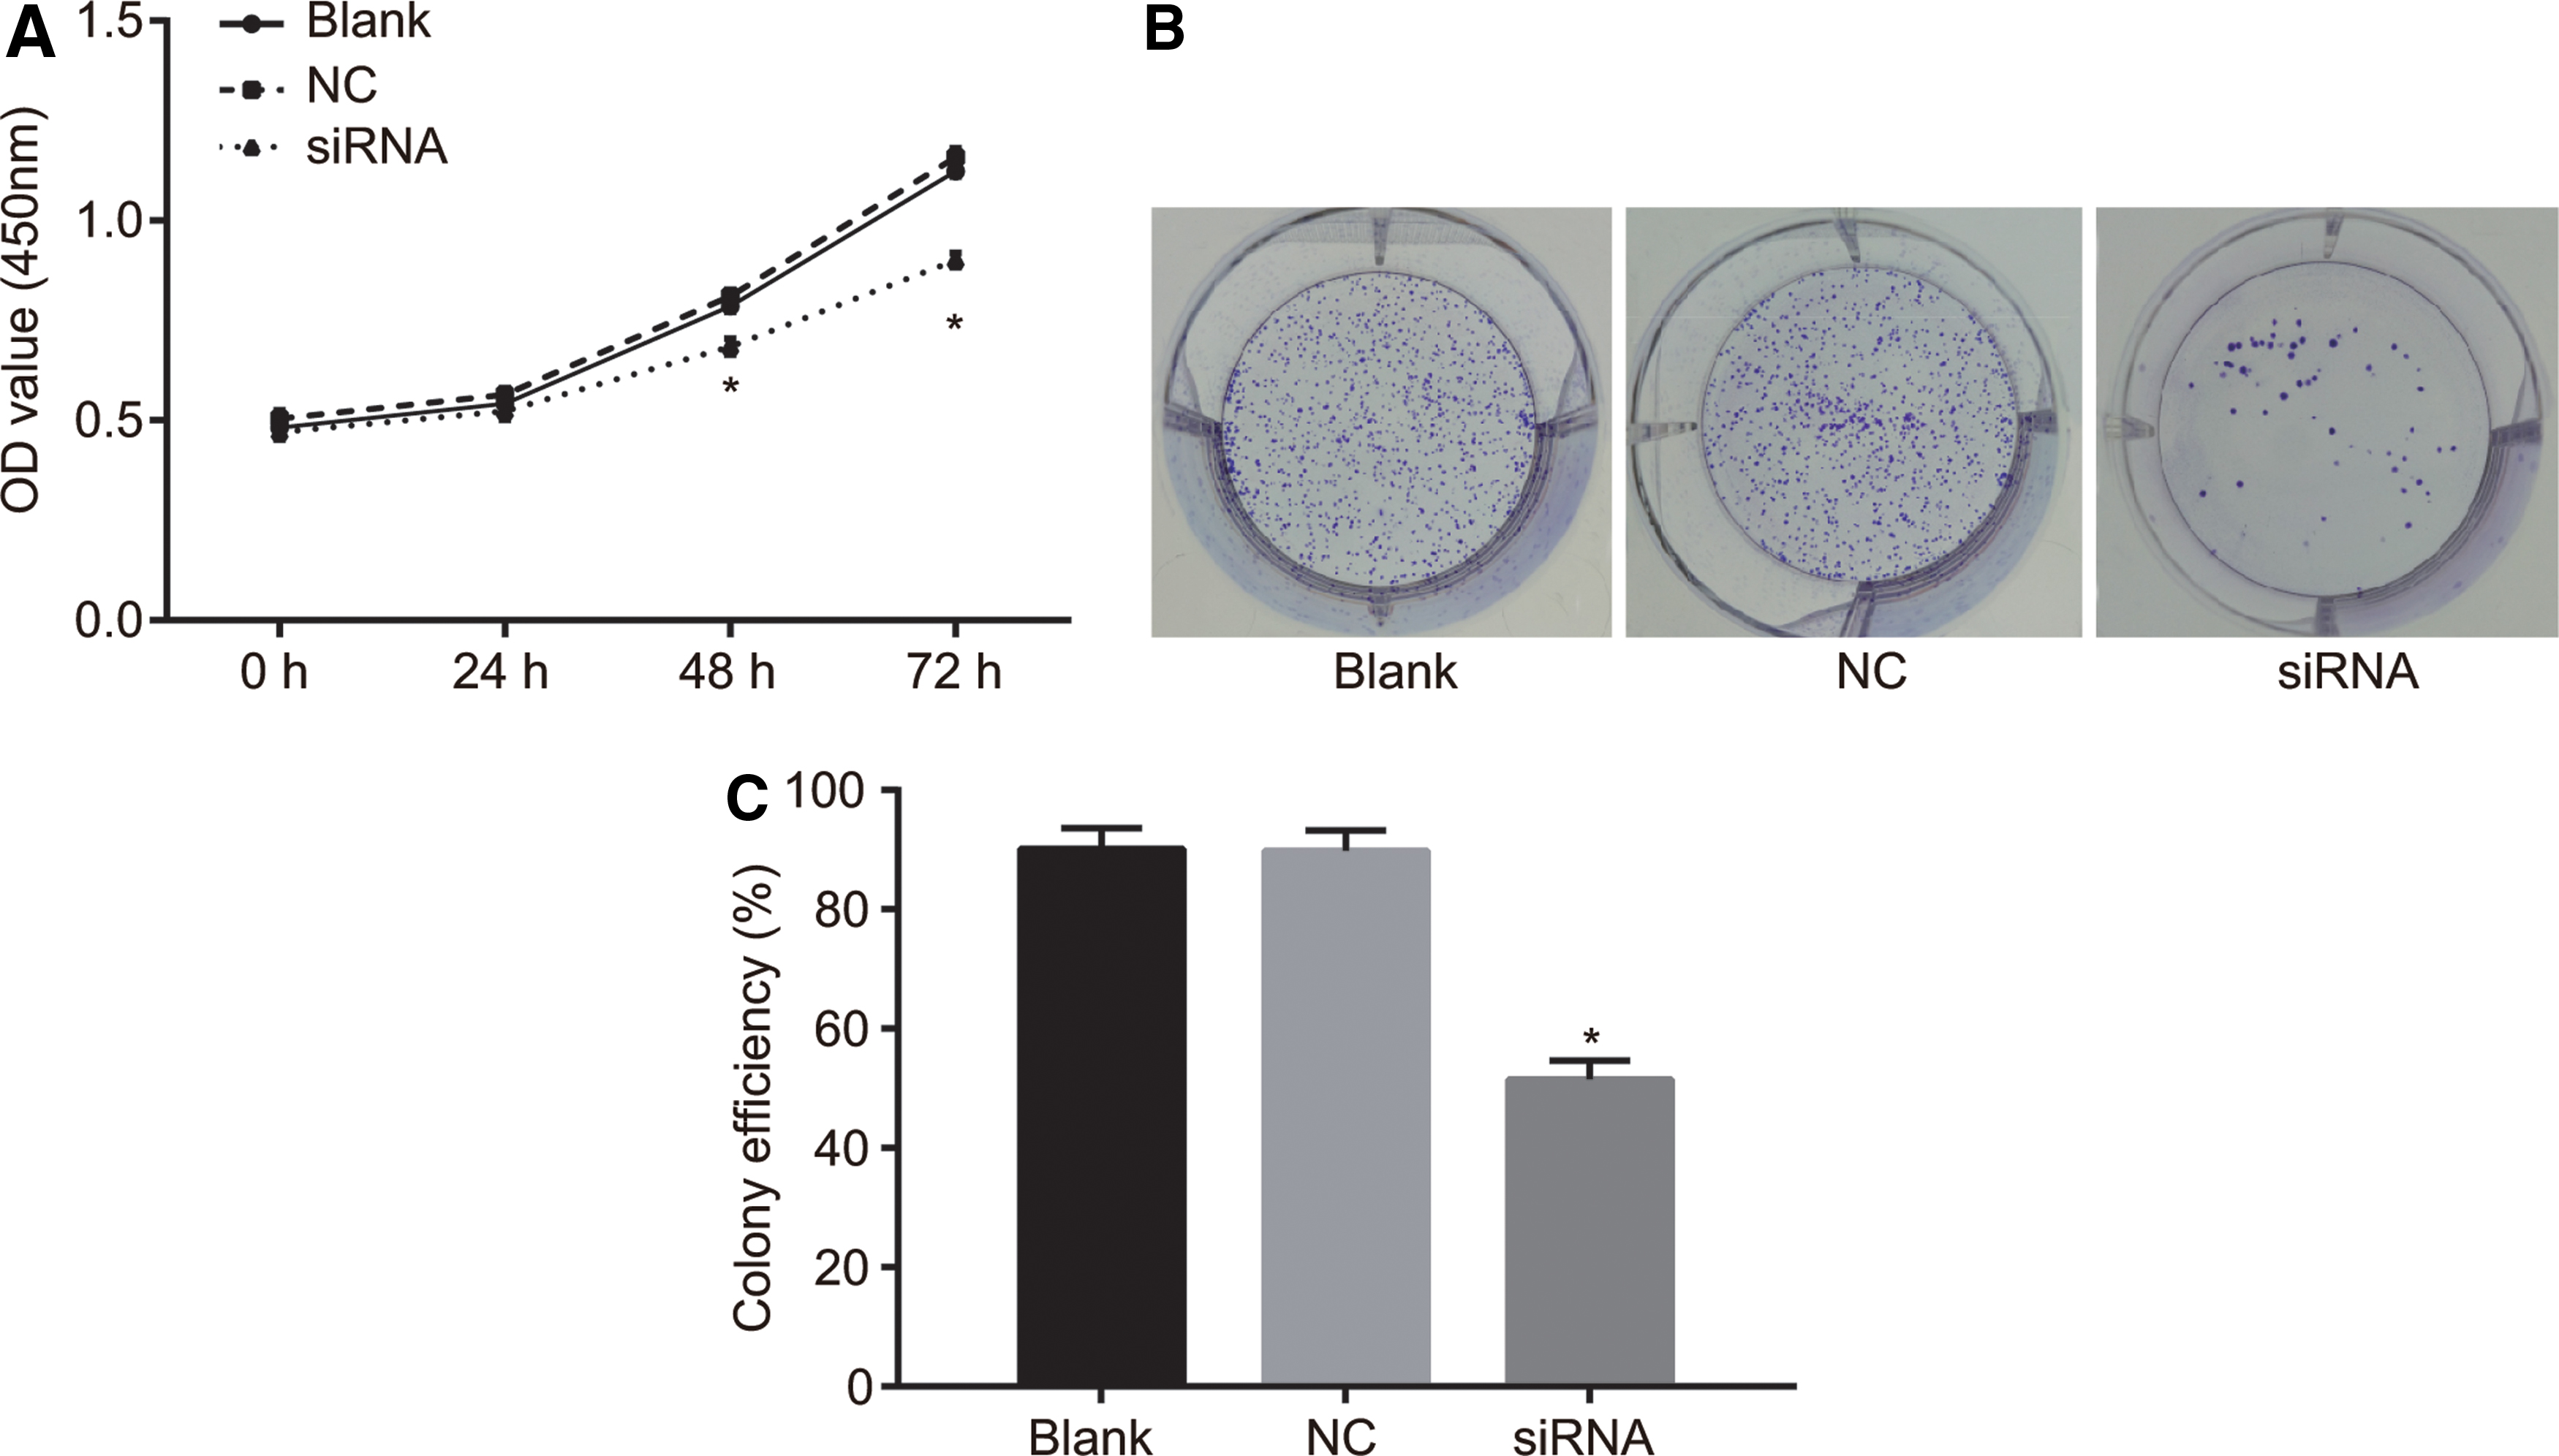
MEOX1 gene silencing inhibits proliferation and colony formation of LNCaP cells.
MEOX1 gene silencing inhibits migration and invasion of LNCaP cells
Scratch test and Transwell assay were applied to examine the migration and invasion of cells. Scratch test results demonstrated that at the 24 h interval, the rate of scratch wound healing in the siRNA group was found to be significantly lower than that in the blank group (both p < 0.05), but no significant differences were found between the NC and blank groups (p > 0.05) (Fig. 6A), indicating that silencing of MEOX1 could inhibit the migration of LNCaP cells. The Transwell assay results showed that the number of invasive cells was lower than that in the blank group (p < 0.05) while there were no significant differences in the number of invasive cells in the blank and NC groups (p > 0.05) (Fig. 6B), indicating that MEOX1 gene silencing could inhibit the invasion of LNCaP cells.
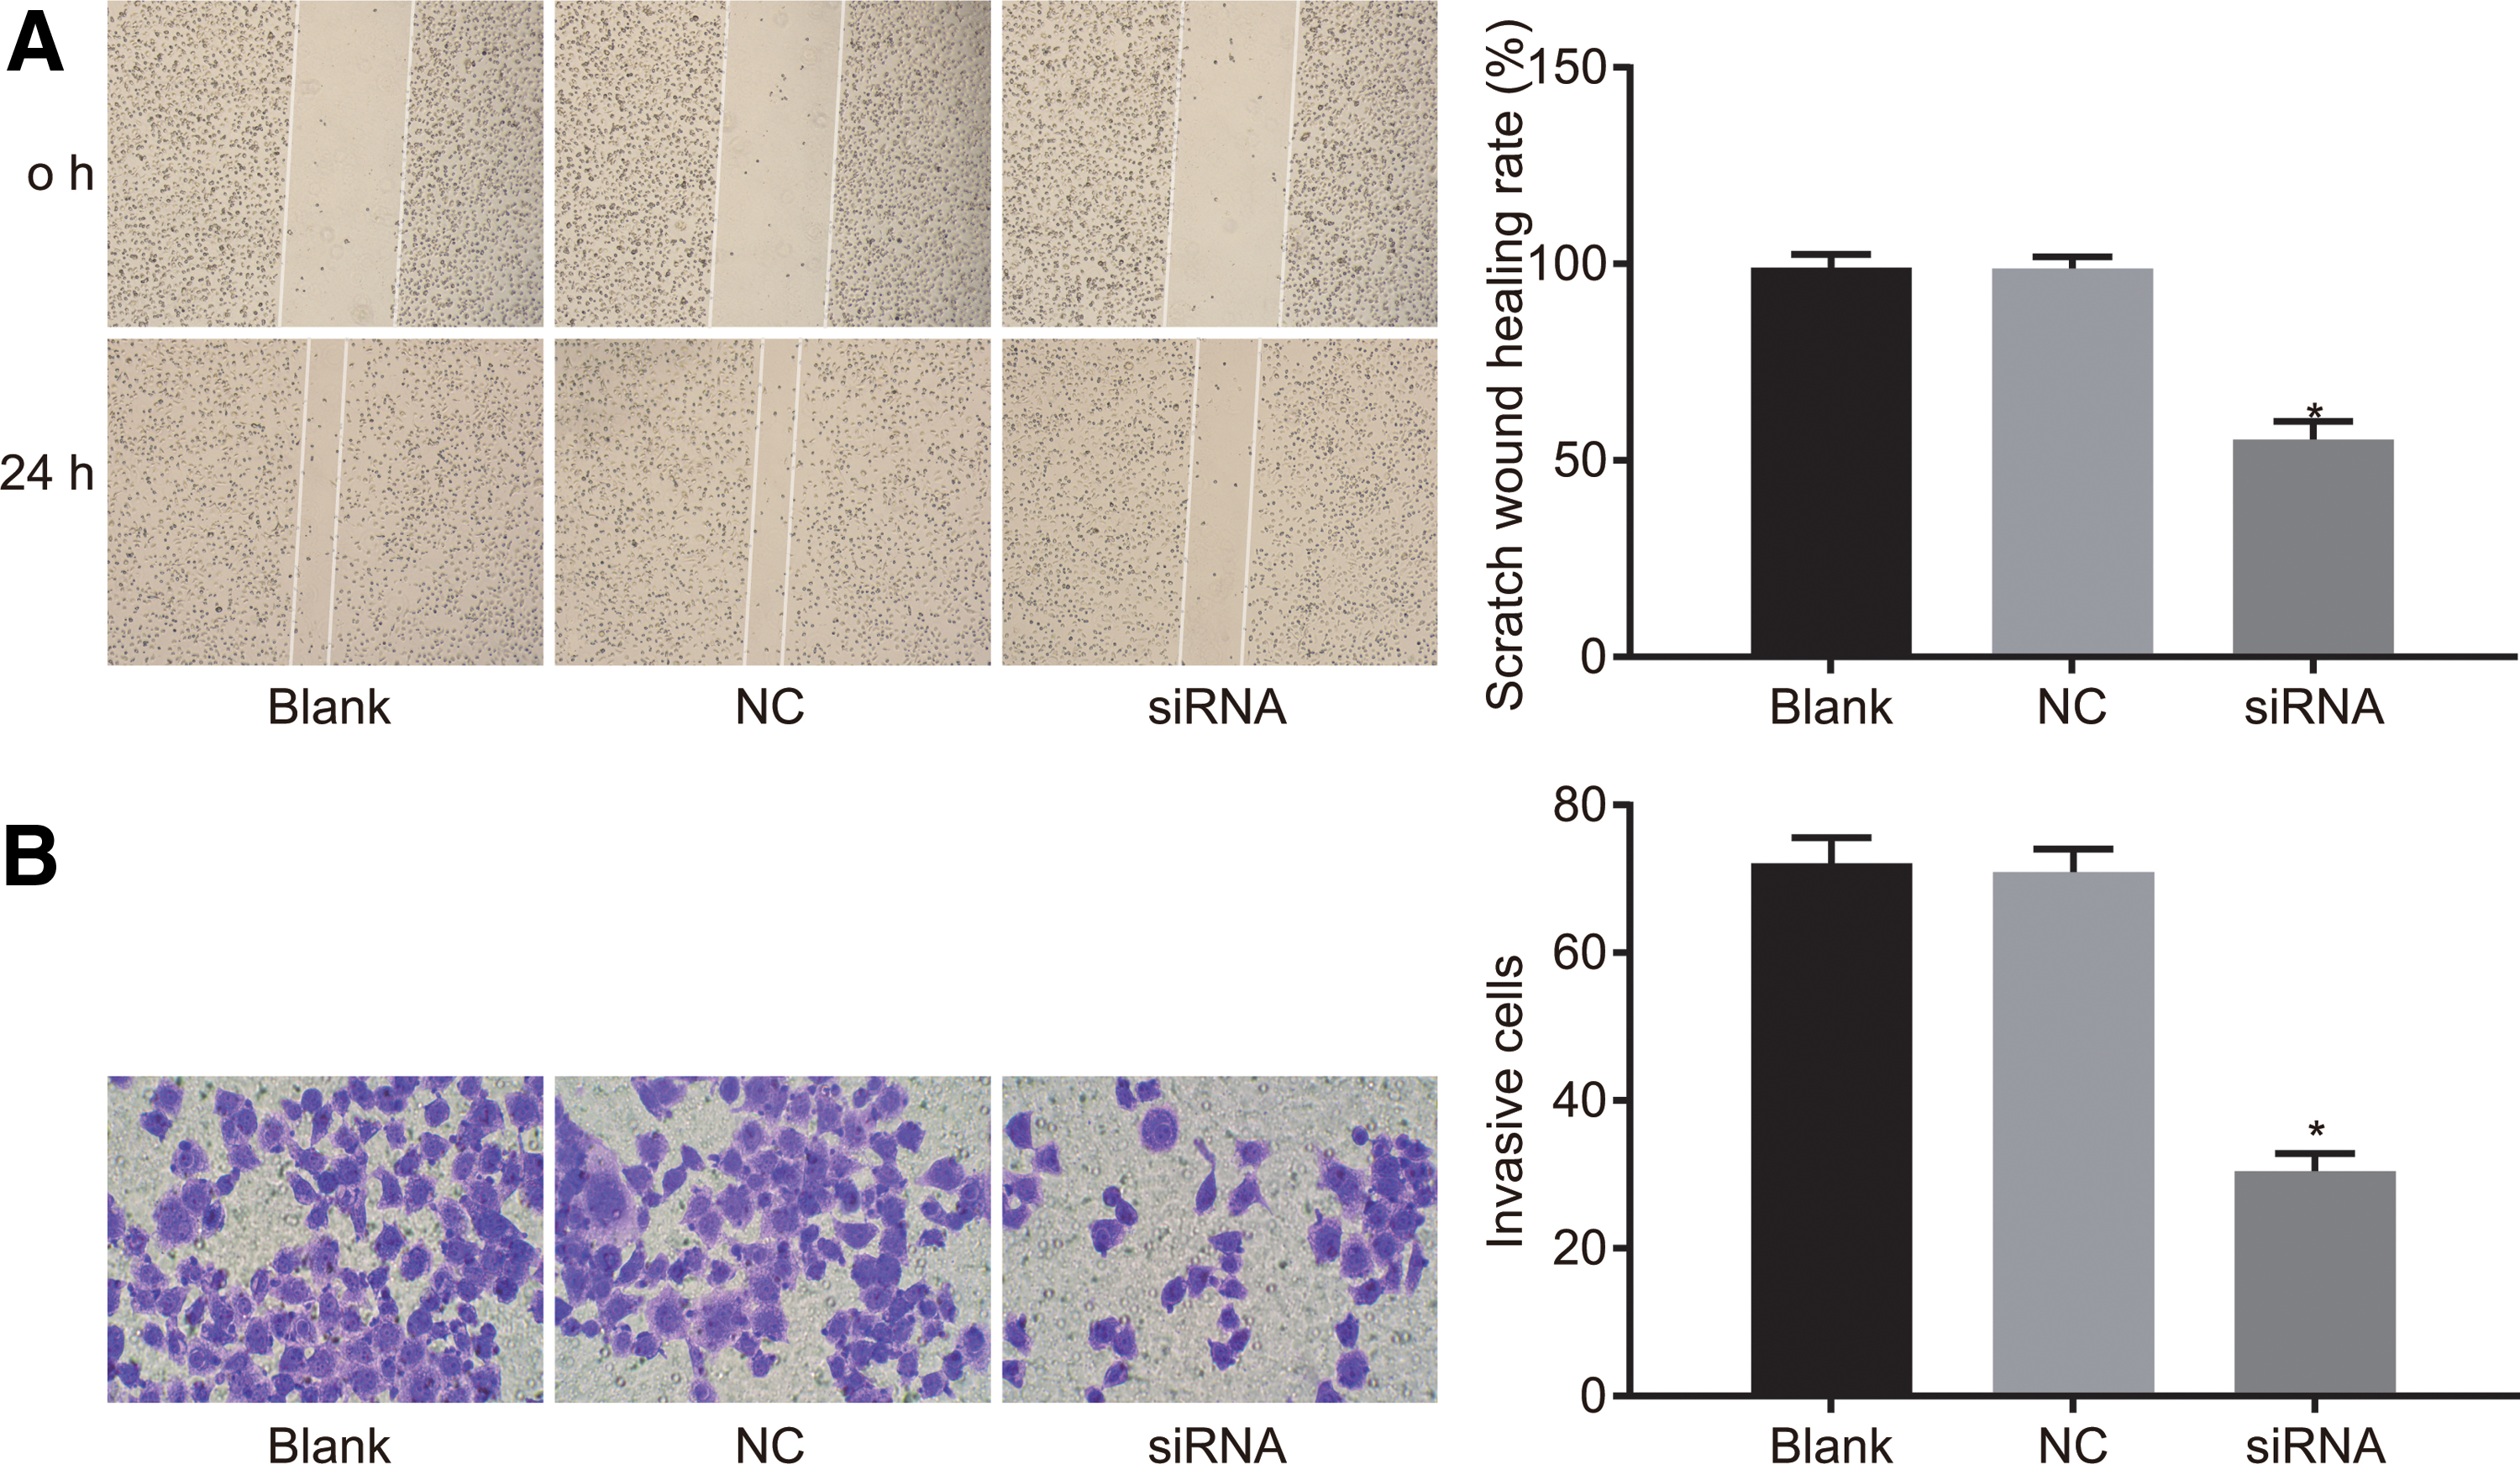
MEOX1 gene silencing suppresses LNCaP cell migration and invasion.
MEOX1 gene silencing arrests cell cycle in LNCaP cells and promotes apoptosis of LNCaP cells
Flow cytometry and Annexin V-FITC/PI staining were employed to examine cell cycle and cell apoptosis, respectively, and the results showed that the proportion of cells in the G0/G1 phase was increased while the proportions of cells in the S phase and G2/M phase were significantly decreased in the siRNA group in comparison to those in the NC and blank groups (Fig. 7A) (all p < 0.05). The results demonstrated that silencing of MEOX1 could arrest LNCaP cells in the G0/G1 phase, leading to shortening of the S and G2/M phases. The Annexin V-FITC/PI staining results showed that the apoptosis rate of LNCaP cells transfected with MEOX1 siRNA in the siRNA group was significantly higher than that in the NC and blank groups (both p < 0.05), but no significant differences were found in the blank and NC groups (p > 0.05), suggesting that MEOX1 gene silencing significantly increased the apoptosis of LNCaP cells (Fig. 7B and Table 2).
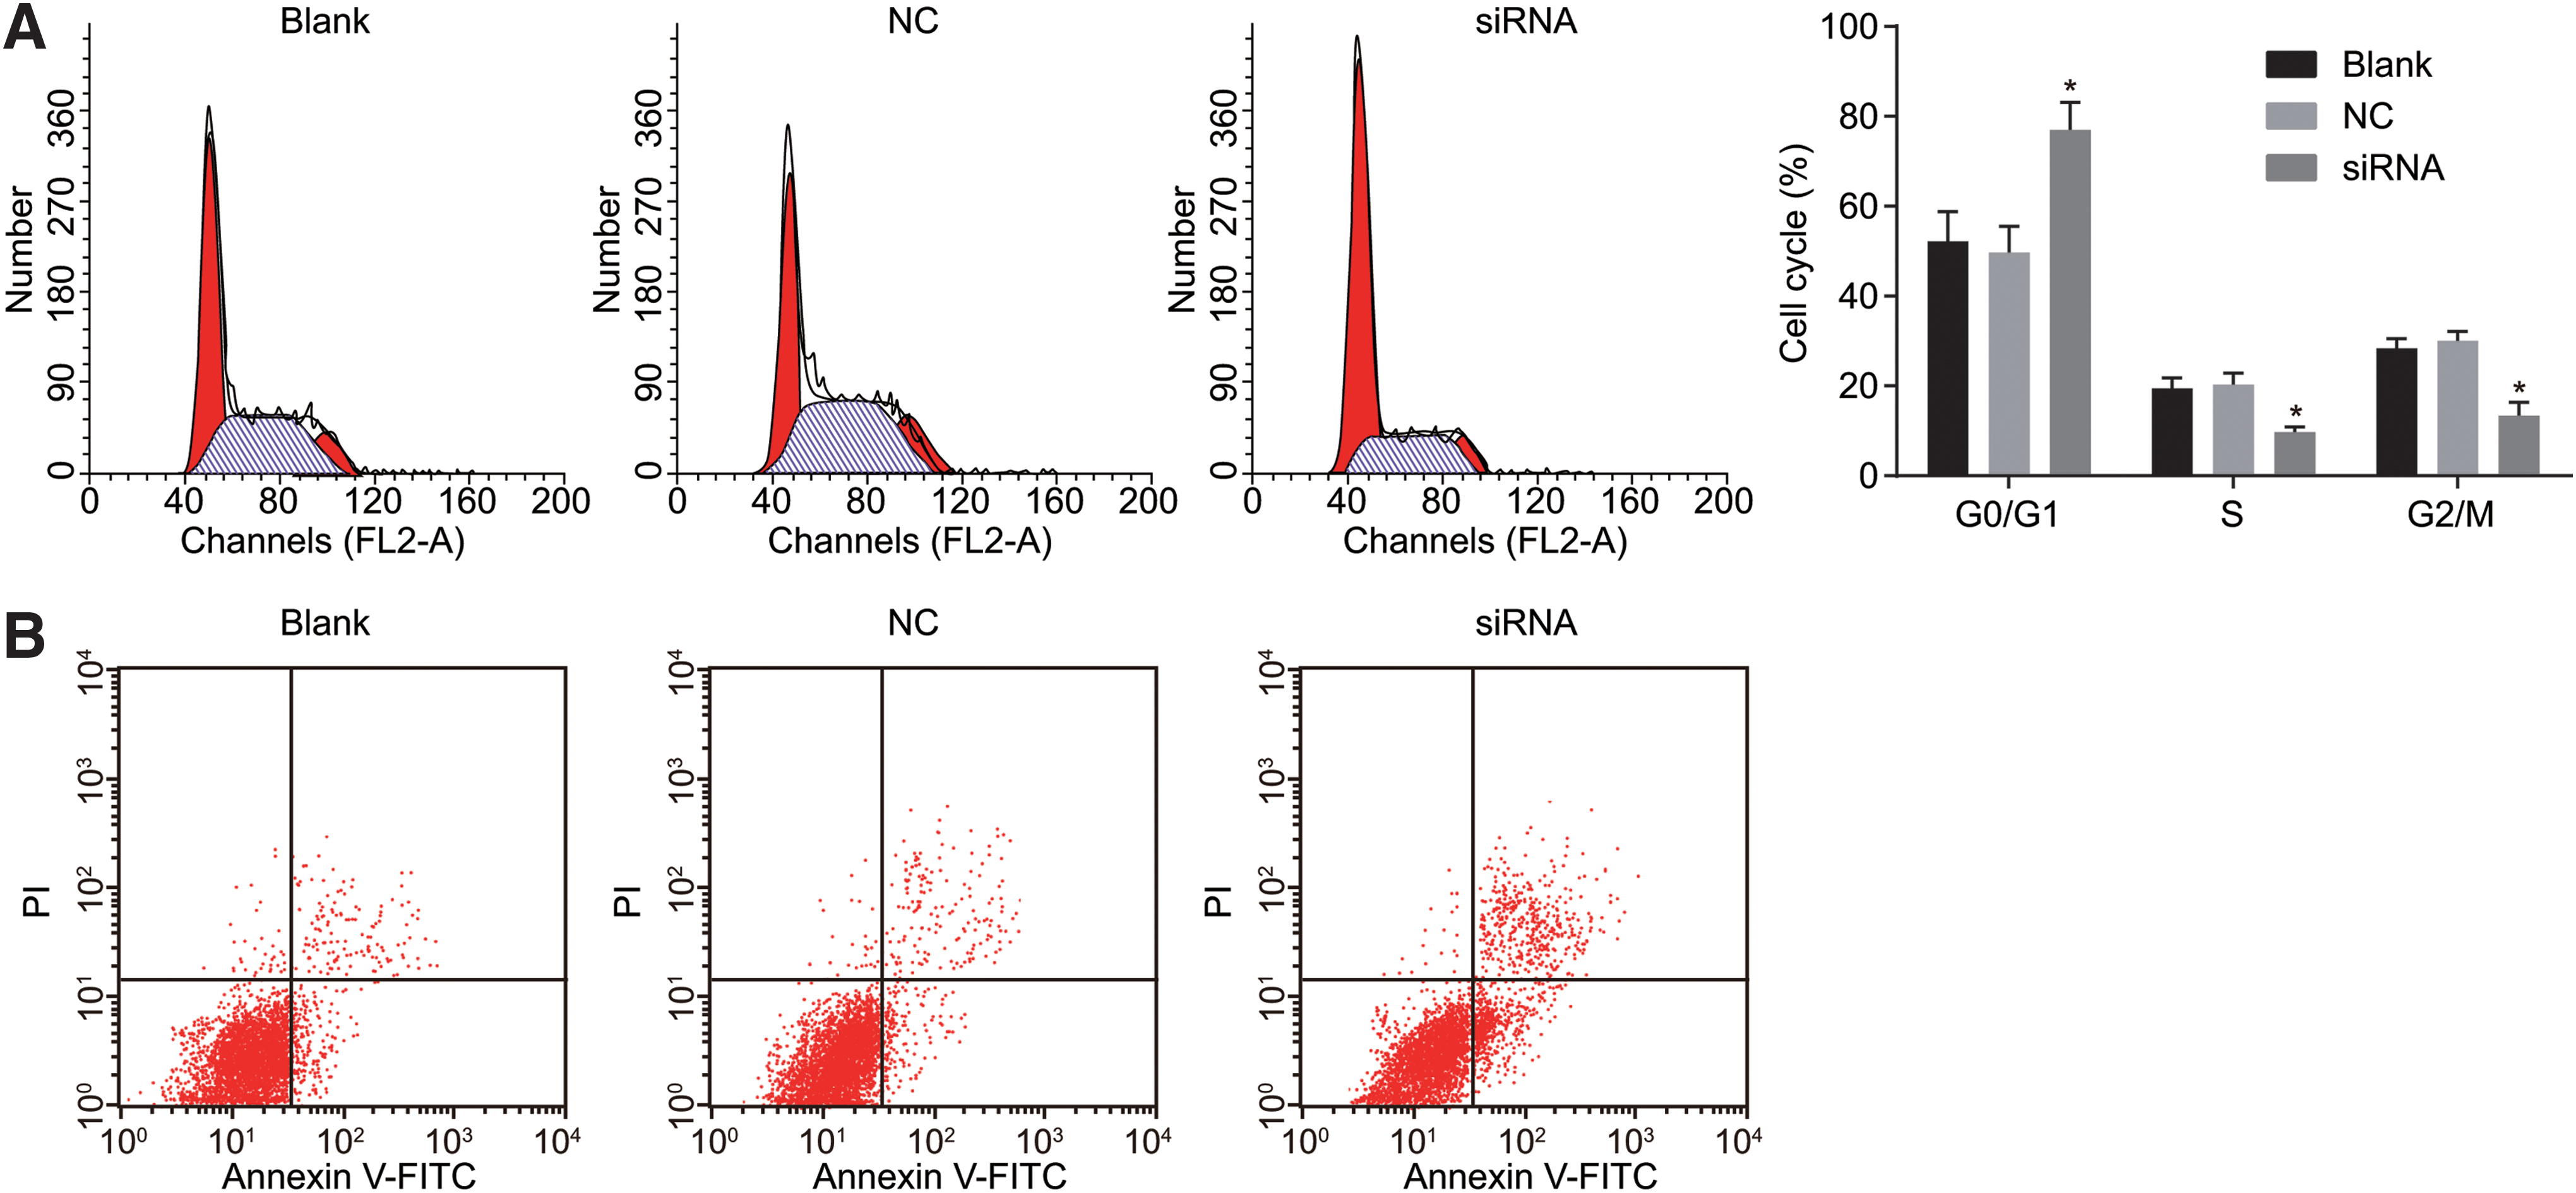
MEOX1 gene silencing increases apoptosis of LNCaP cells.
Cell Apoptosis Rate Is Decreased in the siRNA Group
p < 0.05 compared with the blank and NC group.
NC, negative control.
MEOX1 gene silencing inhibits cell proliferation and decreases tumorigenic ability of LNCaP cell
The experiment of xenograft tumor in nude mice was performed to observe the xenograft tumor growth in nude mice. As shown in Figure 8A, 30 d after model establishment of xenograft tumor in nude mice, the results of comparing the tumor growth curves and weighing the tumor tissues of nude mice in the three groups revealed that the tumor growth rate was reduced in the siRNA group compared with that in the NC and blank groups (p < 0.05), and the weight of tumor tissue in the siRNA group (0.842 ± 0.123 g) was lower than that in the blank (1.465 ± 0.164 g) and NC group (1.501 ± 0.172 g) (p < 0.05). These results demonstrated that MEOX1 gene silencing inhibited cell proliferation in nude mice and decreased the tumorigenic ability of LNCaP cells.

MEOX1 gene silencing inhibits cell proliferation in nude mice and reduces the tumorigenic ability of LNCaP cells.
The results of determining PCNA levels in the three groups (Fig. 8B) showed that the PCNA level was lower in the siRNA group than that in the NC and blank groups (p < 0.05), demonstrating that MEOX1 gene silencing suppressed cell proliferation in nude mice and reduced the tumorigenic ability of LNCaP cells.
Discussion
Patients with clinically localized PC who underwent radical prostatectomy or external radiotherapy usually suffered from the side effects of these treatments. 26 The current treatment strategies for PC deracinate most cells within a tumor, however, the majority of patients developed into an androgen-independent disease, which still remains incurable through existing strategies. 27 This study aimed to elucidate the effects of MEOX1 silencing on the biological behaviors of LNCaP cells in PC. Our results demonstrated that MEOX1 silencing can significantly suppress cell proliferation, colony formation and invasion, and enhance apoptosis in PC cells.
First, microarray assay in addition to biopsy examination identified that MEOX1 was highly expressed in PC tissues. In addition, the high expression of MEOX1 was predicted to correlate with the tumorigenesis of PC. Furthermore, MEOX1 was previously reported to exhibit a crucial role in relation to the pleiotropy of breast cancer. 28 RT-qPCR and western blotting showed that the mRNA and protein expressions of MEOX1 were decreased in LNCaP cells transfected with MEOX1-siRNA, indicating that MEOX1-siRNA can effectively inhibit the expression of MEOX1. RNA interference is a known powerful method to induce gene silencing by two-stranded RNA, and inhibits gene expression by blocking transcription and translation of the target gene. 29 RNA interference with specificity and high performance, as a new technology of gene silence is widely applied to life science, medicine science, and medicine research with immense potential and provides a new way for gene therapy of diseases, even malignant tumors. 30 To verify whether MEOX1 silencing could affect the progression of PC, cell and animal experiments were conducted with intervention of siRNA.
In addition, various biological behaviors including proliferation, migration and invasion, cell cycle, and apoptosis were evaluated in LNCaP cells treated with MEOX1-siRNA. Furthermore, this study demonstrated that silencing of MEOX1 inhibited the proliferation, migration and invasion, induced cell cycle arrest at the G0/G1 phase, and promoted apoptosis of LNCaP cells. Interestingly, MEOX1 was confirmed by siRNA knockdown and small molecule inhibition as one of the key molecular targets to regulate the proliferation of the stem cells and mesenchymal-like cells in breast cancer. 20 Similarly, MOX-1, an alias of MEOX1, was known to exert a significant role on the PAX/EYA pathway. 31 In addition, the PAX pathway was proved to exert a supporting effect on sensory hair cell proliferation. 32 A previous reported that either of the expression of MEOX homeodomain transcription factors increased, resulting in cell cycle arrest and endothelial cell senescence, endothelial cell dysfunction. 16 Moreover, MOX-1 and its close homolog Meox2 proteins were proven to bind directly to Pax1 and Pax 3 proteins, 31 indicating a relationship between MOX and Pax. Additionally, PAX3 is a member of the Pax family of transcription factors, regulating cell proliferation, survival, migration, and cytogeny during embryonic development. 33 After overexpression of Pax-3 was observed, a majority of cells underwent apoptosis, 34 indicating that Pax-3 could induce cell apoptosis. The current study also demonstrated a reduction in expression of Bcl-2 but an increase in the expression of p53 and Bax in the event that MEOX1 was silenced in LNCaP cells. A previous study reported that migration and invasion were the premise of the invasive and destructive growth patterns of malignant gliomas. 35 Finally, in vivo experimentation further confirmed that the silencing of MEOX1 suppressed the proliferation of LNCaP cells in nude mice. From the aforementioned evidences, it can be inferred that MEOX1 gene silencing conferred a suppressive effect in relation to PC progression. Despite the great progresses made in elucidating the role of MEOX1 in various tumors, the molecular mechanism underlying the effect of MEOX1 in PC cells remains to be unclear; thus the underlying potential involvement of Pax-3 in the regulation effect of MEOX1 on PC would be a future topic.
In conclusion, results of this study showed that silencing of MEOX1 can inhibit proliferation and induce apoptosis of LNCaP cells in vitro, and restrain tumor growth in vivo, thus preventing development of PC, which provides experimental basis and potent targets for treating PC (Fig. 9). However, further clinical research with large sample sizes and cell experimentation in different types of PC cell lines should be conducted in the future to verify our results, and explore the underlying mechanism of the role of MEOX1 in PC progression. Nevertheless, this study makes great progress within the scope of MEOX1 depletion as a tumor suppressor in both cell and animal experiments, providing a theoretical basis for the development of clinical targeted therapy in PC.
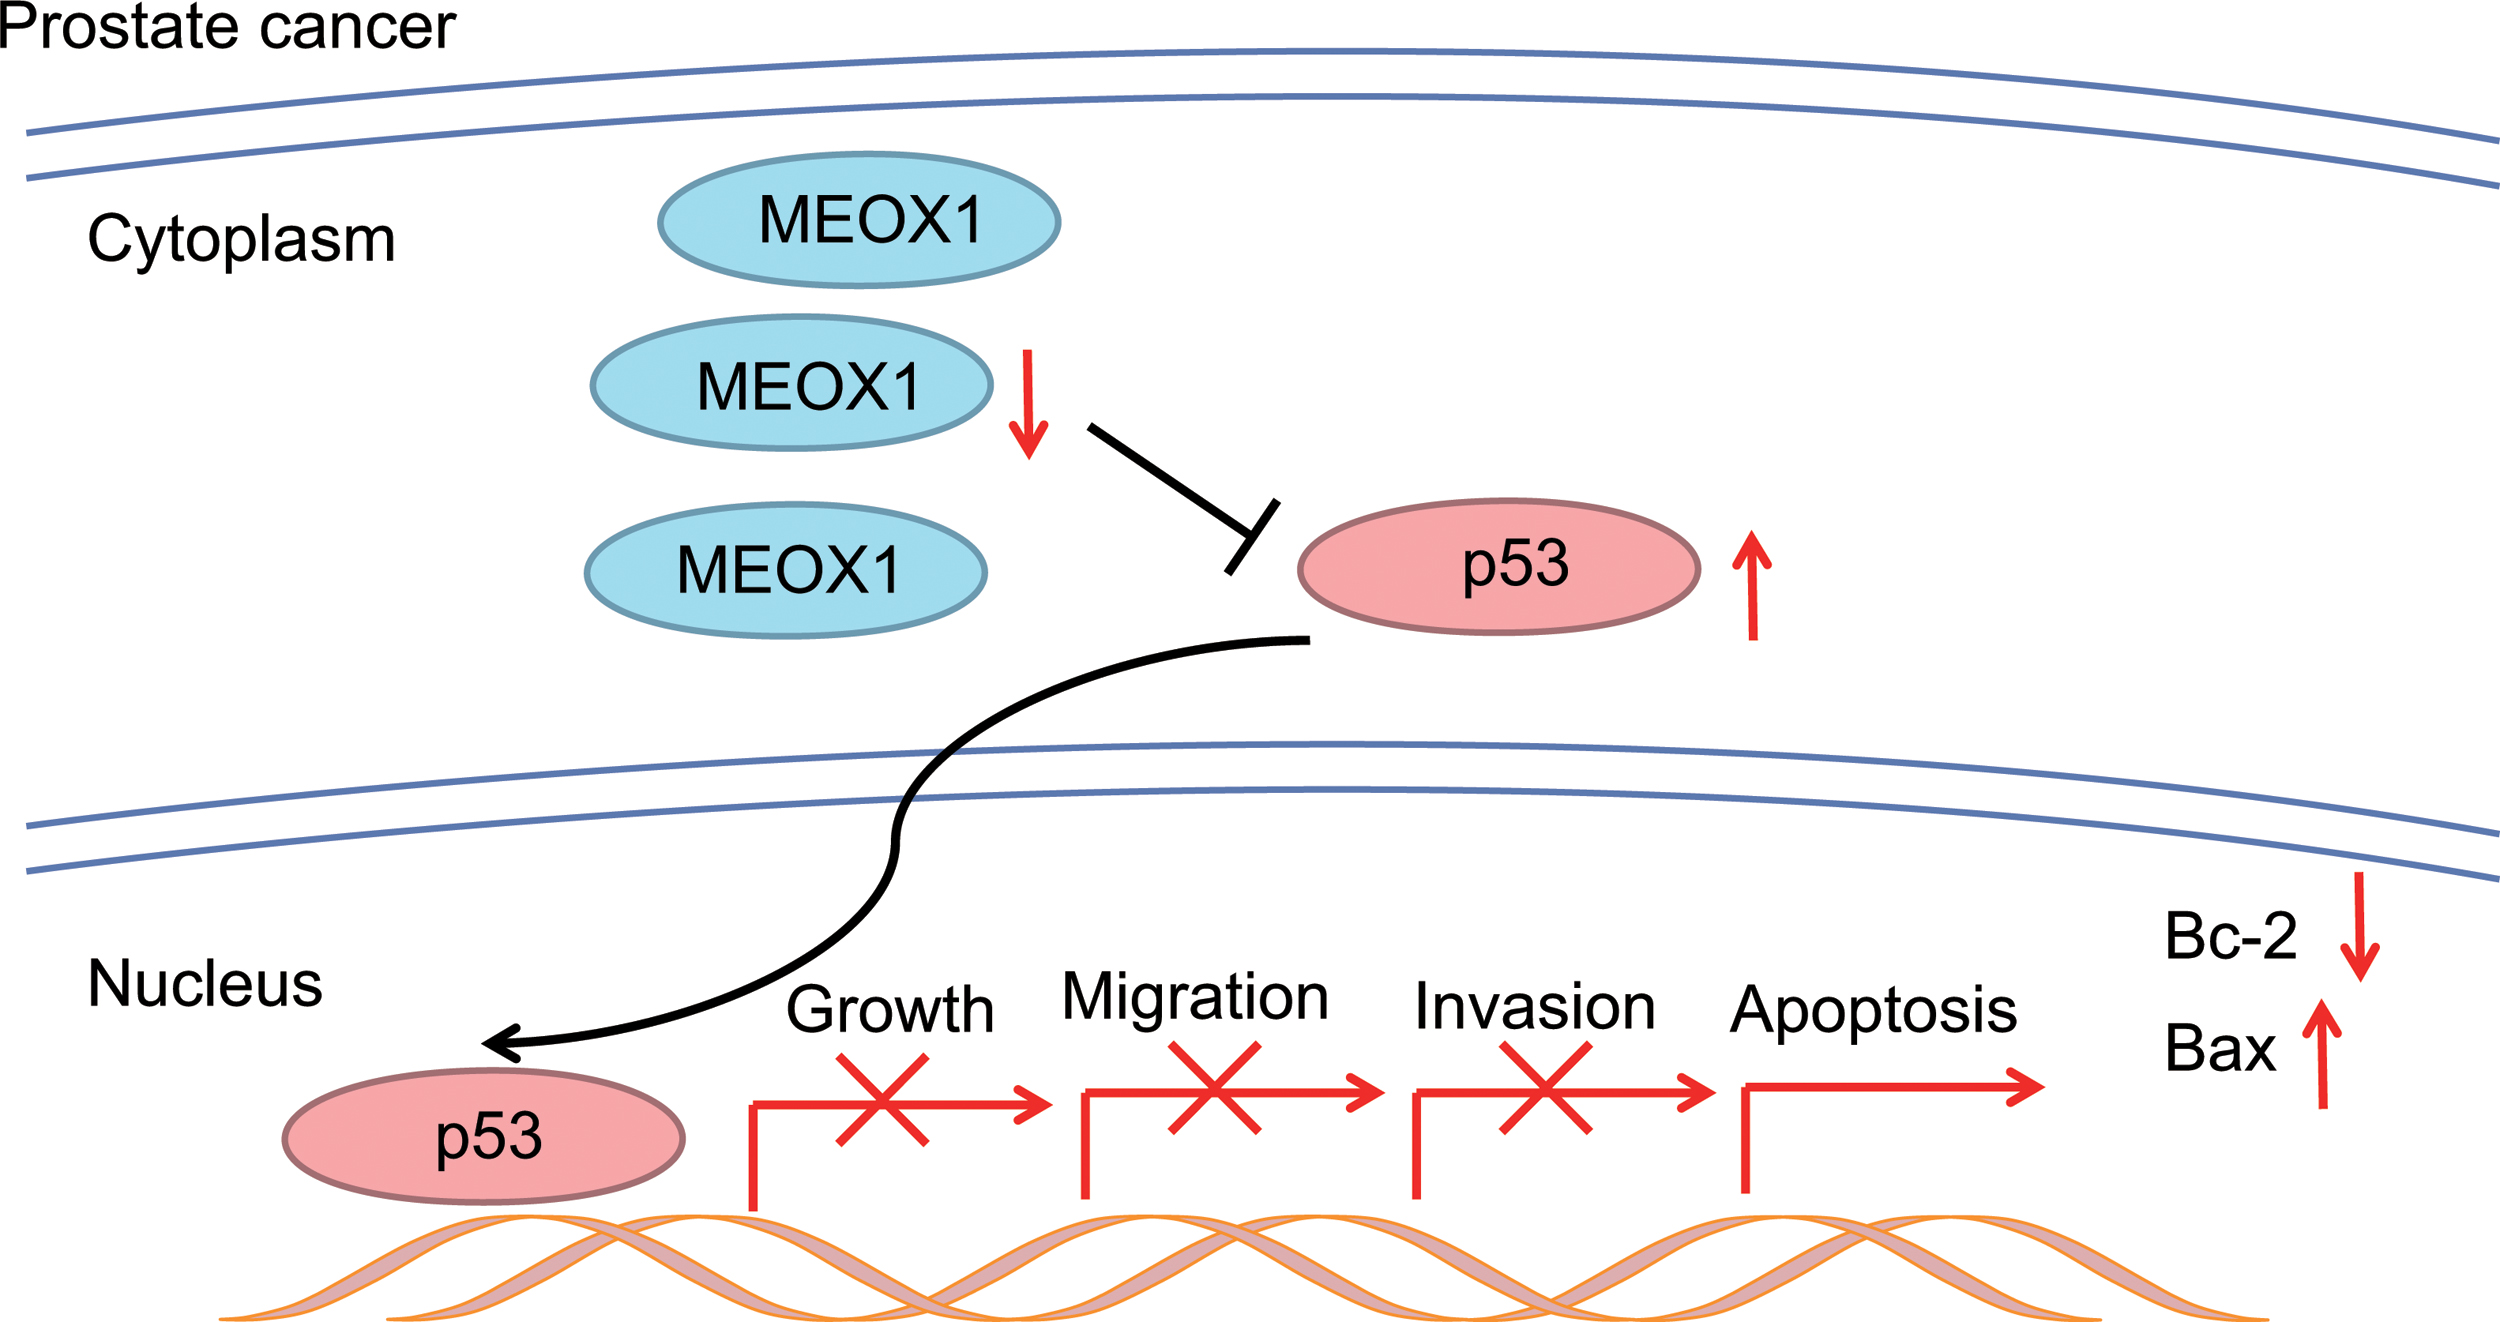
The potential mechanism of MEOX1 gene silencing in apoptosis and proliferation of PC cells. MEOX1 expression is highly expressed in PC cells, while silencing MEOX1 expression increases the expression of p53 and suppresses growth, migration, invasion, and enhances apoptosis of PC cells. MEOX1, homeobox protein MOX-1; PC, prostate cancer. Color images are available online.
Footnotes
Acknowledgment
We would like to acknowledge the helpful comments on this article received from our reviewers.
Disclosure Statement
There are no existing financial conflicts.