
Abstract
Introduction:
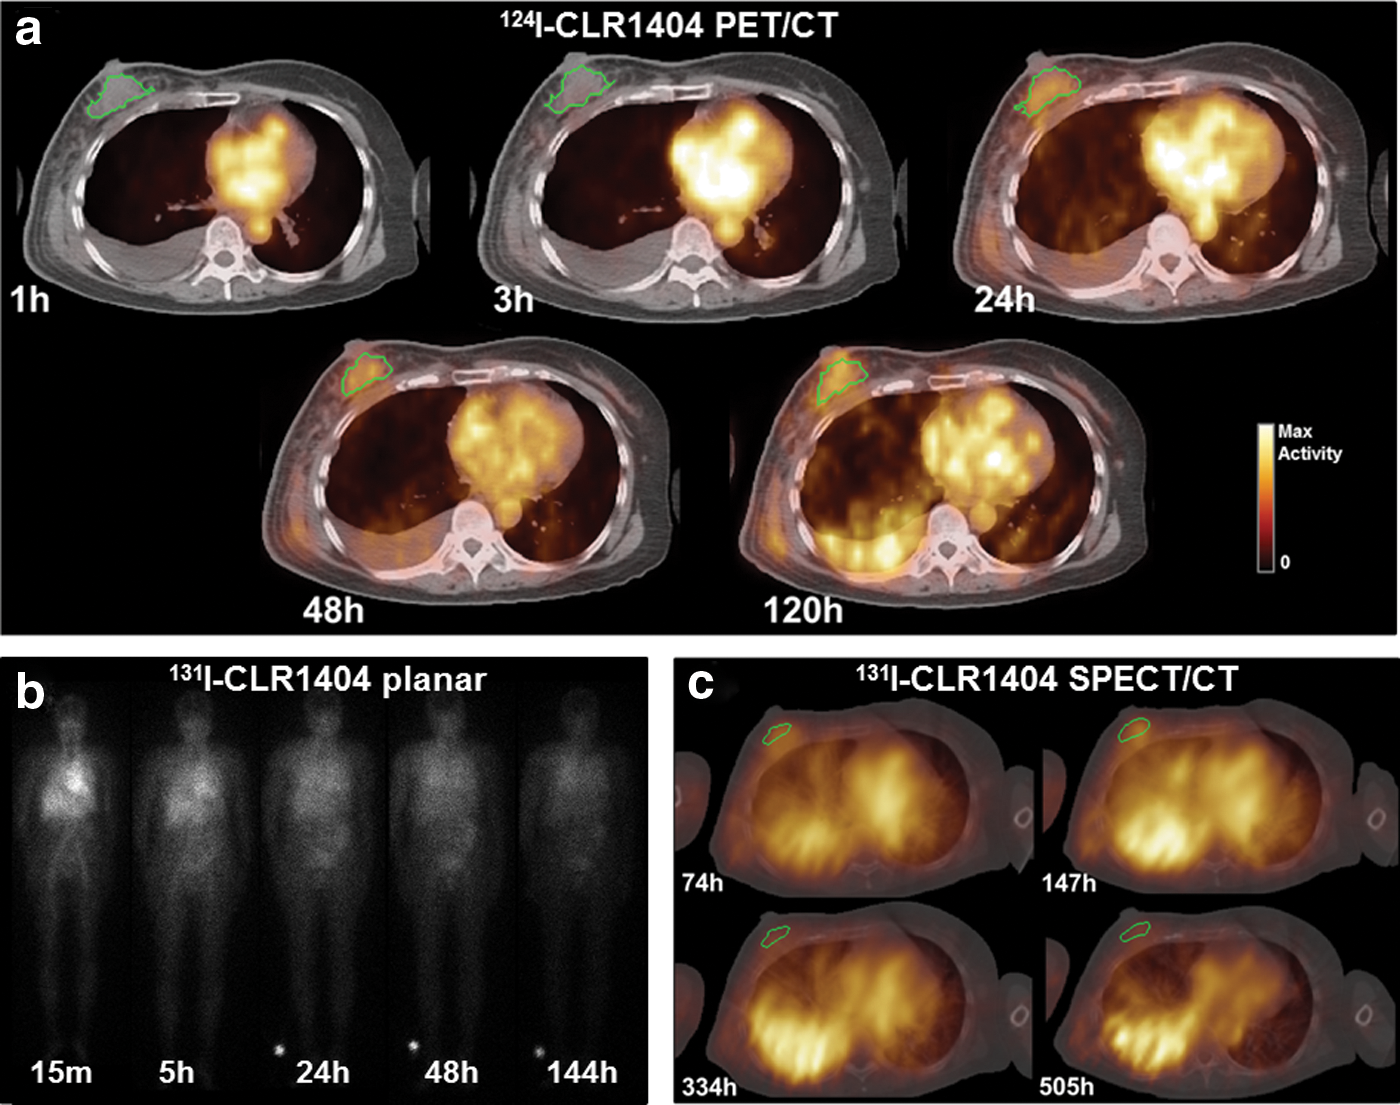
CLR1404 is a theranostic molecular agent that can be radiolabeled with 124I (CLR 124) for positron emission tomography (PET) imaging, or 131I (CLR 131) for single-photon emission computed tomography (SPECT) imaging and targeted radionuclide therapy. This pilot study evaluated a pretreatment dosimetry methodology in a triple-negative breast cancer patient who was uniquely enrolled in both a CLR 124 PET imaging clinical trial and a CLR 131 therapeutic dose escalation clinical trial.
Materials and Methods:
Three-dimensional PET/CT images were acquired at 1, 3, 24, 48, and 120 h postinjection of 178 MBq CLR 124. One month later, pretherapy 2D whole-body planar images were acquired at 0.25, 5, 24, 48, and 144 h postinjection of 370 MBq CLR 131. Following the therapeutic administration of 1990 MBq CLR 131, 3D SPECT/CT images were acquired at 74, 147, 334, and 505 h postinjection. The therapeutic CLR 131 voxel-level absorbed dose was estimated from PET (RAPID PET) and SPECT (RAPID SPECT) images using a Geant4-based Monte Carlo dosimetry platform called RAPID (Radiopharmaceutical Assessment Platform for Internal Dosimetry), and region of interest (ROI) mean doses were also estimated using the OLINDA/EXM software based on PET (OLINDA PET), SPECT (OLINDA SPECT), and planar (OLINDA planar) images.
Results:
The RAPID PET and OLINDA PET tracer-predicted ROI mean doses correlated well (m ≥ 0.631, R 2 ≥ 0.694, p ≤ 0.01) with both the RAPID SPECT and OLINDA SPECT therapeutic mean doses. The 2D planar images did not have any significant correlations. The ROI mean doses differed by −4% to −43% between RAPID and OLINDA/EXM, and by −19% to 29% between PET and SPECT. The 3D dose distributions and dose volume histograms calculated with RAPID were similar for the PET/CT and SPECT/CT.
Conclusions:
This pilot study demonstrated that CLR 124 pretreatment PET images can be used to predict CLR 131 3D therapeutic dosimetry better than CLR 131 2D planar images. In addition, unlike OLINDA/EXM, Monte Carlo dosimetry methods were capable of accurately predicting dose heterogeneity, which is important for predicting dose–response relationships and clinical outcomes.
Introduction
The theranostic paradigm involves the use of molecular agents for both diagnostic imaging and therapy. Molecular imaging plays a critical role in targeted radionuclide therapy (TRT) for the detection and diagnosis of the disease as well as the monitoring of treatment response. In addition, pretreatment imaging can be used to map the agent's pharmacokinetics and predict therapeutic dose distribution. 1 –3 Patient-specific pretreatment dosimetry allows the administration of the therapeutic agent to be optimized to deliver the largest possible dose to the tumor(s) while keeping all other critical structures within their dose tolerances. Thus, the use of theranostic agents in radionuclide therapy is an important advancement toward the realization of personalized medicine. 4
CLR1404, 18-(p-iodophenyl) octadecyl phosphocholine (Cellectar Biosciences, Inc., Madison, WI), is an alkyl-phospholipid ether analog that enters cells through lipid rafts that are over expressed in cancer cells, and has shown preferential uptake and retention in a broad spectrum of cancers. 5 –8 CLR1404 can be radiolabeled with either 124I (CLR 124) for positron emission tomography (PET) imaging or 131I (CLR 131) for TRT and single-photon emission computed tomography (SPECT)/planar imaging. The primary goal of this work was to evaluate the use of CLR 124 and CLR 131 pretreatment images to predict the CLR 131 therapeutic dose distributions.
This pilot study evaluated a pretreatment dosimetry methodology in a triple-negative breast cancer patient who was uniquely enrolled in both a CLR 124 imaging clinical trial and a CLR 131 therapeutic dose escalation clinical trial. Retrospective dosimetry was calculated based on pretreatment CLR 124 PET/CT and CLR 131 2D planar images, and compared with the therapeutic dose distribution calculated based on CLR 131 SPECT/CT images acquired after the therapeutic administration of CLR 131. A secondary goal of this work was to investigate the impacts of the dose calculation method (voxel- vs. organ-level) and the imaging modality. Thus, the voxel-level dose distributions were calculated using a Geant4-based Monte Carlo dosimetry platform called RAPID (Radiopharmaceutical Assessment Platform for Internal Dosimetry) 9 based on the PET/CT and 3D SPECT/CT images, and region of interest (ROI) mean doses were calculated using the OLINDA/EXM software based on the PET, SPECT, and planar images.
Materials and Methods
Patient data and image acquisition
A patient with triple-negative breast cancer was enrolled in both an imaging clinical trial (
The
As part of the imaging trial, 3D PET/CT images were acquired on a GE Discovery scanner at 1, 3, 24, 48, and 120 h (5 d) postinjection of 178 MBq of CLR 124. The CT was acquired with parameters of 140 kVp and 8 mAs, reconstructed using the standard body kernel convolution, and used for attenuation corrections, scatter corrections, and anatomical conformation for the PET images. The PET images were reconstructed using ordered subset expectation maximization (OSEM) method. The CT matrix size was 512 × 512 × 311, with a pixel size of 1.105 mm2 and a slice thickness of 3.27 mm. The PET matrix size was 128 × 128 × 311, with a pixel size of 5.426 mm2 and a slice thickness of 3.27 mm.
Approximately 1 month after the imaging trial, as part of a phase 1 dose escalation trial, pretherapy 2D planar images were acquired at 0.25, 5, 24, 48, and 144 h (6 d) postinjection of 185 MBq CLR 131 to assess the biodistribution. Planar scans were obtained on a GE Infinia scanner from the anterior and posterior projection, with a high-energy parallel-hole collimator, using a triple energy window (364 keV ±10%, 298 keV ±7.5%, 436 keV ±7.5%), with a matrix size of 256 × 1024 and with a pixel size of 2.209 mm2. Scatter corrections were applied, and the body thickness was estimated by evaluating attenuation as observed in 57Co flood source scans, using attenuation coefficients determined in experiments with 57Co and 131I sources as described in MIRD Pamphlet No. 16. 10
Three-dimensional SPECT/CT images were then acquired at 74, 147, 334, and 505 h (21 d) after the therapeutic 1990 MBq (31.25 mCi/m2 cohort) injection of CLR 131. Three-dimensional SPECT images were acquired on a GE Infinia scanner using a high-energy general purpose parallel-hole collimator with counts from a 15% energy window centered at 364 keV and reconstructed using OSEM on a matrix size of 128 × 128 × 128, a pixel size of 4.418 mm2, and a slice thickness of 4.418 mm. A low-dose helical CT scan was acquired after the SPECT scan with acquisition parameters of 140 keV and 5 mAs, and used for attenuation and scatter corrections and anatomical conformation for the SPECT images. The CT matrix size was 512 × 512 × 87, with a pixel size of 1.1045 mm2 and a slice thickness of 4.418 mm. Absolute activity quantification was obtained using a calibration factor that converts the SPECT voxel values to an activity concentration in accordance with the recommendation of MIRD Pamphlet No. 23. 11 The calibration factor was determined from serial scans (2 h, 2 d, and 7 d) of a phantom containing a uniform background 131I activity concentration of 0.44 mCi/mL and hot cylinders with an 131I activity concentration of 5 mCi/mL with the same imaging protocol used for the patient acquisition.
Dosimetric effects of the dose calculation method and image modality
The therapeutic CLR 131 3D absorbed dose was retrospectively estimated using RAPID based on both the PET/CT (RAPID PET) and SPECT/CT (RAPID SPECT) images. The ROI mean absorbed doses were also calculated using the OLINDA/EXM software version 1.1 using the PET/CT (OLINDA PET), SPECT (OLINDA SPECT), 2D whole-body planar (OLINDA planar), and both SPECT/CT and planar (OLINDA SPECT/planar) images. The ability of the PET and planar pretreatment tracer images to predict the therapeutic dose measured with the SPECT images was investigated using both OLINDA/EXM and RAPID to compute ROI mean doses. The details of each calculation are explained below and summarized in Table 1.
A Summary of Each Calculation Method Used to Calculate Dosimetry for the Triple-Negative Breast Cancer Patient
Voxel- and ROI-level dosimetry was calculated using RAPID based on the PET and SPECT images. ROI-level dosimetry was calculated using OLINDA/EXM based on the PET, SPECT, planar, and both the SPECT and planar images. For the hybrid SPECT and planar OLINDA calculation the 3D SPECT images were used to define the activity with the ROIs and the full-body 2D planar images were used to define the activity in the remainder of the body, which is assumed to be uniformly distributed throughout the body. The PET and planar images were used to calculate tracer-predicted doses, and the therapeutic doses were calculated based on the SPECT images. The OLINDA hybrid SPECT and planar were not included in the tracer-predicted and therapeutic dose comparison.
PET, positron emission tomography; RAPID, Radiopharmaceutical Assessment Platform for Internal Dosimetry; ROI, region of interest; SPECT, single-photon emission computed tomography.
RAPID Monte Carlo dosimetry
Voxelized 3D dose distributions were calculated based on both the PET/CT and SPECT/CT images using Monte Carlo. First, the CT and PET/SPECT at each time point were fused, and the PET/SPECT images were up-sampled to match the CT resolution, so that ROIs could be contoured on the full-resolution CT. Second, the CT images at each time point were coregistered temporally using a CT–CT affine registration (normalized mutual information), 12,13 and the transformation was replicated for the corresponding PET/SPECT images at each time point. Third, the liver, lungs, bone marrow, heart wall, spleen, right and left kidneys, spinal cord, and breast tumor were contoured on the CT/SPECT and CT/PET images. The bone marrow was contoured within lumbar vertebral bodies that were visible in the abdominal/thoracic CT images, and the right and left kidneys were contoured separately. The primary tumor in the right breast was contoured manually to include regions of both CT-enhancement and CLR1404-enchancement, and was approximately 38 cc on the PET images and 28 cc on the SPECT images. Activity outside the patient was masked out of the PET/SPECT images to remove extraneous source voxels, and the CLR 124 PET radioactivity concentration was converted to the therapeutic CLR 131 radioactivity concentration by correcting for the difference in decay rates while assuming equivalent 124I/131I pharmacokinetics.
The CLR 131 absorbed dose rate distributions were simulated for each respective PET and SPECT image time point using a patient-specific Monte Carlo 3D internal dosimetry platform called RAPID. 14,15
Within this Geant4 16 Monte Carlo platform, the CT images define the density and material composition within each voxel, and the PET/SPECT images define the radionuclide source distribution. The absorbed dose distribution was calculated by time-integrating the dose rate on a voxel-by-voxel basis using a piecewise linear fit with the uptake linearly extrapolated back from the first two time points and the decay after the last time point extrapolated using an exponential physical decay. The absorbed dose was then normalized by the injected activity to yield units of Gy/GBq of CLR 131 injected.
OLINDA/EXM dosimetry
For the OLINDA/EXM normal tissue dosimetry, the ROI mean absorbed doses were calculated using the PET, SPECT, 2D planar, and both SPECT and 2D planar images. The same liver, lungs, bone marrow, heart wall, spleen, kidney ROI contours generated from the PET and SPECT were used for both the RAPID and OLINDA/EXM normal tissue calculations. The cumulated activity outside of these organs was assigned to the OLINDA/EXM “remainder activity” parameter, which is the rest of the cumulated activity that is not within the ROIs. For the OLINDA planar calculation, the cumulated activities within the liver, lungs, heart wall, and spleen were contoured and used as source organs, and the rest was assigned to the remainder. For the OLINDA SPECT/planar calculation, the SPECT images were used to calculate the cumulated activities within the organ ROIs, and the whole-body ROI from the planar image was used to calculate the remainder activity parameter in OLINDA/EXM. This method has the advantage that the ROI activities are obtained from the 3D SPECT, and the remainder activity is obtained from the whole-body planar image rather than the partial SPECT image of the abdomen.
For all OLINDA PET and OLINDA SPET calculations, the time–activity curves were integrated using the same piecewise linear fitting method used for the integration of the absorbed dose rate within RAPID. For the OLINDA planar calculations, the time–activity curves were fit with a biexponential curve generated in the OLINDA/EXM exponential molding module. The total cumulated activity within each organ was scaled to account for differences in the phantom and CT-derived patient organ masses and for the PET, SPECT, and SPECT/planar methods. An adult female phantom and a 3.5 h bladder voiding model were used for the OLINDA/EXM normal tissue calculations. Spinal cord doses are not generated by OLINDA/EXM, and bilateral kidney doses are generated rather than individual kidney doses.
The spherical phantoms in OLINDA/EXM were used to calculate the tumor dose from the cumulated activity measured from the PET/CT and SPECT/CT images. The OLINDA/EXM tumor dose was not calculated from the planar images. The tumor mass was calculated based on the CT images, and different S-values at each time point were used to scale the cumulated activity to account for changes in tumor size.
Correlation between tracer-predicted mean doses and therapeutic doses
The tracer-predicted ROI mean doses from the planar and PET images (RAPID PET, OLINDA PET, OLINDA planar) were compared with the therapeutic doses measured with the SPECT (RAPID SPECT and OLINDA SPECT). The slope and the squared Pearson correlation coefficient (R
2
) were calculated to quantify the correlation between the tracer-predicted and SPECT-measured therapeutic ROI mean dose. The null hypothesis of no correlation (
Results
Time–activity quantification
The nondecay corrected percent injected activity per organ mass (%IA/g) at the scan time after injection is shown in Figure 2 for the tumor and eight normal tissues that were visible on both the PET and SPECT scans. The planar %IA/g for the liver, lungs, heart wall, and spleen are also shown. The activity distribution was more heterogeneous for the PET images compared with the SPECT images. The coefficient of variation (CV) in the ROI activity was calculated as a metric of activity heterogeneity, and ranged from 8% to 65% for the PET images and from 2% to 27% for the SPECT images.
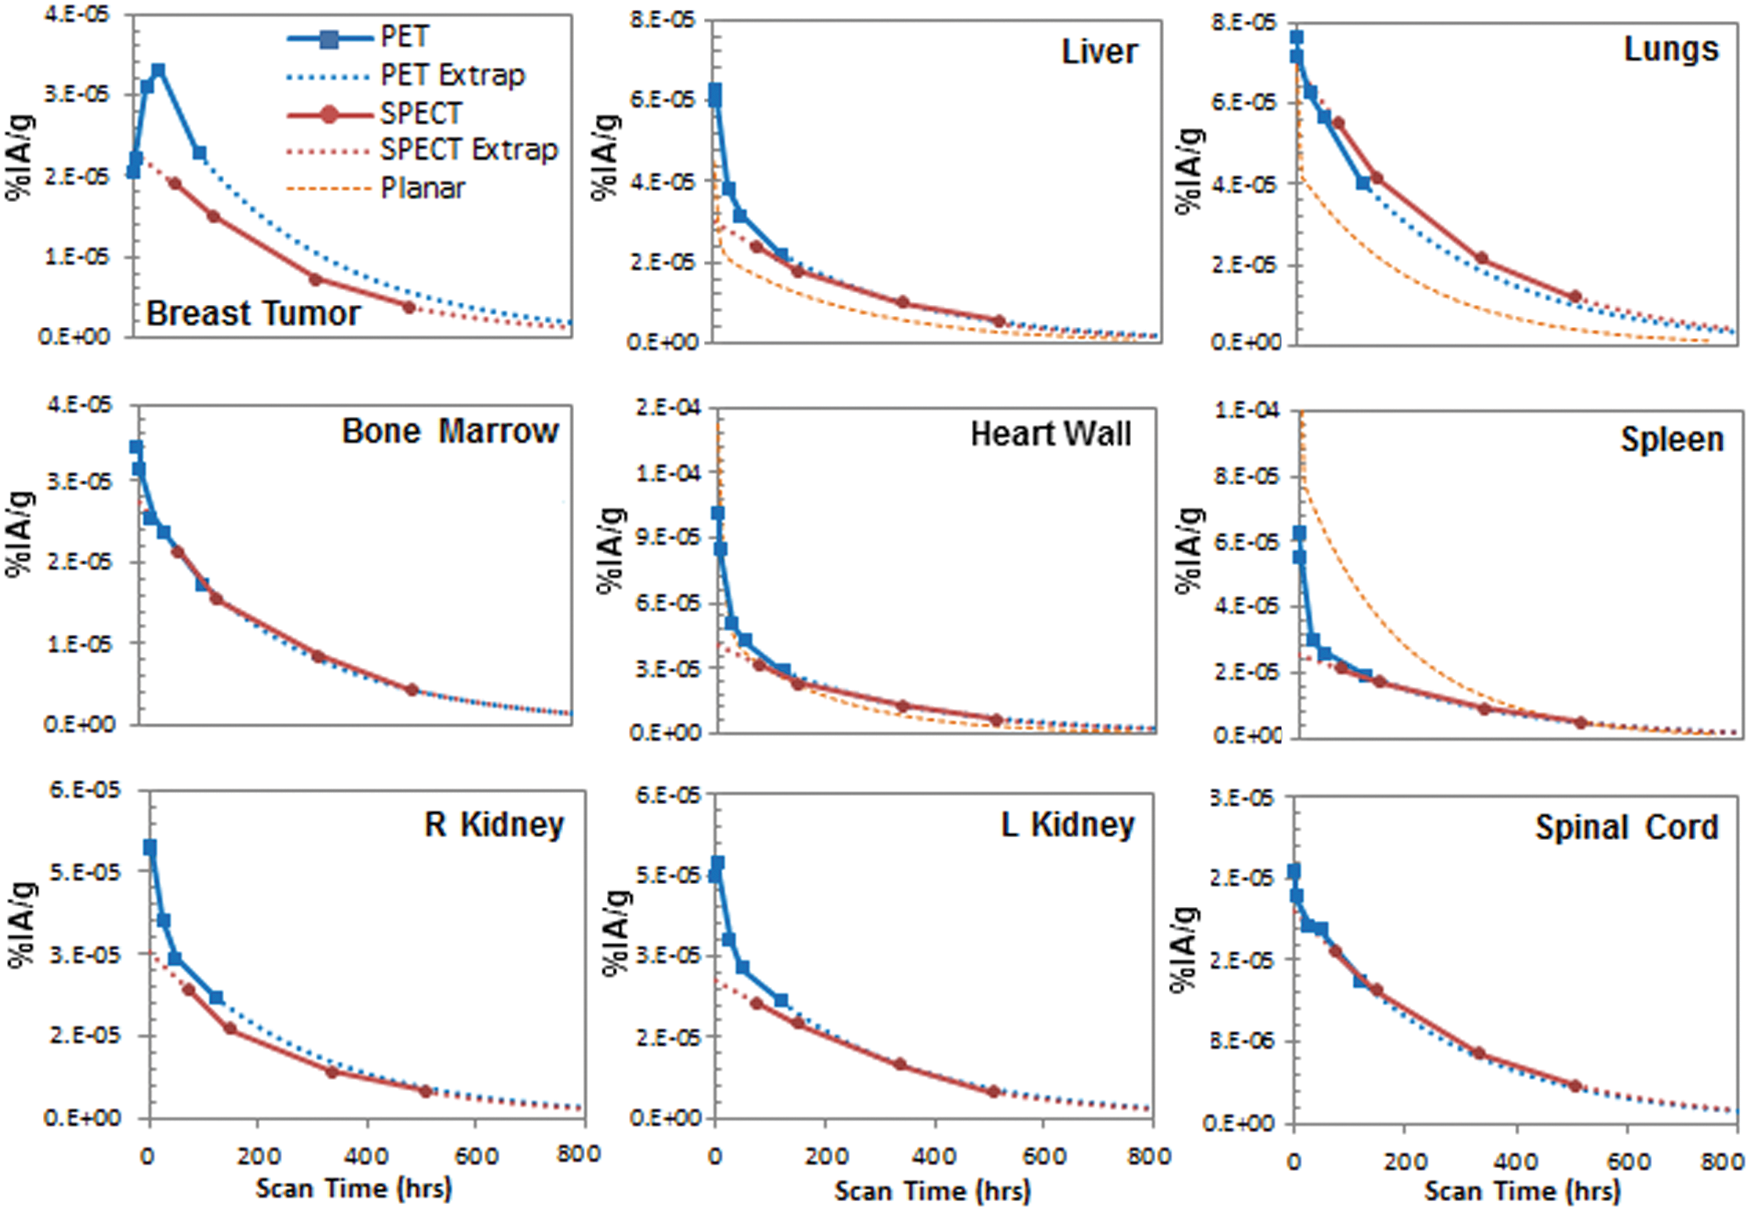
The nondecay corrected time activity curves for the CLR 124 PET and CLR 131 SPECT images. The PET and SPECT %IA/g curves are shown with a piecewise linear fit and with the uptake linearly extrapolated from the first two time points and the decay after the last time point fit extrapolated using exponential physical decay. The planar %IA/g for the liver, lungs, heart wall, and spleen are shown with the biexponential fit calculated in OLINDA/EXM. Color images available online.
Impact of the dose calculation method and image modality on the mean dose
Figure 3 shows the ROI mean absorbed doses calculated with RAPID using the PET and SPECT images and with OLINDA/EXM using the PET, SPECT, planar, and hybrid SPECT/planar images. Except for the spleen, the OLINDA ROI mean doses were smaller than the RAPID mean doses, especially when using the planar images.
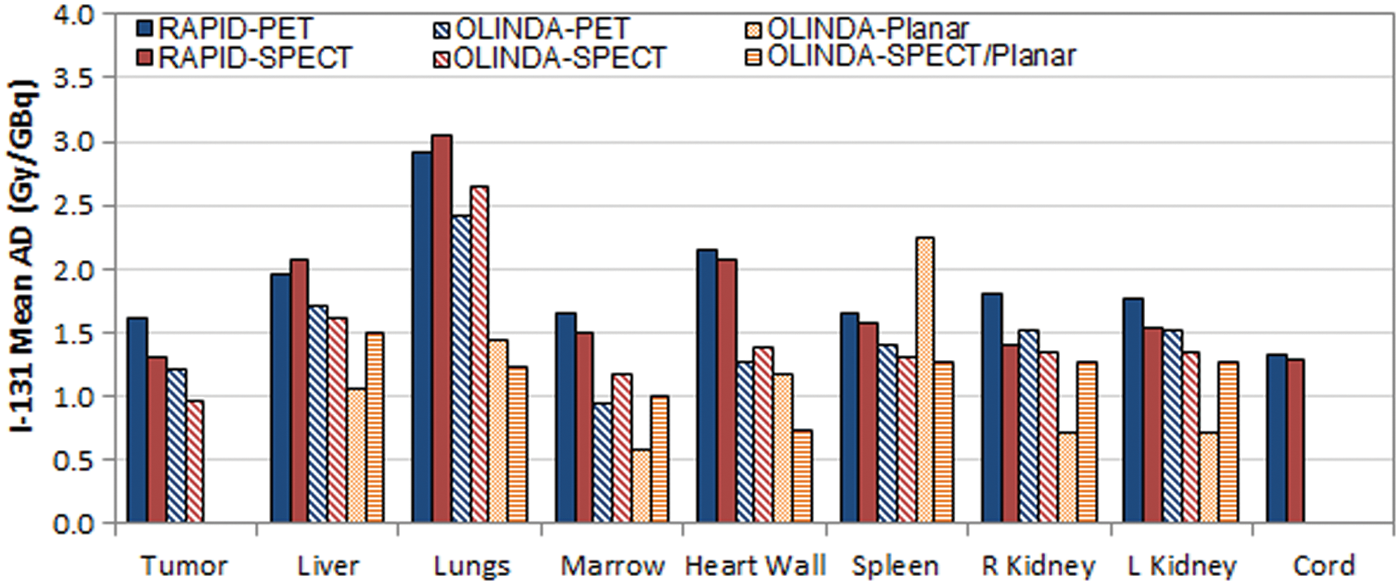
The ROI mean absorbed doses calculated with RAPID using the PET and SPECT images and calculated with OLINDA/EXM using the PET, SPECT, planar, and the hybrid SPECT/planar images. Note that OLINDA/EXM cord doses were not calculated because it is not included as a source organ in OLINDA/EXM. In addition, the breast tumor was not contoured in the planar image, so the OLINDA SPECT/planar and OLINDA planar doses are not calculated for the tumor. RAPID, Radiopharmaceutical Assessment Platform for Internal Dosimetry; ROI, region of interest. Color images available online.
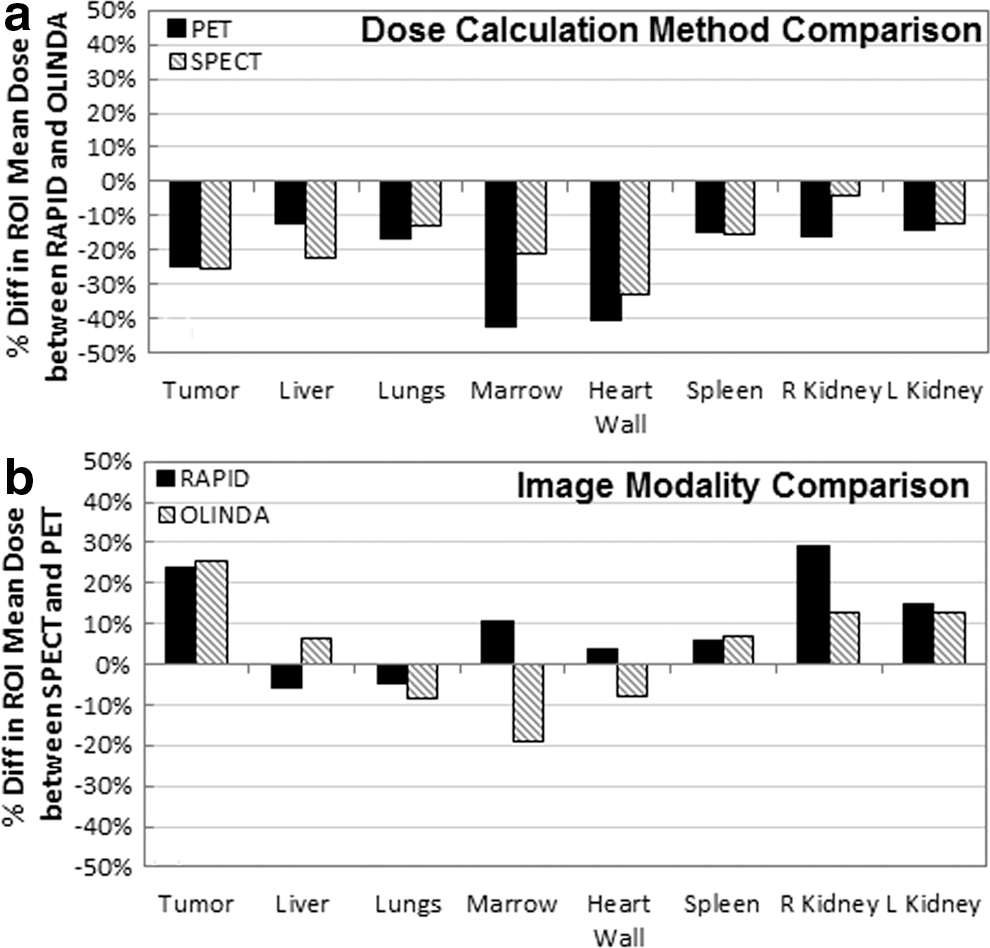
The differences in the mean doses between RAPID and OLINDA/EXM dose calculations ranged from −4% to −43% (Fig. 4a), whereas the differences between the PET and SPECT image modalities ranged from −19% to 29% (Fig. 4b). A positive difference indicates a larger dose calculated by RAPID and a larger dose from the PET images. As shown in Figure 4a, RAPID calculated larger doses than OLINDA/EXM for both image modalities. The differences between RAPID and OLINDA/EXM were larger when using the PET images for five of the eight ROIs. As shown in Figure 4b, PET resulted in larger doses than SPECT for six of eight ROIs when using RAPID, and five of eight ROIs when using OLINDA/EXM. The mean lung doses calculated with both RAPID and OLINDA/EXM using PET were larger when using the SPECT images.
Correlation between tracer-predicted and therapeutic mean doses
The ability of the PET and planar pretreatment tracer images to predict the therapeutic dose measured with the SPECT images was investigated using both OLINDA/EXM and RAPID to compute ROI mean doses. Figure 5 compares the ROI mean absorbed dose predicted by each calculation method and pretreatment image modality combination with the delivered therapeutic dose measured by the SPECT. The plots on the top row compare RAPID PET, OLINDA PET, and OLINDA planar with the SPECT doses calculated with RAPID, and the bottom row compares RAPID PET, OLINDA PET, and OLINDA planar with the SPECT doses calculated with OLINDA/EXM. A perfect correlation would lie upon the line of unity with no variance (i.e.,
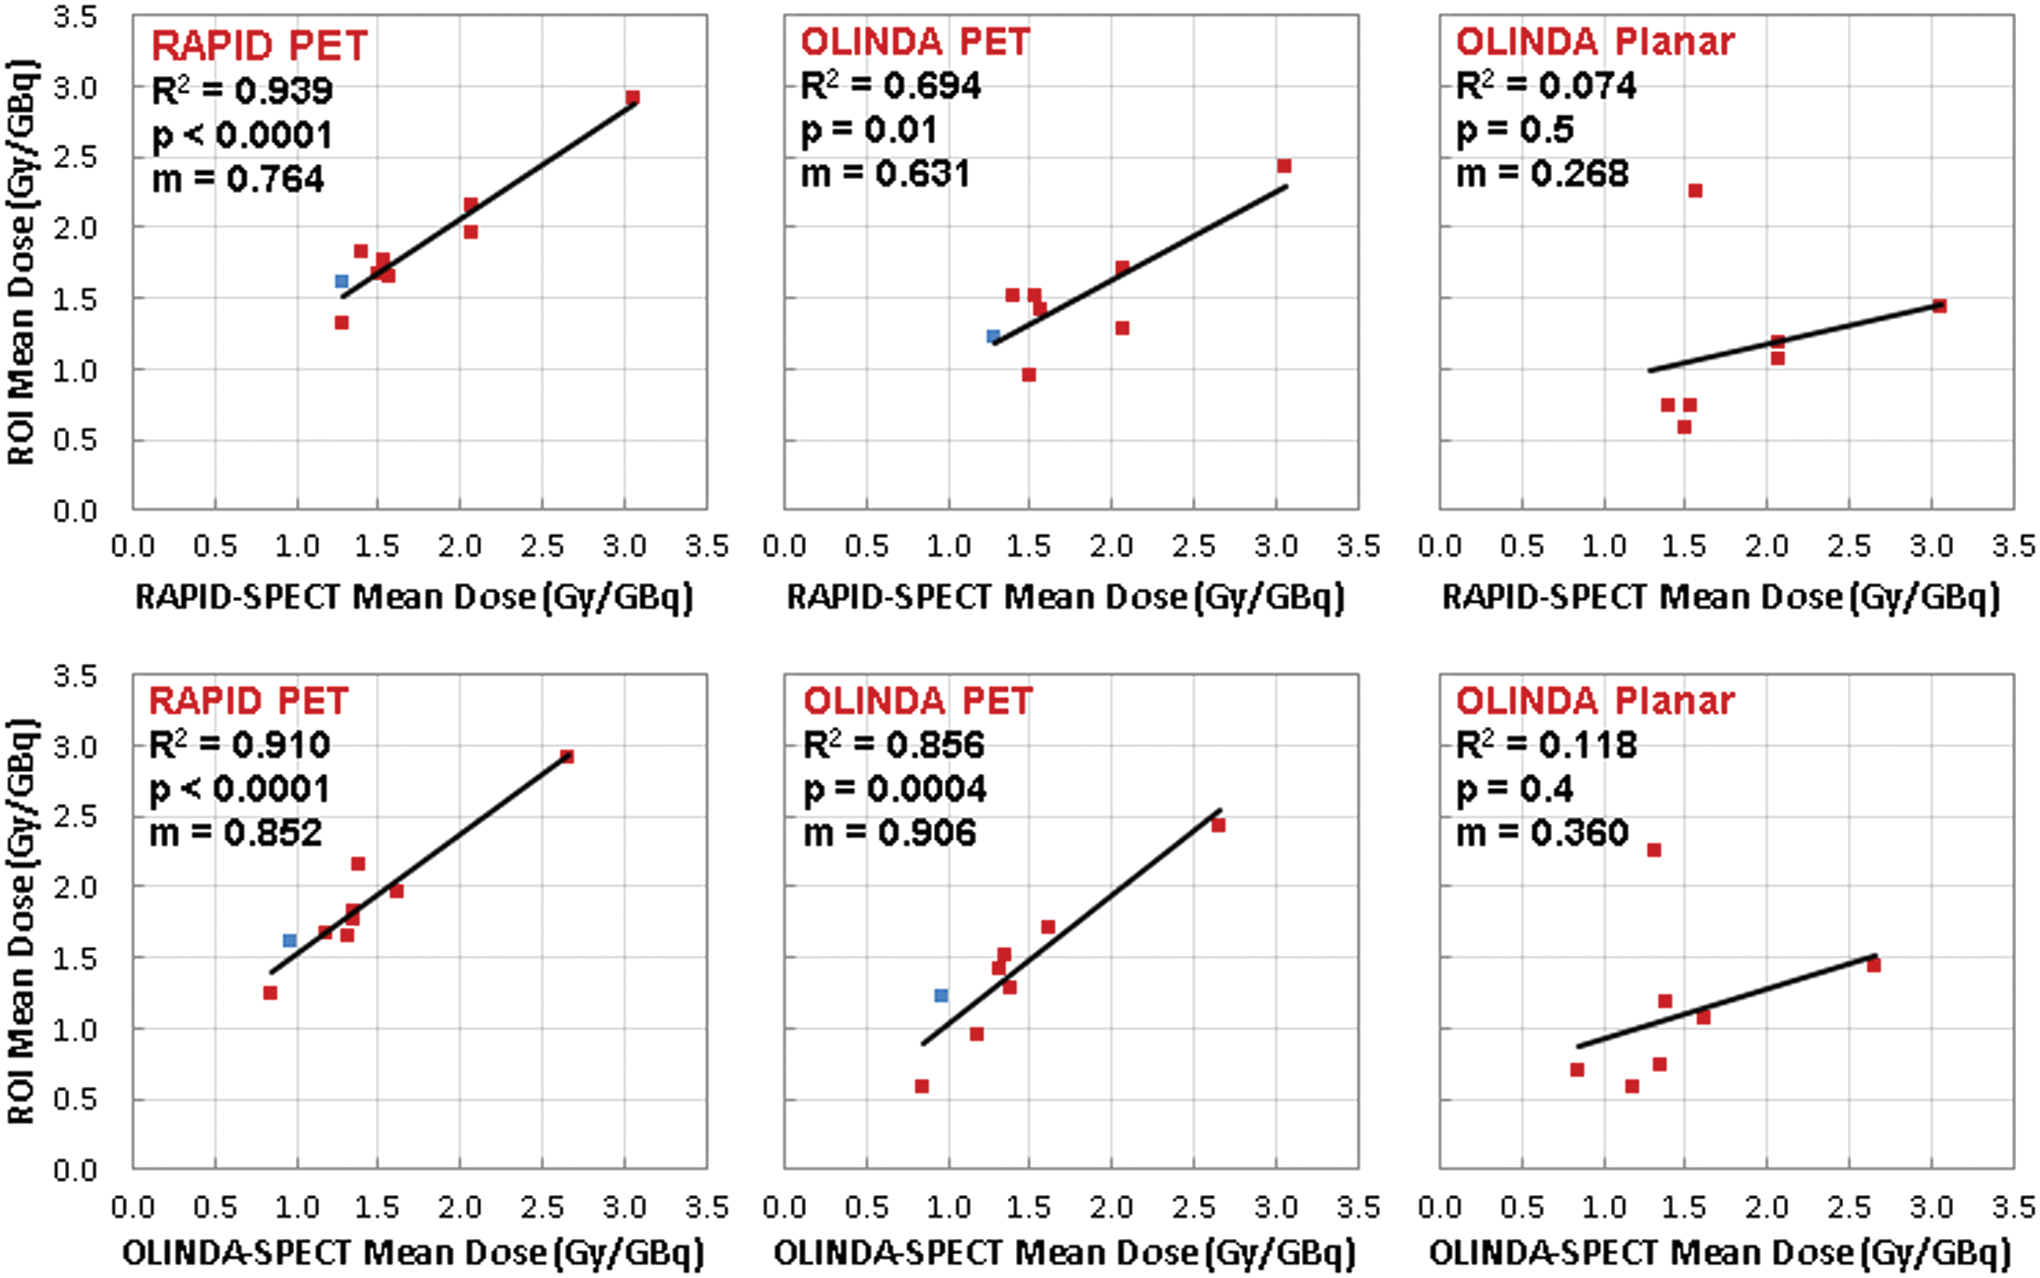
The ROI mean absorbed dose predicted by each calculation method compared with delivered therapeutic dose calculated with RAPID SPECT (top) and OLINDA SPECT (bottom). The red data points represent the normal tissue ROIs, and the blue data point represents the tumor ROI. The slope, squared Pearson's correlation coefficient (R
2
), and p-values of the correlation are also shown. A perfect correlation would lie upon the line of unity with no variance (i.e.,
Both RAPID PET (m = 0.764, p < 0.0001) and OLINDA PET (m = 0.631, p = 0.01) tracer-predicted ROI mean doses correlated well with RAPID SPECT therapeutic ROI doses. In addition, both RAPID PET (m = 0.852, p < 0.0001) and OLINDA PET (m = 0.906, p = 0.0004) tracer-predicted ROI mean doses correlated well with OLINDA SPECT therapeutic ROI doses. OLINDA PET–OLINDA SPECT correlation had the slope closest to unity (m = 0.906), and RAPID PET–RAPID SPECT correlation had the smallest variance (R 2 = 0.939). The OLINDA planar tracer-predicted doses did not have significant correlations to either the RAPID-SPECT (m = 0.268, p = 0.5) or OLINDA SPECT (m = 0.360, p = 0.4) therapeutic doses.
The percentage differences in the ROI mean doses ranged from −6% to 29% for the RAPID PET–RAPID SPECT, 9% to 66% for the RAPID PET–OLINDA SPECT, −38% to 8% for the OLINDA PET–RAPID SPECT, −19% to 25% for the OLINDA PET–OLINDA SPECT, −61% to 43% for the OLINDA Planar-RAPID SPECT, and −50% to 70% for the OLINDA Planar–OLINDA SPECT. In general, the spleen, tumor, and heart wall had the largest differences between the tracer-predicted dose and the therapeutic dose measured using SPECT.
RAPID voxelized dosimetry
The 3D CLR 131 absorbed dose colorwashes calculated with RAPID based on the CLR 124 PET/CT and CLR 131 SPECT/CT images are shown in Figure 6. Qualitatively, the PET- and SPECT-based dose distributions appear relatively similar except for the decreased tumor dose calculated by RAPID SPECT. The DVHs of the 3D absorbed dose distribution computed with RAPID using the PET and SPECT images are shown in Figure 7. In general, RAPID PET doses were slightly larger than RAPID SPECT because the PET protocol was able to capture more of the initial CLR1404 uptake that was not measured by the late SPECT scan time points. The ROI activity concentration heterogeneity ranged from a CV of 21% to 57% and 4% to 25%, and the ROI dose heterogeneity ranged from a CV of 14% to 36% and 17% to 27% for the RAPID PET and SPECT dose distributions, respectively. The ROI activity concentration CV did not correlate well with the resulting ROI dose CV for PET (m = 1.36, R 2 = 0.70, p = 0.02) or the SPECT (m = 0.42, R 2 = 0.03, p = 0.93) as shown in Figure 8. However, PET ROI dose CV correlated fairly well with SPECT ROI dose CV (m = 0.80, R 2 = 0.54, p = 0.11) (Fig. 8). The difference between PET and SPECT ROI activity CV ranged from 2.5% to 44.9%, while the difference in the ROI dose CV only ranged from −5.8% to 1.1%. For all but one ROI, SPECT images resulted in larger activity and dose heterogeneities (i.e., larger CV) compared with PET.

Three-dimensional CLR 131 absorbed dose colorwashes calculated with RAPID using the CLR 124 PET/CT and CLR 131 SPECT/CT images overlaid on the CT images. The doses are shown in units of Gy per GBq of 131I injected, and the breast tumor is shown contoured in red. Color images available online.

Cumulative DVHs of the voxelized 3D absorbed dose distribution calculated with RAPID using the CLR 124 PET and CLR 131 SPECT images. Color images available online.

Correlation between the ROI activity concentration and dose CV (i.e., heterogeneity) for the PET and SPECT images (left), and correlation between the PET and SPECT ROI dose CV (right). A perfect correlation would lie upon the dotted line of unity with no variance (i.e.,
Discussion
Retrospective 3D dosimetry for a triple-negative breast cancer patient was calculated with RAPID and compared with the mean doses calculated with OLINDA/EXM based on serial CLR 124 PET/CT, CLR 131 SPECT/CT, and CLR 13 planar images. Some variation in the time–activity curves (Fig. 2) was expected due to the extended time (i.e., 1 month) in between the PET and SPECT image acquisition, and due to the 30% change in tumor size that occurred within that time. In general, the PET imaging protocol generally measured more activity than the SPECT imaging protocol for most of the ROIs. This is primarily because the first SPECT image, which was acquired at 3 d postinjection, missed some of the initial CLR104 uptake measured by the PET, which has scan time points at 1, 3, and 24 h postinjection. The underestimation is more pronounced for the tumor because the later SPECT time point failed to capture the delayed uptake that results in a peak in the %IA/g curve. Therefore, future dosimetric comparisons would benefit from equivalent imaging time points. In addition, this emphasizes the importance of acquiring early time points and designing an image acquisition protocol, which thoroughly samples the pharmacokinetic curve. It is also likely that the increased uptake in the larger pleural effusion volume in the SPECT images slightly reduced the CLR1404 activity concentration in other regions.
The planar %IA/g was smaller for the lungs, liver, and heart wall compared with the PET and SPECT but larger for the spleen due to the 2D contour being in a region with overlapping organs. The planar %IA/g for the lungs was noticeably smaller than the PET and SPECT %IA/g, because the planar %IA/g was calculated assuming a purely planar approach (i.e., no CT would be available) and the phantom lung mass was larger than the lung mass calculated directly from the patient's CT images. If the patient's lung mass from the CT images was known and used to calculate the planar %IA/g, these curves would be much closer aligned.
Impact of the dose calculation method
The differences in the ROI mean doses calculated based on the PET and SPECT images ranged from −6% to 29% for RAPID and −19% to 25% for OLINDA/EXM (Fig. 4b). In general, PET resulted in larger doses than SPECT for most of the ROIs due to the difference in image acquisition protocols mentioned previously. The effect was the largest for the tumor that differed by 24% when calculated with RAPID and 25% when calculated with OLINDA/EXM because the SPECT failed to capture the delayed uptake peak in the %IA/g curve. The SPECT images resulted in larger lung doses for both RAPID and OLINDA/EXM due to the large hot spots caused by streaking artifacts in the lower quality CT scanner apart of the SPECT/CT scanner compared with the PET/CT. In the future, density overrides may be necessary to correct for such imaging artifacts.
For tumors, differences between the RAPID and OLINDA/EXM 131I mean dose were approximately −25% based on the PET images and −26% based on the SPECT images (Fig. 4a). As expected, the mean tumor doses calculated with OLINDA/EXM were smaller than RAPID because OLINDA/EXM only accounts for tumor self-dose and ignores the cross dose from neighboring organs. The magnitude of the deviations seen in these results is consistent with previous work comparing patient-specific Monte Carlo dosimetry (DPM Monte Carlo platform) with OLINDA/EXM sphere dosimetry for 131I radioimmunotherapy of 57 lymphoma tumors imaged with SPECT/CT where the mean doses calculated from OLINDA/EXM were significantly lower than the Monte Carlo doses (p < 0.001) and the differences ranged from 2% to 31%. 17 Another study of 2 non-Hodgkin's lymphoma patients who were treated with 131I-labeled tositumomab (Bexxar®) and imaged with SPECT/CT found that mean tumor doses calculated by OLINDA/EXM differed by up to 12% when compared with Monte Carlo dosimetry (Geant4-based VIDA platform). 18 A study involving 6 patients imaged with 99mTc-HYNIC-TOC hybrid planar/SPECT images compared Monte Carlo (EGSnrc DOSXYZnrx-based JADA platform) 131I dosimetry with OLINDA/EXM, and found mean tumor dose differences of 6% ± 5.4%. 19 In addition, Kolbert et al. compared Monte Carlo dosimetry (3D-RD platform) to OLINDA/EXM for 2 patients with metastatic colorectal cancer treated with 177Lu-labeled di-HSG peptide IMP288 and imaged with SPECT/CT and found 177Lu mean dose differences up to 9.6% for 177Lu. 20 Senthamizhchelvan et al. computed 153Sm-EDTMP tumor doses for 19 tumors in 6 patients with osteosarcoma with the EGS4 DOSXYZnrc-based 3D-RD platform, and the values obtained were within 5% of OLINDA/EXM. 21
For the normal tissues, the differences between RAPID and OLINDA/EXM 131I mean doses ranged from −4% to −33% for SPECT and −13% to −43% for PET (Fig. 4a). The bone marrow and heart wall showed the largest differences. The difference in the bone marrow dose was likely due to a difference in the definition of the bone marrow source organ. For 3D dosimetry methods like RAPID, the CT images can be used to define a patient's specific bone marrow space where dosimetry is specifically calculated on a voxel level, while OLINDA/EXM generates whole-body red marrow dose using a general whole-body bone marrow definition. The differences in the heart wall dose were likely due to differences in patient's CT geometry and OLINDA/EXMs adult female phantom. Uncertainty is also introduced by the coregistration and resampling of the 3D images performed by RAPID.
Normal tissue (i.e., kidneys, liver, and spleen) 131I mean doses were also calculated for the patients imaged with 99mTc-HYNIC-TOC hybrid planar/SPECT, and differences between JADA and OLINDA/EXM were approximately <6%.
19
For the 2 non-Hodgkin's lymphoma patients, normal tissue (kidneys, liver, spleen, lungs, and heart) 131I mean dose differences between VIDA and OLINDA/EXM were as large as 19%, where the largest difference occurred in the kidneys.
18
In another study, Divoli et al. compared normal tissue (i.e., kidneys, liver, spleen, and lungs) 131I mean dose differences between OLINDA/EXM and Monte Carlo (MCNPX-based OEDIPE platform) for 9 patients, and found differences up to 26%.
22
Similar comparisons have also been done for the diagnostic agent
18
F. Marcatili et al. found that the average deviation in the mean normal tissue dose (brain, kidneys, liver, lungs, spleen, and thyroid) for 5 healthy patients imaged with
18
F PET/CT was 97% (
A broad range of differences have been observed between using patient-specific voxel-level Monte Carlo methods and organ-level MIRD-based methods for both tumor and normal tissue dosimetry. The magnitude of these discrepancies can vary depending on the differences between the patient-specific CT geometry and the phantom geometry (i.e., composition, shape, or relative spatial distribution of the organs/tumor), the amount of activity/dose heterogeneity, the coregistration and resampling methods used in voxelized methods, and the Monte Carlo code used for the dose calculation. The differences between the mean doses calculated with RAPID and OLINDA/EXM for the clinical triple-negative breast cancer patient were within the range seen in previous publications.
The OLINDA PET–OLINDA SPECT correlation had the slope closest to unity, indicating that OLINDA/EXM is likely the most consistent method for calculating tracer-predicted ROI mean doses. This is likely due to the simplicity of the calculation, and the fact that the 3D imaging information is being reduced to 2D dosimetry results. However, it is not necessarily the most accurate method because it fails to consider the patient-specific geometry, tissue heterogeneity, dose heterogeneity, as well as the contributions of the cross dose to the tumor. While the more patient-specific Monte Carlo approach has the potential to be the most accurate method, there are also many aspects of the more complex workflow that can introduce uncertainties such as temporal image registration and resampling, pharmacokinetic fitting on the voxel level, and possible artifacts in CT images.
Impact of the pretreatment image modality
The ability of each dose calculation method and pretreatment image modality to accurately predict the delivered therapeutic ROI mean dose was assessed by comparing the tracer-predicted doses with the SPECT doses calculated with both RAPID and OLINDA/EXM (Fig. 5). It is well known that PET offers improved spatial resolution over SPECT and is presently the most accurate method for the determination of activity concentrations in tissue. 24 Thus, the use of 124I PET imaging to estimate 131I therapeutic dosimetry has frequently been suggested. 25 –29 A comprehensive study by Dewaraja et al. found a significant correlation (n = 125, p < 0.001) between the tumor mean dose predicted by 124I PET pretreatment imaging and the delivered 131I-tositumomab (Bexxar) dose measured by 131I SPECT when each were calculated with DPM. 30 Similarly, the tracer mean doses calculated with RAPID based on the CLR 124 PET correlated well (m = 0.764, p < 0.0001) with the therapeutic mean doses measured with 131I-CL1404 SPECT. The PET images were able to successfully predict the therapeutic mean doses measured by the SPECT (m ≥ 0.631) regardless of the calculation method used. The OLINDA planar tracer doses did not have significant correlations to either the RAPID SPECT or OLINDA SPECT therapeutic doses. This is consistent with the results presented by Koral et al. that the ROI radioactivity measured from the tracer and therapy, and found significant correlations (n = 24, p < 0.05) between 131I SPECT (tracer) and SPECT (therapy) but no significant correlation (n = 60, p > 0.05) between the 131I planar (tracer) and SPECT (therapy). 31
Other studies have also compared the ability of imaging techniques to estimate the delivered therapeutic dose using 131I planar/131I planar, 31,32 131I SPECT/131I SPECT, 18,33 124I PET/131I planar, 28,29 and 124I PET/131I 2″ × 2″ NaI scintillation probe 2 as well as studies comparing different imaging modalities and imaging radiopharmaceuticals against one another using 111In planar/86Y PET 34 and 86Y-EDTMP PET/86Y-citrate PET. 35
RAPID voxelized dosimetry
The correlation between the RAPID PET and RAPID SPECT 3D dose distribution was also investigated. The DVHs showed that RAPID PET predicted very similar 3D distributions to the delivered therapeutic dose represented by RAPID SPECT (Fig. 7). In general, the doses calculated using the SPECT were slightly smaller than those calculated using the PET (due to the difference in image acquisition protocols, which was mentioned previously), and the ROI activity concentrations and doses were more heterogeneous. A study by Kost et al. compared tumor DVHs calculated using VIDA for 2 non-Hodgkin's lymphoma patients imaged with SPECT at three time points after tracer and therapeutic administrations of 131I-labeled tositumomab (Bexxar). 18 They found that the tracer-predicted maximum tumor doses were larger and the dose distribution was more heterogeneous compared with the therapeutic dose, possibly due to the increased antibody clearance in tumor cells after treatment caused by the radiobiological damage of the tracer dose. 18 To the best of our knowledge, this is the first comparison of dose heterogeneity and DVHs calculated based on PET and SPECT imaging of the same patient. Having the ability to obtain information on the dose heterogeneity is one of the greatest benefits of patient-specific voxelized dosimetry over conventional organ-level MIRD-based methods that only provide ROI mean doses. Nonuniform dose distributions can have important clinical implications for treatment response and toxicity 3,36,37 as well as the possible combination with other therapies (e.g., external beam radiation therapy). 38 For example, increasing dose heterogeneity within tumors has been shown to result in an increased loss of therapeutic effectiveness due to a portion of the volume receiving sublethal doses. 36 Evidence for dose–response relationships has already been established using heterogeneity metrics such as the equivalent uniform dose and equivalent biological effect (E). 6,21,39,40
Conclusions
This pilot study demonstrated that CLR 124 pretreatment PET images can be used to help predict CLR 131 3D therapeutic dosimetry better than CLR 131 2D planar images. Thus, future CLR1404 clinical trials could utilize pretreatment imaging to calculate patient-specific dosimetry, and determine the optimal therapeutic administration activities that would maximize the tumor doses and keep all normal tissues within dose constraints. With the increased availability of more sophisticated computing methods, the calculation of voxelized dose distributions using direct Monte Carlo methods has been emerging as an attractive alternative to conventional organ-level methods. Unlike conventional internal dosimetry methods, which are not optimized for therapeutic applications, voxelized methods are capable of calculating dose heterogeneity as well as radiobiological dose metrics, which are important for predicting dose–response relationships and predicting clinical outcomes.
Footnotes
Acknowledgments
We thank the UW CHTC for the use of their cluster and their computational support. We also thank Cellectar Biosciences, Inc. for providing the CLR1404 clinical data and Michael Stabin for performing the OLINDA/EXM planar dosimetry. This study was partially funded by NIH Grant R01 CA 158800, NIH Grant 9U54TR000021, and NIH Grant R21 CA198392-01. This work was also supported in part by NIH P50 DE026787-UW Head and Neck SPORE Grant.
Disclosure Statement
J.P.W. is a founder of Cellectar Biosciences, Inc., which owns the licensing rights to CLR1404 and related technologies.