
Abstract
Background:
Despite the improvement in clinical outcomes for head and neck squamous cell carcinoma (HNSCC) as the result of cetuximab, patients may present with or develop resistance that increases tumor recurrence rates and limits clinical efficacy. Therefore, identifying those patients who are or become resistant is essential to tailor the best therapeutic approach.
Materials and Methods:
Cetuximab was conjugated to p-NCS-Bz-DFO and labeled with 89Zr. The resistance model was developed by treating FaDu cells with cetuximab. Western blotting (WB) and specific binding assays were performed to evaluate epidermal growth factor receptor (EGFR) expression and 89Zr-DFO-cetuximab uptake in FaDu cetuximab-resistant (FCR) and FaDu cetuximab-sensitive (FCS) cells. Positron emission tomography imaging and biodistribution were conducted in NU/NU nude mice implanted with FCR or FCS cells.
Results:
Cetuximab was successfully radiolabeled with 89Zr (≥95%). Binding assays performed in FCR and FCS cells showed significantly lower 89Zr-DFO-cetuximab uptake in FCR (p < 0.0001). WB suggests that the resistance mechanism is associated with EGFR downregulation (p = 0.038). This result is in agreement with the low uptake of 89Zr-DFO-cetuximab in FCR cells. Tumor uptake of 89Zr-DFO-cetuximab in FCR was significantly lower than FCS tumors (p = 0.0340).
Conclusions:
In this work, the authors showed that 89Zr-DFO-cetuximab is suitable for identification of EGFR downregulation in vitro and in vivo. This radiopharmaceutical may be useful for monitoring resistance in HNSCC patients during cetuximab therapy.
Introduction
While progress in imaging techniques has led to improved diagnosis and staging in cancer patients, new techniques with improved specificity for receptors for targeted therapy are needed. These new imaging agents may help identify patients who would respond to (or are resistant to) targeted therapy. 1,2 As an example, development of new monoclonal antibodies (mAbs) has been an active area of research due to the success in therapeutic applications. These agents are specific against key molecular targets which are overexpressed or unique to tumor cells. 1,3
The clinical value of mAbs is usually based on target-specific mechanisms that trigger a blockade of cell proliferation. 2,4 Several targets, such as B-lymphocyte antigen CD20, vascular endothelial growth factor (VEGF), and epidermal growth factor receptor (EGFR), have been successfully targeted in specific malignancies with effective mAbs. 1 Cetuximab is an IgG1 chimeric mAb against the EGFR, a tyrosine kinase receptor that plays an important role in cellular proliferation, DNA repair, and regulation responses to hypoxia. 5,6 This cell surface receptor is overexpressed in many types of cancer: nonsmall cell lung cancer, epithelial ovarian cancer, and in more than 90% of head and neck squamous cell carcinoma (HNSCC). 6
Cetuximab was approved by the Food and Drug Administration (FDA) in 2004, as a single drug or in combination with chemotherapy for treatment of colorectal and HNSCC or in combination with external radiotherapy for HNSCC. 7 According to the World Health Organization, HNSCC is the fifth most common cancer worldwide, with an overall annual occurrence of 980,000 new cases. HNSCC patients have several options for therapy, including surgery, chemotherapy, radiotherapy, and targeted therapy, using mAbs. Despite clinical gains arising from use of cetuximab, patients may present inherent or acquired resistance, which increases tumor recurrence rates and limits clinical response. 8 The molecular heterogeneity of HNSCC has diverse implications in terms of possible mechanisms of either intrinsic or acquired resistance to EGFR-targeted inhibitors, several of these have been described, such as the activation of alternative signaling or the aberrance of the downstream pathways. 9 –12 However, some patients with HNSCC whose tumors harbor EGFR mutations have benefitted from anti-EGFR immunotherapy. 13 –15 Therefore, according to Brand et al., determining how to distinguish individuals sensitive to cetuximab is worthy of clinical investigation. 10
The development of noninvasive imaging techniques using mAbs is a swiftly evolving field and a promising method to characterize the status of EGFR expressing tissue. 3,7 Imaging with radiolabeled cetuximab may be of use to evaluate potential treatment resistance and select patients who may respond well to antibody therapy. In addition, imaging using radiolabeled mAbs may enable a personalized medicine approach for targeted therapy. 5,7 The exceptional affinity, specificity, and selectivity of antibodies make them extraordinarily attractive vectors for tumor-targeted radiopharmaceuticals. 16 Radionuclides used for imaging should be selected to match the inherent properties of studied antibodies. 5
Cetuximab has been labeled with different radionuclides for diagnosis: 99mTc (t1/2 = 6 h) 17,18 ; 68Ga (t1/2 = 67.71 min) 19 ; 64Cu (t1/2 = 12.7 h) 20 –24 ; 124I (t1/2 = 100.2 h) 25 –27 ; 111In (t1/2 = 67.2 h) 7,28 –33 ; and 89Zr (t1/2 = 78.4 h). 16,34 –47 mAbs have been labeled with γ-emitting radionuclides and imaged with a single-photon emission computed tomography camera. 17 Positron emission tomography (PET) for mAb imaging offers the potential of higher sensitivity and more accurate quantitation. 48,49 The introduction of PET with mAbs is an attractive novel option to improve diagnostic tumor characterization, because it combines the high sensitivity and resolution of a PET camera with the specificity of a mAb. 45,49 However, for a positron emitter to be appropriate for immuno-PET, it must meet certain requirements, including suitable decay characteristics and chemistry, which should allow facile, efficient, and stable coupling to mAbs. 49 Radionuclides with an ultrashort physical half-life might not be appropriate because of the inability to image at long time points, which is necessary due to the long circulation time of cetuximab with a biologic half-life about 63 h. 7
The interest in positron-emitting radioisotopes with half-lives compatible with antibody imaging has led to an increase in interest in zirconium-89. 89Zr is readily produced via the 89Y(p,n) 89Zr reaction on a cyclotron using a commercially available and 100% naturally abundant 89Y target. 16,48 This radiometal displays highly desirable attributes as an imaging agent: a half-life that matches the pharmacokinetics of antibodies, well-developed radiolabeling chemistry, and a low positron energy (395.5 keV). 38,43 It is relevant to note that 89Zr also emits a high energy, 909 keV γ-ray with a 99% branching ratio. Although this emission does not impact images acquired with the annihilation 511 keV photons, it does require extra attention with regard to transport, handling, and dosimetry. Despite this caveat, ultimately, 89Zr not only has a more satisfactory half-life for imaging with antibodies than 64Cu but can also provide higher resolution images than 124I. 40,41 Moreover, 89Zr is also less expensive to produce, and it residualizes in tumors more effectively than its radioiodine counterpart. 16,40,49 Regarding the dosimetry concern to the patient, several clinical trials have demonstrated the feasibility and safety of 89Zr-radiolabeled antibodies (administered activities of 37–74 MBq). 38,40,46 Due to the numerous advantages of 89Zr-based antibody imaging, its clinical potential is advancing, leading to an exciting strategy to improve diagnostic imaging and to assess target expression. 34,40,42,43,50
The potential of EGFR as a target for both imaging and therapy has been an active area of investigation. Cetuximab, in particular, has been the focus of a number of imaging studies for the purpose of monitoring disease, EGFR expression, patient selection or performing dosimetry calculations for targeted therapy trials. 51 In this work, the authors conducted proof-of-principle studies in animal models to assess the use of 89Zr-DFO-cetuximab as a molecular imaging agent to monitor developed resistance in HNSCC during therapy with cetuximab.
Materials and Methods
Antibodies and reagents
The production of 89Zr-oxalate was carried out in house (University of Alabama at Birmingham [UAB] Cyclotron Facility) from the 89Y(p,n)89Zr reaction using 89Y sputtered targets as described previously. 52 Cetuximab (Erbitux®; Bristol-Myers Squibb) was purchased from Merck (Darmstadt, Germany). Anti-EGFR (EP384; ab52894) was purchased from Abcam (Cambridge, MA); anti-β actin (sc-47778 HRP) and goat anti-rabbit IgG-HRP (sc-2054) antibodies for Western blotting (WB) were purchased from Santa Cruz Biotechnology (Dallas, TX). Desferrioxamine-p-benzyl-isothiocyanate (DFO-Bz-NCS) was purchased from Macrocyclics (Dallas, TX). Dimethyl sulfoxide (DMSO) and sodium carbonate were purchased from Sigma-Aldrich (St. Louis, MO). HEPES was purchased from ACROS Organic (Fair Lawn, NJ). All other chemicals were purchased from Fisher Scientific (Hampton, NH) unless stated otherwise.
Cell lines and development of cetuximab resistance
The FaDu human squamous carcinoma cell line was purchased from American Type Culture Collection (ATCC) and cultivated in Iscove's Modified Dulbecco's Medium (IMDM) with 10% fetal bovine serum (FBS) and gentamycin (50 mg/mL) in a humidified incubator with 5% CO2 at 37°C. All other reagents for cell culture were purchased from Gibco® Life Technologies (Grand Island, NY).
To develop acquired resistance, FaDu cells were kept in culture with fresh medium containing 0.2 mg of cetuximab added twice a week for 7 months 53 (Supplementary Fig. S1). To confirm resistance, a specific binding assay was performed monthly as described below. Three days prior the specific binding assay, the medium containing cetuximab was removed, the cells were washed two times with phosphate-buffered saline (PBS), trypsinized and plated into a 12-well plate with fresh medium without cetuximab. This procedure was performed to avoid cetuximab interference in the specific binding assay.
Once the cells became resistant, the cetuximab was removed from the culture medium, and the cells were split several times to conclude the in vivo experiments.
Preparation of 89Zr-DFO-cetuximab
Cetuximab was conjugated to DFO-Bz-NCS and labeled with 89Zr-oxalate according to previous methods. 25,30 In brief, fivefold molar excess of DFO-Bz-NCS dissolved in DMSO was conjugated to cetuximab in 0.1 M sodium carbonate buffer (pH 9) at 37°C for 1 h. After conjugation, excess DFO was removed via Zeba spin desalting columns (40 kDa Molecular Weight Cut-Off; Thermo Scientific, Rockford, IL) using 1 M HEPES buffer pH 7.1–7.3 as eluent. The final concentration of protein was determined using a bicinchoninic acid (BCA) assay (Thermo Scientific). The purified DFO-cetuximab was labeled with neutralized 89Zr-oxalate (0.148 MBq/μg) at 37°C for 1 h. The resulting 89Zr-DFO-cetuximab was purified using desalting columns and the radiochemical purity was determined by instant thin-layer chromatography using 50 mM DTPA as the developing solution.
In vitro-specific cell binding
The specific binding of 89Zr-DFO-cetuximab was assessed in FaDu cetuximab-sensitive (FCS) and FaDu cetuximab-resistant (FCR) cells in vitro. Cells (1 × 10 5 ) were plated in a 12-well plate 48 h before the experiment and kept in culture as described above. On the day of the experiment, they were incubated with 89Zr-DFO-cetuximab (5.5 nM; 0.12 MBq/mL in IMDM, 1% FBS) alone (total binding) or in presence of cold cetuximab (2.75 μM in IMDM or Dulbecco's modified Eagle's medium [DMEM] 1% FBS; competitive binding) for 3 h in a humidified incubator with 5% CO2 at 37°C. Cells were washed with PBS, trypsinized, and assayed in a gamma counter (Wizard 2 ; Perkin Elmer, Waltham, MA). The percentage of 89Zr-DFO-cetuximab bound to cells in presence or absence of competitor was calculated and corrected for protein concentration.
Western blotting
FCS and FCR cells were lysed with RIPA buffer (Alfa Aesar) and the concentration in the extracted lysates was measured by BCA assay. Proteins (20 μg) were loaded onto 7.5% Mini-PROTEAN TGX Stain-Free precast gels (Bio-Rad, Hercules, CA) in Tris/Glycin/SDS buffer for electrophoresis. Following electrophoresis, the proteins were transferred onto PVDF membranes gels (Bio-Rad) and blocked with nonfat dry milk (NFDM) diluted in PBST at 3% concentration for 1 h at room temperature. The membranes were incubated with anti-EGFR primary antibody (1:2000 in 3% NFDM) overnight at 4°C. After the incubation, membranes were washed and incubated with goat anti-rabbit HRP-conjugated anti-rabbit antibody (50 ng/mL in 3% NFDM) and anti-β actin (100 ng/mL in 3% NFDM) for 1 h at room temperature. After three to five washing cycles with PBST, the membranes were incubated with a chemiluminescent WB detection reagent (ECL Select, GE Healthcare, Chicago, IL) according to manufacturer's instructions and read using a ChemiDoc XRS+ imager (Bio-Rad). The EGFR bands were normalized by the amount of protein loaded (β-actin band) using Image software (National Institutes of Health, Bethesda, MD).
Fluorescent immunohistochemistry technique
Approximately 2 × 10 4 of both cell lines (FCS and FCR) were seeded on Falcon™ Chambered Cell Culture Slides overnight. The cell lines were washed three times with ice cold PBS, and with paraformaldehyde solution 4% for 10 min at room temperature. After fixation step, slides were washed three times in PBS and then permeabilized with Triton-X solution 0.25% (Sigma-Aldrich) in PBS for 10 min. Unspecific protein block was performed using Novocastra Protein Block solution (Leica Biosystems, Buffalo Grove, IL) for 30 min. The cells were incubated with anti-EGFR (31G7) ready to use (Invitrogen, Carlsbad, CA) overnight. Cells were washed three times with PBS and incubated in Alexa488-conjugated anti-mouse secondary antibody (Molecular Probes) at 1:1000 dilution for 1 h at room temperature. Nuclear counterstain was carried out with DAPI as a mounting reagent (Molecular Probes). The fluorescence microscopy images were conducted using the IN Cell Analyzer 2200 (GE Healthcare).
Animal studies
All animal experiments were performed with the approval of the Institutional Animal Care and Use Committee of the UAB.
Five-week old female NU/NU nude mice (Charles River, Wilmington, MA) were subcutaneously implanted with 5 × 10 5 FCR or FCS cells (four mice for each group). Tumors were allowed to grow for 2 weeks and mice were injected via tail vein with 2.22 MBq of 89Zr-DFO-cetuximab (corresponding to 15 μg of cetuximab). After 3- and 5-d postinjection (p.i.), mice were imaged using a GNEXT small animal PET/computed tomography (CT; Sofie Biosciences, Culver City, CA). Immediately after imaging, mice were euthanized; tumors and select organs were collected, weighed, and analyzed in a gamma counter to measure radioactivity. The in vivo study design is shown in Figure 1.
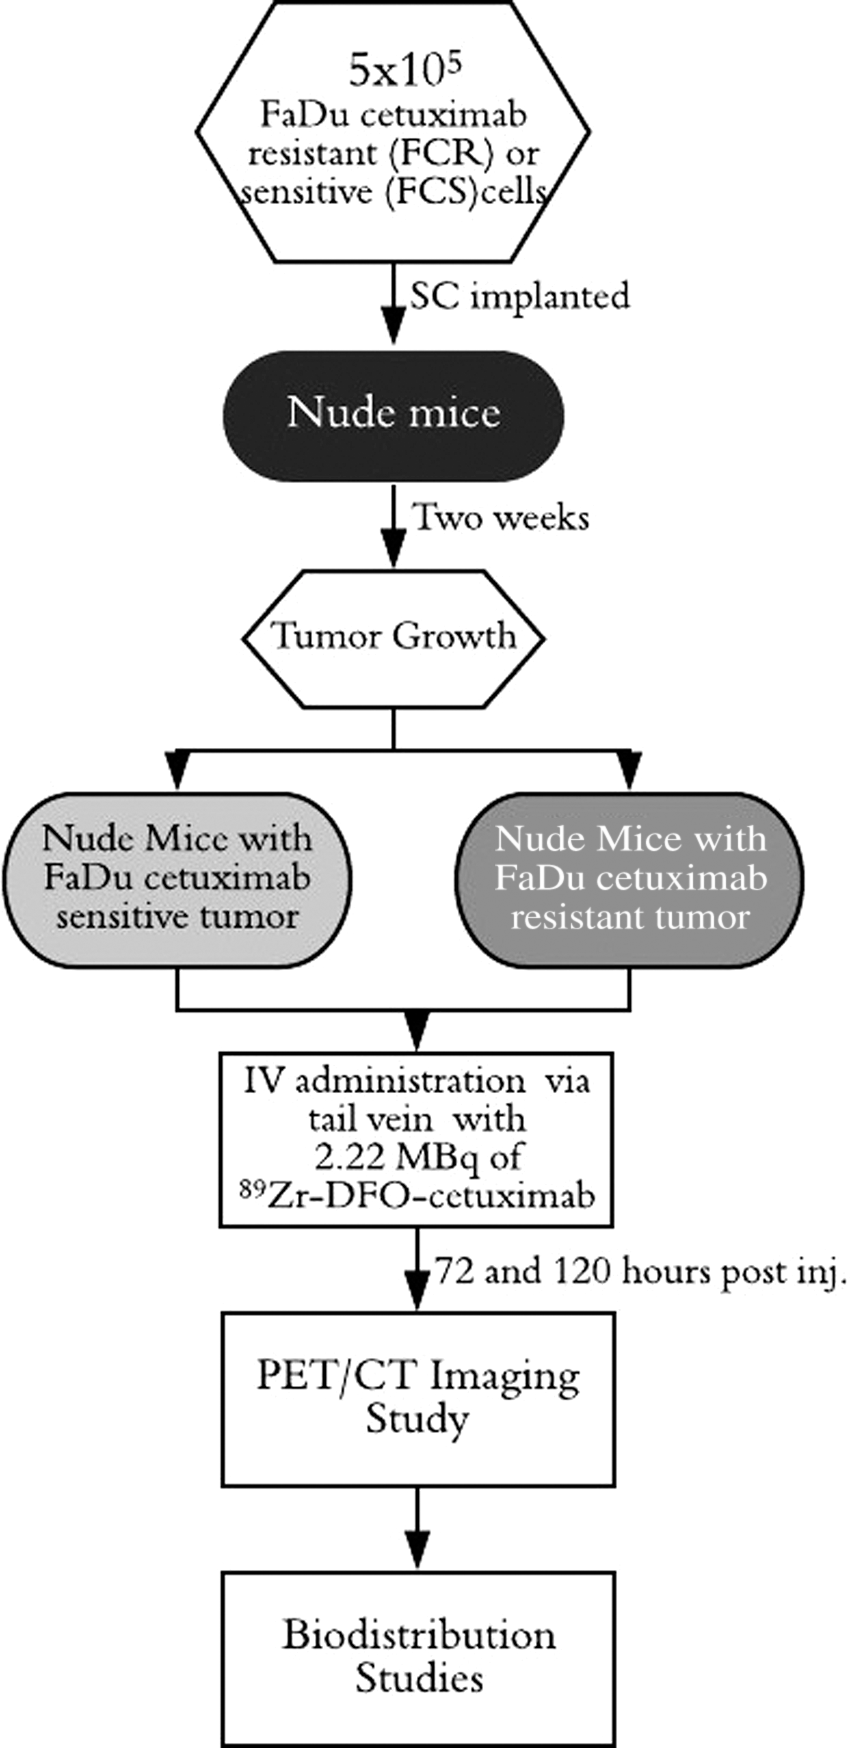
Schematic representation of the in vivo study in NU/NU nude mice.
Statistical analysis
For simple comparison, the student t-test was used. For multiple comparisons, one-way analysis of variance was performed followed by group comparisons using the Bonferroni method to control multiple comparisons. Statistical analysis was performed using GraphPad Prism version 7.04 (GraphPad Software, Inc., La Jolla, CA).
The results are expressed as mean ± standard error of the mean. Differences were regarded as statistically significant for p < 0.05.
Results
89Zr-DFO-cetuximab: radiochemical yield
89Zr-DFO-cetuximab was produced with ≥95% radiochemical yield and specific activity of 0.148 MBq/μg.
Specific cell-binding studies of 89Zr-DFO-cetuximab in vitro
The specificity of 89Zr-DFO-cetuximab was investigated in vitro by comparing its binding in FCS and FCR cells (Fig. 2). Cell uptake studies demonstrated significant lower uptake of 89Zr-DFO-cetuximab in FCR cells (p < 0.0001). This is feasible to observe in total binding assay, since the percentage uptake per ng of protein was higher by six times in FCS cells when compared to FCR cells.
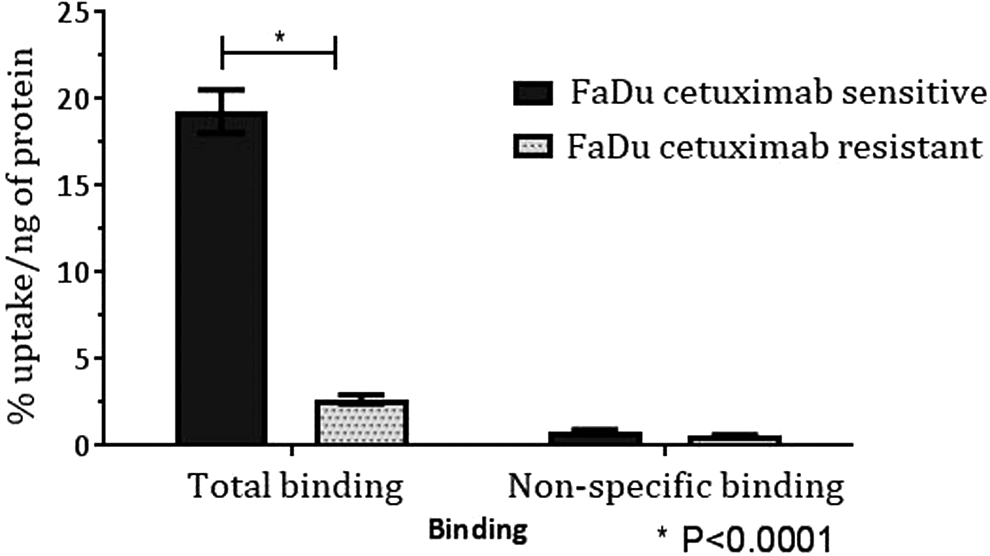
In vitro cell uptake assay of 89Zr-DFO-cetuximab uptake in FCS and FCR cells. FCR, FaDu cetuximab resistant; FCS, FaDu cetuximab sensitive.
Quantification of in vitro EGFR expression
EGFR expression on cell lines was assessed by WB (Fig. 3) in FCR and FCS cells. FCS presented significantly higher in vitro EGFR expression (EGFR-to-actin ratio: 1.049 ± 0.353) than FCR (EGFR-to-actin ratio: 0.476 ± 0.126) which suggests EGFR downregulation in FCR (p = 0.038). WB results imply that cetuximab induces resistance by EGFR downregulation in FaDu cells, and these outcomes corroborate with other studies previously published 54,55 (Supplementary Fig. S2).
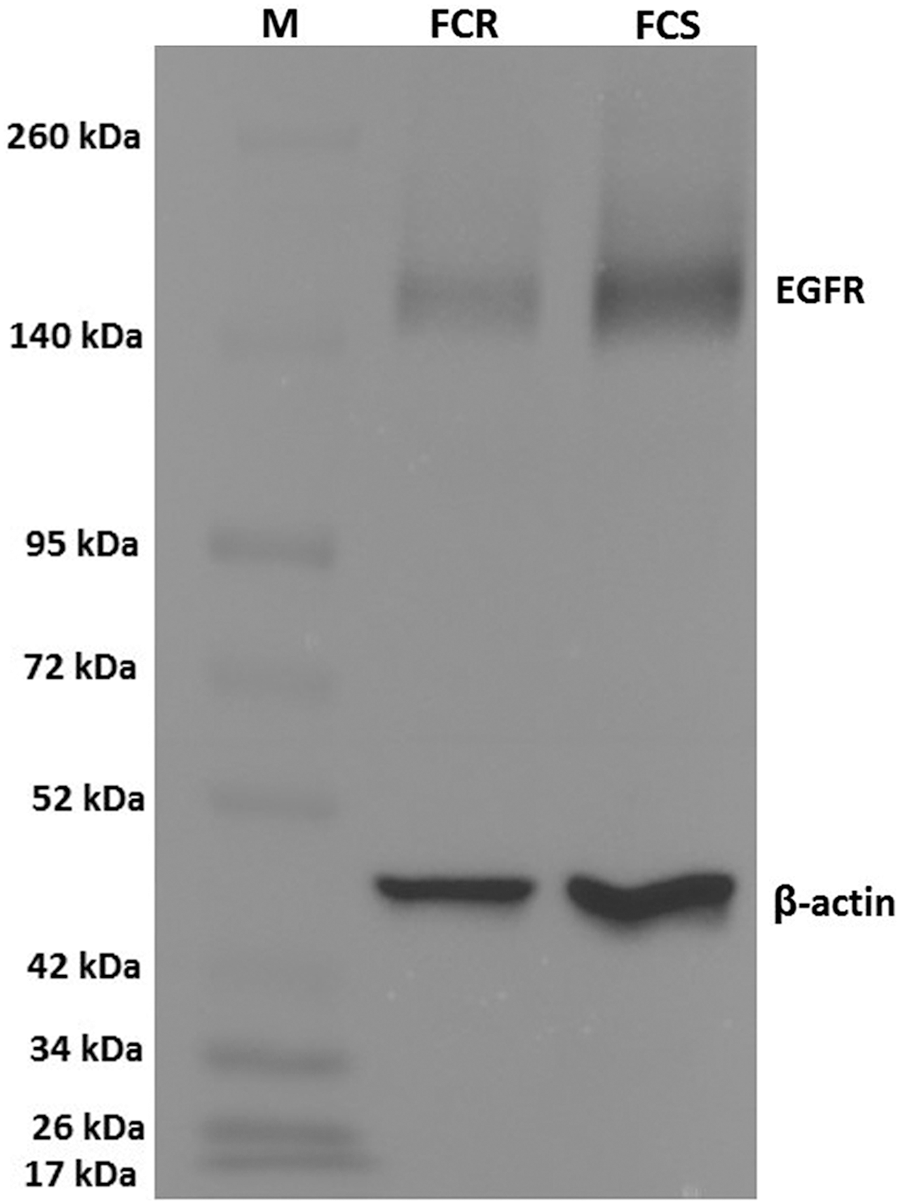
Representative Western blotting of FCS and FCR cells. M, molecular weight marker.
Cell uptake studies demonstrated a correlation between EGFR expression in vitro and 89Zr-DFO-cetuximab uptake. This result is consistent with the low uptake of 89Zr-DFO-cetuximab in FCR cells.
Fluorescent immunohistochemistry technique
The immunofluorescence assay was performed to access EGFR localization and to detect a fluorescent labeling of EGFR in FaDu sensitive cell line (FCS). Higher levels of membranous and cytoplasmic EGFR in FCS were observed when compared with the FCR (Fig. 4). Both cell lines were stimulated with EGF, and a difference in nuclear EGFR expression levels was detected, with the FaDu resistance cell line showing an exclusive nuclear labeling.
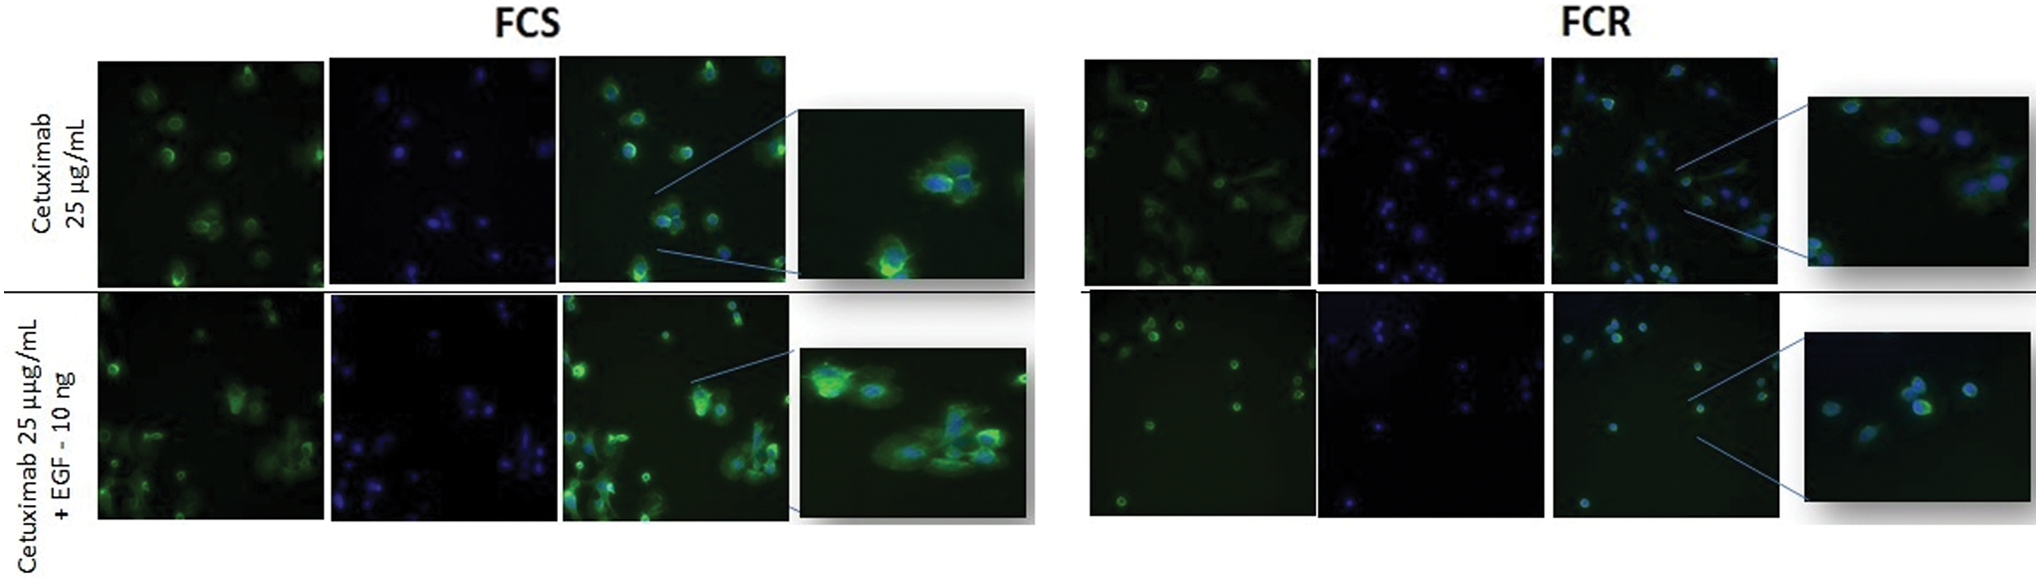
Comparative fluorescent immunohistochemistry assay in FCS and FCR cells to access EGFR localization. EGFR, epidermal growth factor receptor. Color images are available online.
In vivo uptake of 89Zr-DFO-cetuximab: imaging study
To evaluate the potential of 89Zr-DFO-cetuximab as an imaging agent, and to compare the uptake of 89Zr-DFO-cetuximab in resistant cells, imaging studies in mice bearing FCR or FCS xenografts were performed.
The tumor model was developed without the need for exogenous stimuli, and fast tumor growth was observed. After 2 weeks, FCR group present a tumor size of 63.07 ± 7.25 mm3 and FCS 296.7 ± 6.71 mm3.
The in vivo uptake of 89Zr-DFO-cetuximab was assessed by performing PET/CT at 3 and 5 d p.i. of 2.22 MBq of 89Zr-DFO-cetuximab in tumor-bearing mice (Fig. 5A, B). A clear accumulation of 89Zr-DFO-cetuximab was found in the cetuximab sensitive tumors (FCS). FCS tumors showed higher mean standard updated value (0.26 ± 0.05; 3 d p.i.) compared with FCR tumors (0.13 ± 0.01; 3 d p.i), with a significant difference between the groups (p < 0.05). The radiotracer uptake was also observed in normal tissues such as the liver, likely due to hepatobiliary clearance of the antibody. 44

Representative small-animal PET images
Biodistribution studies
Biodistribution studies with 89Zr-DFO-cetuximab were performed in NU/NU nude mice bearing FCS and FCR tumors at 3 and 5 d p.i. 89Zr-DFO-cetuximab had similar biodistribution profile in normal organs of mice implanted with both cell lines (Fig. 6) (p > 0.05).
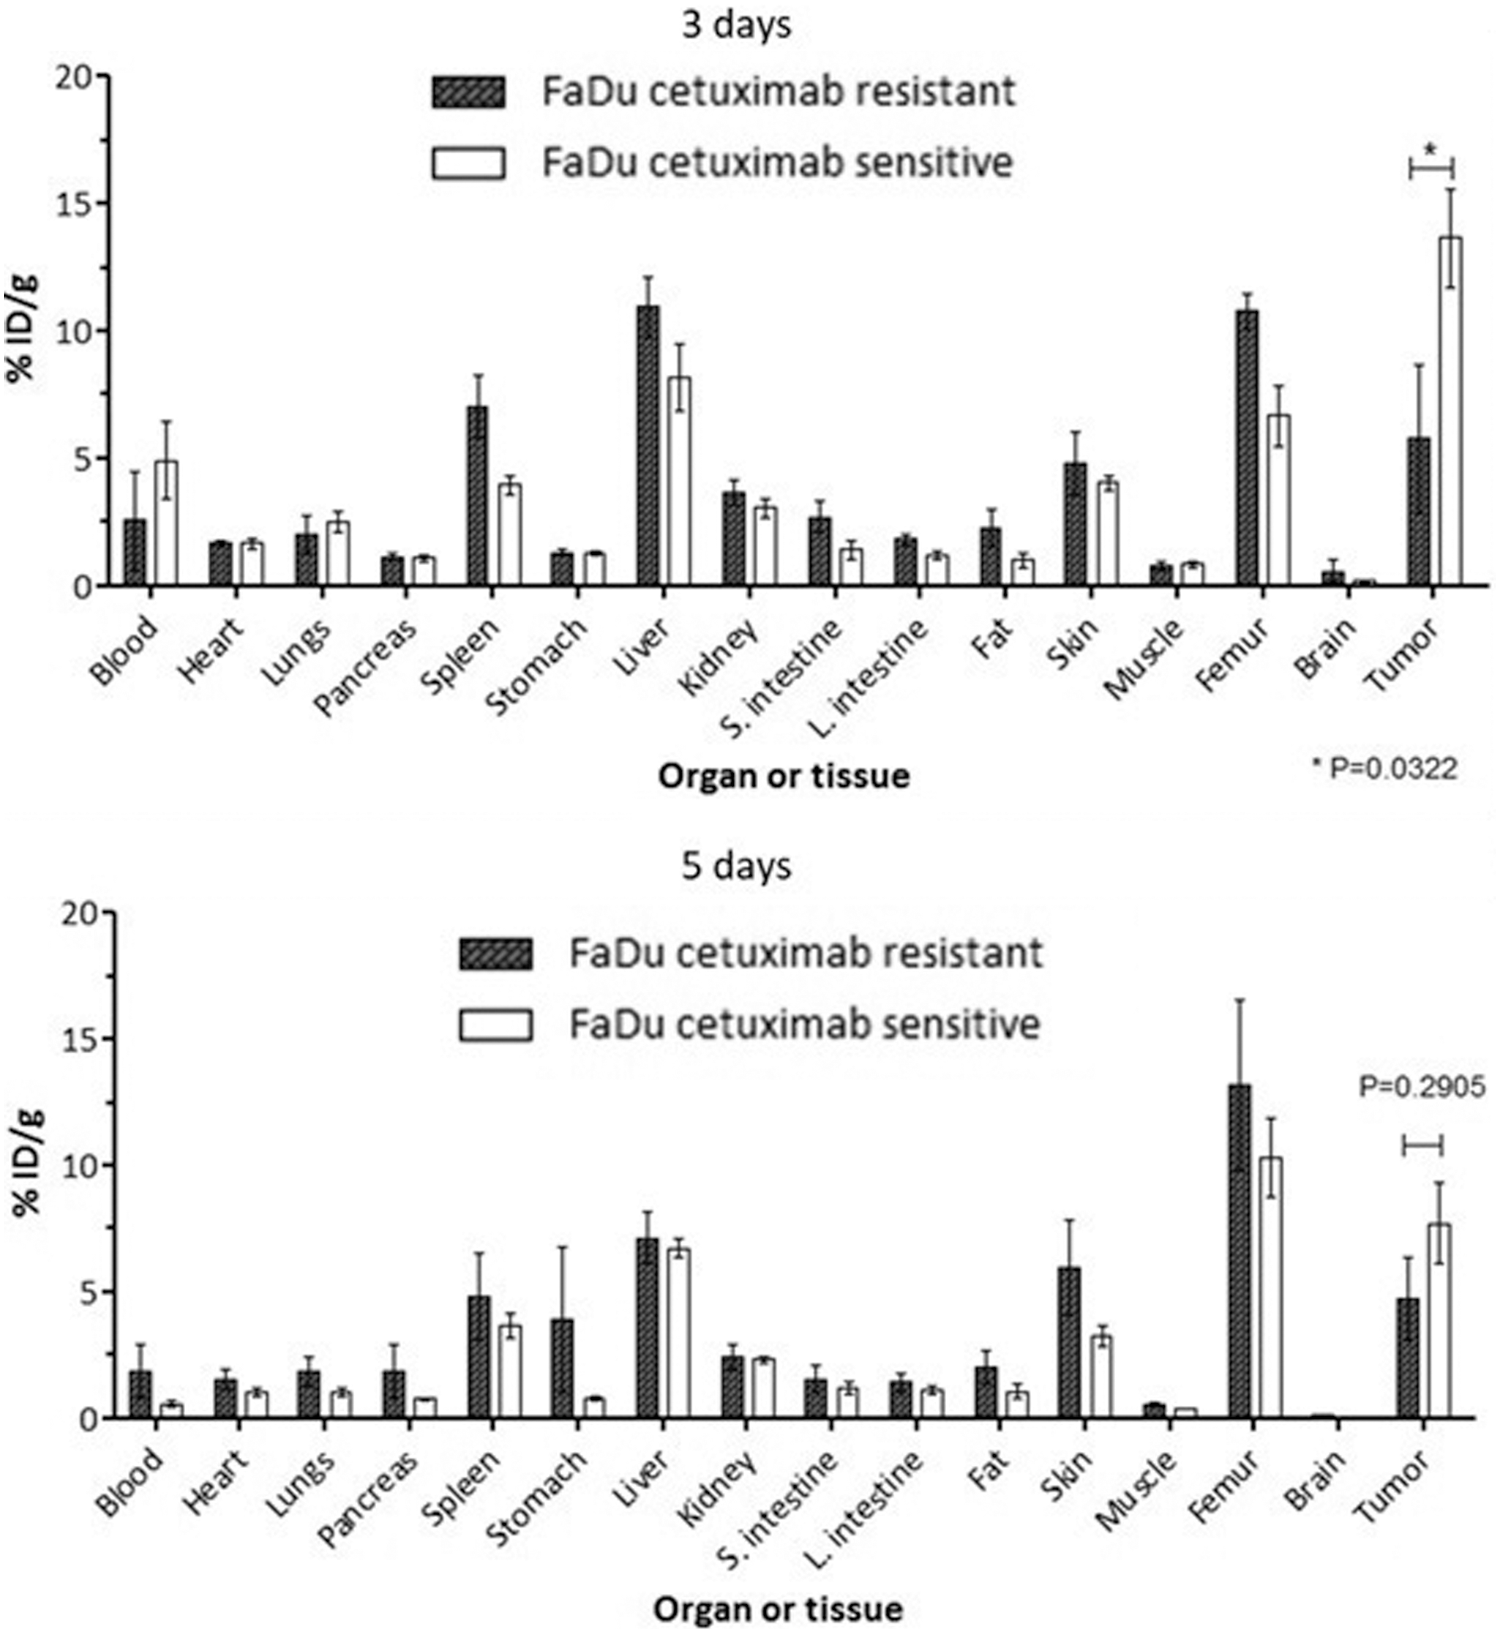
Biodistribution data of 89Zr-DFO-cetuximab in FCS and FCR xenograft models at 3 and 5 d p.i. Data are expressed as percent injected dose per gram ± standard deviation, n = 4 for each time point.
For the FCS group, the circulating levels of 89Zr-DFO-cetuximab in the blood declined from 4.93% ± 3.03% injected dose (ID)/g at 3 d p.i. to 0.57% ± 0.26% ID/g at 5 d p.i. (p = 0.0215). Spleen uptake was 3.98% ± 0.78% ID/g and 3.66% ± 0.93% ID/g at 3 and 5 d p.i., respectively (p > 0.05). Liver accumulation of 89Zr-DFO-cetuximab was 8.18% ± 2.59% ID/g at 3 d p.i. and declined to 6.75% ± 0.69% ID/g at 5 d p.i. (p > 0.05). Notable uptake was also found in the kidney (3.08% ± 0.72% ID/g and 2.341% ± 0.24% ID/g at 3 and 5 d p.i., respectively (p > 0.05). Bone uptake was 6.70% ± 2.38% ID/g at 3 d and 10.32% ± 3.10% ID/g at 5 d p.i. (p > 0.05).
For the FCR group, the circulating levels of 89Zr-DFO-cetuximab in the blood declined from 2.57% ± 3.84% ID/g at 3 d p.i to 1.88% ± 2.12% ID/g at 5 d p.i. (p > 0.05). Spleen uptake was 7.06% ± 2.50% ID/g and 4.82% ± 3.50% ID/g at 3 and 5 d p.i., respectively (p > 0.05). Liver accumulation of 89Zr-DFO-cetuximab was 10.94% ± 2.35% ID/g at 3 d p.i. and declined to 7.13% ± 2.07% ID/g at 5 d p.i. (p > 0.05). Bone uptake was 10.79% ± 1.41% ID/g at 3 d and 13.21% ± 6.73% ID/g at 5 d p.i. (p > 0.05). Tumor uptake of 89Zr-DFO-cetuximab in FCS group (13.66% ± 3.80% ID/g) was significantly higher (p = 0.0322) than FCR group (5.78% ± 5.09% ID/g) at 3 d p.i.
To assess the imaging potential of 89Zr-DFO-cetuximab, the tumor-to-blood (T/B), tumor-to-liver (T/L), and tumor-to-femur (T/F) ratios were evaluated. As shown in Figure 7, a decreasing blood uptake were found in FCS group (p = 0.0215), resulting in larger T/B ratios with time for the EGFR-positive tumors (Fig. 7). The mean tumor-to-mean blood ratio for FCS increased substantially after 5 d p.i. (13.56). The FCS group showed a significantly greater mean T/B ratio than FCR group at 5 d p.i. (p < 0.01).
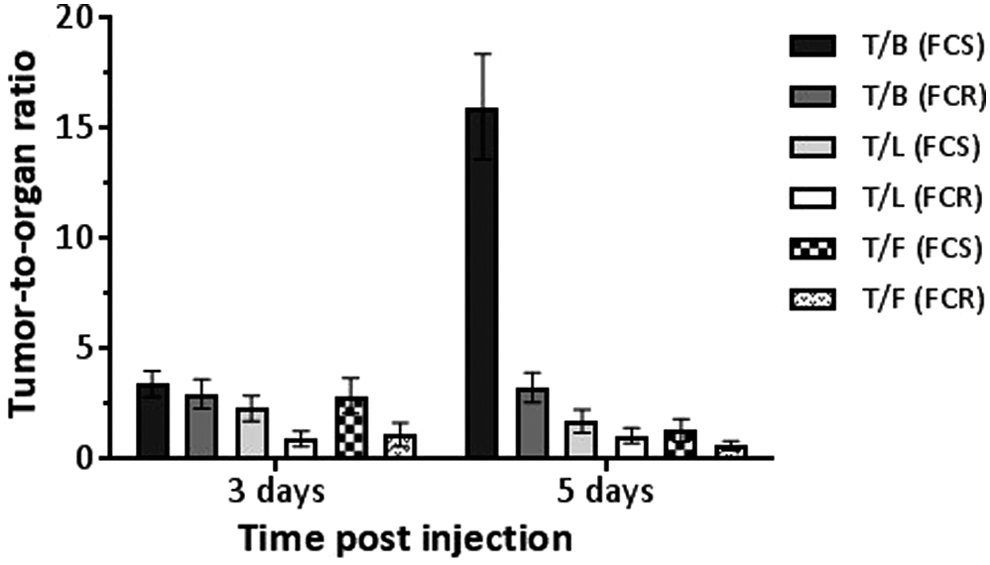
T/B, T/L and T/F ratios of injected 89Zr-DFO-cetuximab in mice bearing FCS and FCR tumor xenografts at 3 and 5 d p.i. Data are expressed as percent injected dose per gram (or cm3) ± standard deviation, n = 4 for each time point. T/B, tumor-to-blood; T/F, tumor-to-femur; T/L, tumor-to-liver.
The T/L ratio was higher in the FCS group (1.67). Similarly, the FCS group presented a higher T/F ratio than FCR group (2.04 compared to 0.54, considering 3 d p.i.). However, no significant change in mean T/L and T/F ratios was observed as a function of time in both groups (p > 0.05).
Discussion
The EGFR is highly expressed in a significant number of human malignancies, and its expression is associated with tumor aggressiveness and overall treatment resistance. 5 –7 Discerning a patient's EGFR mutation status and the mechanism of acquired resistance is critical for effective disease management. Resistance most often arises through secondary mutations in EGFR, which account for 50% of the resistance mechanisms. 56 Studies have revealed that downregulation of EGFR levels in lung cancer patient has a clinically relevant impact because these patients, with this mode of resistance, may not benefit from second- or third-generation EGFR-targeted TKIs. 57,58 Activation of MAPK8 has been previously reported as a potential bypass mechanism in lung cancer cell lines that are addicted to EGFR. 58 The use of noninvasive imaging techniques to identify cetuximab resistance profile can motivate improved patient theranostics and may ultimately lead to new treatment options.
Thus, the development of methods that can distinguish individuals sensitive to the EGFR-targeting antibody, cetuximab, may help to tailor the best therapeutic approach for each patient. Noninvasive quantification of cetuximab uptake could provide important diagnostic information for patient selection and therapy evaluation. For this study, 89Zr-DFO-cetuximab was proposed as a molecular imaging agent to monitor resistance in HNSCC during therapy with cetuximab.
In this study, to reproduce the resistance mechanism of tumor cells to anti-EGFR therapy, a cetuximab-resistant cell line was developed, according to prior experiments conducted of the Oncology Research Center of the Hospital de Cancer de Barretos/Brazil. 53 The authors' findings illustrate that 89Zr-DFO-cetuximab was able to differentiate between tumors sensitive and resistant to cetuximab. The in vitro and in vivo studies suggest a correlation between EGFR expression and 89Zr-DFO-cetuximab uptake, resulting in low accumulation of the tracer in FCR cells.
EGFR expression quantification (assessed through WB) and in vitro cell studies and analysis demonstrated a correlation between EGFR expression and 89Zr-DFO-cetuximab uptake (Figs. 2 and 3). In vivo studies were performed in mice bearing FCR or FCS xenografts. Similar to in vitro results, a correlation was observed between EGFR expression and tumor uptake of 89Zr-DFO-cetuximab by small animal PET/CT imaging as shown in Figure 5. Benedetto 59 previously performed the blocking study, and the small animal PET/CT images have revealed a reduction in uptake profile for “blocking” group (with an excess of unlabeling cetuximab) and an intense 89Zr-DFO-cetuximab uptake in FCS for “non-blocking” group, that illustrated the in vivo radioimmunoconjugate specificity. A higher level of radiotracer accumulation was observed in the FCS compared with FCR tumors. Nonuniform tumor growth rate may have contributed to the observed tumor uptake difference between FCS and FCR groups at 5 d postinjection. FCS tumors grew faster than FCR, in this sense, the tumor size might have interfered in this result.
Diversified approaches have been evaluated for the EGFR imaging. Anti-EGFR mAbs radiolabeled with 111In, 64Cu, 124I, and 89Zr have demonstrated specificity, however, limitations were observed in some of these studies, due to the type of emission or physical half-life of the radionuclide. 25,34,45,49 PET technology provides better resolution, however, maintenance of the antibody's in vivo binding and biodistribution characteristics is imperative, while the physical half-life (t1/2) of the positron emitter should be compatible with the time needed for a mAb to achieve optimal tumor-to-nontumor ratios (typically 2.5 d). 7,49
Cetuximab has been previously labeled with 64Cu and has proved promising in preclinical investigations, although the 64Cu physical half-life may be somewhat short for clinical imaging studies. 16 The half-lives of longer-lived positron emitters such as 124I and 89Zr have a much closer match with the biologic half-life of most intact antibodies. 41 Moreover, 64Cu had a high liver uptake, ranging from 15% to 47% ID/g. 60 In the current study, the liver uptake was low when compared to the studies performed with 64Cu, 60 probably due to the fact that 89Zr is relatively bioinert compared to copper, and it may be less likely to react with the liver proteins. The liver uptake values observed in this study are in close agreement with Aerts et al., in previous preclinical work with 89Zr-labeled cetuximab 44 and with England, who recently reported similar liver uptake values with 89Zr-radiolabeled antibodies (8.49 ± 0.79% ID/g). 61
The renal uptake observed is likely related to liver accumulation, suggesting that the radiotracer undergoes a hepatic metabolism and subsequent metabolites are eliminated through the urine. 45,61 Bile secretion is an important route of IgA clearance, but not significant for IgG, which explains the low uptake of 89Zr-DFO-cetuximab in the intestines. 40,45 The high uptake in bone is expected since zirconium is a bone seeker. 43 The release of osteophilic Zr4+ in vivo leads to accumulation of the cation in the bone. In the comparative studies, Perk et al. 45 reported lower stability of the 89Zr-DFO complex compared to the 88Y- and 177Lu-DOTA complexes, which was reflected in a significantly higher bone accumulation of 89Zr compared to 88Y and 177Lu. In this study, the percent ID/g, 3 d p.i. (for FCS), was lower than 7%, and this bone uptake did not compromise the resulting image quality (Fig. 6).
The advances in noninvasive diagnostic methods of the past decade are showing signs of bringing developments in therapy. 43 Diagnostic information can assist in the selection of patients, and it can potentially predict the risk-benefit balance of a planned therapy with radionuclides through the dosimetric analysis. 50,51 In addition, the imaging data can aid with evaluation of the therapeutic response to a particular treatment and can guide the planning and therapeutic administration. 49 Therefore, 89Zr-DFO-cetuximab may be used to noninvasively examine uptake of cetuximab into the tumor, thus allowing selection of patients who are or become resistant to anti-EGFR immunotherapy. In this regard, identification of these patients who can potentially benefit from cetuximab treatment is essential to tailor the best therapeutic approach.
Conclusions
In this work, 89Zr-DFO-cetuximab was produced with high radiochemical yield for use in in vitro and in vivo studies. This study has demonstrated that cetuximab uptake in tumors can be assessed by PET using 89Zr-labeled cetuximab, which corroborates the cetuximab resistance of HNSCC due to EGFR downregulation. In conclusion, 89Zr-DFO-cetuximab is a suitable radiopharmaceutical to identify these downregulation in vitro and in vivo models. This radiopharmaceutical may be useful for monitoring resistance in HNSCC patients during therapy with cetuximab; therefore, future clinical studies should be investigated.
Footnotes
Acknowledgments
The authors thank Dr. Lapi's team, especially Cyclotron Facility group, for all the support and assistance in the production of 89Zr and the small animal imaging team for assistance with the preclinical studies. The UAB Small Animal Imaging Shared Facility is supported by NIH grant P30CA013148 awarded to the UAB Comprehensive Cancer Center.
Authors' Contributions
R.B.—Conception: constructing the idea for research and article; Design: planning methodology to reach the conclusion; Analysis and Interpretation: interpretation and presentation of the results; Data Processing: taking responsibility in data management and reporting; Literature Review; Writer: taking responsibility in the construction of the article. A.V.F.M.—Conception: constructing the idea for article; Design: planning methodology to reach the conclusion; Analysis and Interpretation: interpretation and presentation of the results; Data Collection/Processing: taking responsibility in execution of the experiments; writer; review. B.K.C.—Data Collection: execution of the experiments; Review: reviewing the article grammar. R.O.—Conception: constructing the idea for the development of cetuximab resistance cell model. R.M.R.—Conception: constructing the idea for the development of cetuximab resistance cell model; Review: reviewing the article before submission. E.B.A.—Conception: constructing the idea for research; Critical Review: reviewing the article before submission. S.E.L.—Conception: constructing the idea for article; Critical Review: reviewing the article before submission.
Disclosure Statement
The authors declared no potential conflicts of interest with respect to the research, authorship, and/or publication of this article.
Supplementary Material
Supplementary Figure S1
Supplementary Figure S2
References
Supplementary Material
Please find the following supplemental material available below.
For Open Access articles published under a Creative Commons License, all supplemental material carries the same license as the article it is associated with.
For non-Open Access articles published, all supplemental material carries a non-exclusive license, and permission requests for re-use of supplemental material or any part of supplemental material shall be sent directly to the copyright owner as specified in the copyright notice associated with the article.