
Abstract
Objective:
18F-albumin, a vascular imaging agent, may have potential to assess tumor responses to anti-angiogenic therapies. In these studies tumor distribution volume of 18F-albumin were first determined in various human tumor xenografts from biodistribtuion measurments and then one of the tumor type was used to evaluate changes in 18F-albumin uptake in anti-angiognic tumor model.
Method:
18F-albumin was synthesized via conjugation of 6-[18F]fluoronicotinic acid-2,3,5,6-tetrafluorophenyl ester, [18F]F-Py-TFP, with rat albumin. From the biodistribution of 18F-albumin in various human tumor xenografts tumor distribution volumes (DVs; tumor%ID/g:blood%ID/g) were first determined at various time points. Then, the ability of 18F-albumin to detect tumor angiogenic inhibition in one of these tumor types (U87MG) following treatment with sunitinib was evaluated by position emission tomography (PET) imaging at 0, 7, 14, and 21 days post treatment. Caliper measurements of tumor dimensions were also made at these same times. At Day 21, following imaging, biodistributions, autoradiography of tumor tissues and tumor blood vessel counts (CD31 IHC) were performed.
Results:
18F-albumin retention in various tumors steadily increased over time with U87MG tumor exhibiting the highest uptake (DV) at all times. Significant decreases in 18F-albumin DVs were observed one week post-treatement (−39%) vs. controls whereas tumor caliper volumes were not significantly decreased until days 14 and 21. At day 21 the significant decrease in DVs in the treatment group (−44%) paralleled biodistribution DV measurements and was consistent with autoradiography and CD31 IHC findings.
Conclusion:
These data suggest that 18F-albumin DVs obtained by imaging may serve as an early biomarker of the effectiveness of anti-angiogenic therapy and thus aid in patient management and treatment planning.
Introduction
Angiogenesis is a hallmark of cancer and plays a crucial role in supporting tumor growth and proliferation. 1 –3 However, the therapeutic efficacy of antiangiogenic drugs is often determined by changes in tumor volume/size, which can take weeks to months before differences in these measures are detectable by CT or MRI. Thus, there is a need for diagnostic imaging agents that can monitor tumor angiogenesis in real time to aid in patient treatment planning and management. 4,5
Various targeted position emission tomography (PET) imaging agents have been used to monitor angiogenesis. 6 PET radiotracers labeled with 68Ga, 718F, 8 and 64Cu 9 targeted αvβ3 integrins, vascular endothelial growth factor receptors, 10 and matrix metalloproteinases. 11,12 Although target-based imaging agents are specific, imaging efficiency depends upon target density, which can vary widely among tumor types. As a result, such targeted agents may not reliably reflect properties of the tumor vasculature and thereby fail to indicate the therapeutic effects of antiangiogenic agents. 13,14
An alternative to this targeted approach is to use a macromolecule whose accumulation does not vary with tumor type, but depends instead on the enhanced permeability and retention (EPR) effect that arises during growth of abnormal tumor blood vessels. 15,16 One such molecule is albumin, an abundant plasma protein with a long serum half-life. This high-molecular-weight protein is highly retained with normal vasculature as required for any effective blood pool agent. 17,18
In a previous publication, the authors described a new and efficient method for 18F labeling of albumin and proposed its use as a blood pool agent for PET. 19,20 In the present work, the authors evaluate this albumin as a PET imaging agent to measure changes in tumor distribution volumes (DVs) in response to treatment with sunitinib, 21,22 an antiangiogenic therapy.
Materials and Methods
Cell lines and reagents
Lung cancer (NCI-H460), colon cancer (DLD-1), gastric cancer (MKN-45), glioblastoma (U87MG), and prostate cancer (PC3) cells were used for this study. Cells were cultured in RPMI-1640 or DMEM at 37°C in a 5% CO2:95% humidified air atmosphere supplemented with 10% FBS, 1% 2 mM
Radiosynthesis of 18F-albumin
All biodistribution and PET imaging studies were performed using 18F-rat serum albumin synthesized and fully characterized by Basuli et al. 19 Briefly, 18F-albumin was synthesized through coupling of 18F- 2, 3, 5, 6-tetrafluorphenyl 6-fluornicotinate to albumin. The product was purified by a PD10 Minitrap size exclusion column using phosphate buffer (pH 7.4) as an eluent. Product formation was confirmed by analytical HPLC (radiochemical purity >97%).
Mouse tumor models
Athymic female nude mice (NCr-nu/nu; NCI-Frederick, MD) were subcutaneously injected in the right thigh with 4–5 × 10 6 cells of NCI-H460, DLD-1, U87MG, MKN-45, or PC3 in PBS:30% Matrigel. All animal studies were performed in accordance with IACUC-approved protocols.
In vivo biodistribution studies
Tumor-bearing mice were intravenously injected with 18F-albumin (0.37–0.74 MBqs; 10–20 μCi). Postinjection, mice were euthanized (CO2 inhalation) at different time points and a necropsy was performed. Blood/tissues were excised and the radioactive concentration was determined by γ counting (Perkin Elmer 2480 Wizard3). Radioactivity in the blood/tissue was expressed as a differential uptake ratio (DUR) normalized to a 20-g mouse:
The DUR has units of %ID/g and represents the percentage of the injected dose resident in 1 g of tissue. Tissue DVs (DV; dimensionless) were defined for the biodistribution studies as follows:
Statistical analysis of differences between the groups was performed using Student's t-test.
PET imaging studies
Tumor-bearing mice were anesthetized using isoflurane/O2 (1.5%–3% v/v) and imaged (BioPET/CT; Sedecal, Madrid, Spain) at various time points post-18F-albumin injection (i.v; 11.1–14.8 MBqs; 300–400 μCi; anesthetized). ECG-gated cardiac imaging (1 bed position centered over the heart; 5-min duration) was followed by either a static image over the tumor (1 bed position; 5 min) or a whole-body image (2 bed positions; 10 min). The images were reconstructed with the three-dimensional ordered subset expectation maximum (3D-OSEM) algorithm.
23
A small 3D region of interest (ROI) was drawn in the center of the left ventricle of the heart at end diastole, as seen in the gated cardiac images, to determine 18F-albumin blood concentrations (expressed in units of MBq/mL of blood). 3D ROIs were also drawn encompassing the whole tumor, which represented the total radioactive content of the tumor. The total activity in the tumor (in MBq) was then divided by tumor volume (in mL) obtained by caliper measurements [(4l × h × w × π)/3, where l, h, and, w are the length, height, and width radii, respectively]. Tumor DVs by PET imaging were then calculated as follows:
This definition of DV can be reconciled with the slightly different definition of DV used for biodistribution studies by multiplying this DV with the ratio of the density of blood to the density of tumor tissue. In the following work, the authors assume that these densities are equal and use PET and biodistribution DVs interchangeably. Note that in this formula, DVs are dimensionless and not in units of volume. Statistical analysis of differences between imaging groups was determined by Student's t-test.
In vivo treatment study
The U87MG tumor-bearing mice were randomly divided into control and treated groups. The treatment group received sunitinib (60 mg/kg, oral gavage) in vehicle (H2O/HCl = 1:1.02, 0.5% polysorbate, 10% polyethylene glycol; pH adjusted to 3.3–3.7 using NaOH) with a 5-day on–2-day off treatment cycle for 3 weeks. 22 Mice in the therapy and control groups were intravenously injected with 18F-albumin (11.1–14.8 MBqs; 300–400 μCi) and imaged (BioPET, 60 min postinjection) at baseline (day 0) and on days 7, 14, and 21 after initiation of therapy. On the same days as imaging, tumors were measured by caliper and changes in tumor volume (ΔV) were represented as the change from baseline:
At day 21 after 18F-albumin imaging, tissue biodistribution and DVs were determined by γ counting, as described above (in vivo biodistribution studies). Treated and control tumors were then sectioned to determine blood vessel counts by CD31 immunohistochemistry (IHC) staining and to determine an effective DV (DVE, as described in Ex Vivo autoradiography section) by ex vivo autoradiography.
Microvessel density measurements
U87MG xenograft tumors from control and treatment groups were excised and rapidly frozen with isopentane cooled with dry ice (−40°C to −50°C). IHC staining with CD31/PECAM-1 antibody was performed, as previously described. 24 Briefly, the acetone-fixed 20-μm-thick tumor slices were stained with CD31/PECAM-1 antibody. The number of stained vessels in the digitized images (Aperio Scanscope; Aperio, Vista, CA) were then counted (Analysis Toolbox; Aperio) and the results expressed as the number of vessels per square millimeter of the section. Control and treatment vessel counts were compared with Student's t-test.
Ex vivo autoradiography
At the end of the study, excised U87MG tumors were sectioned (20-μm slices), air-dried, and placed on phosphor imaging plates (Fuji BAS-SR2025) overnight. The plates were then read with a Fuji FLA-5100 scanner to produce digitized autoradiographic images. ROIs were drawn on these images to just enclose the entire slice and the result expressed in total photostimulated luminescence (PSL) units using Image Gauge 4.0 (Fujifilm, Tokyo, Japan). A constant calibration factor (C, cpm/PSL) was then obtained as the slope of the best fit line from a plot of autoradiogram PSL values of a single section (6–12 sections) and counts per minutes (by γ counting) of a section adjacent to the one chosen for autoradiography. An effective DURsection (% injected dosenormalized to a 20g mouse/mm 2 ) for each section was then determined by the following equation:
An effective distribution volume, DVE, for each slice was obtained by dividing the DURsection by the blood DUR (determined by γ counting) from the same mouse:
where DVE is grams of blood per square mm of tumor tissue. Statistical analysis of the difference between groups was performed using Student's t-test.
Results
Biodistribution of 18F-albumin in different tumor types
Biodistribution of 18F-albumin was determined in U87MG, NCI-H460, MKN-45, PC3, and DLD-1 tumor xenografts at 15, 30, 60, and 120 min postinjection. Tissue DURs and DVs of 18F-albumin in mice bearing U87MG tumors are shown in Figure 1. The highest DUR of 18F-albumin was observed in blood at all times after injection (Fig. 1A and Supplementary Table S1. The blood residence half-time of 18F-albumin determined by single exponential fit to the blood results in Figure 1A was 3.6 h (y = 42.35e−0.00325x ; R 2 = 0.94). Heart, lungs, spleen, and kidneys showed the next highest 18F-albumin DURs, but much lower than blood at the same times. The femur DUR was low with little change over time, suggesting that 18F-albumin is stable in vivo with low defluorination, a result consistent with previous work confirming serum stability of 18F-albumin. 19 With the exception of U87MG tumors, DURs of all other tissues/organs remained relatively constant or decreased slowly over time. Tumor DURs increased significantly with time from 4.2%ID/g at 15 min to 8.4%ID/g at 120 min, respectively (p < 0.0001; n = 5 per group).
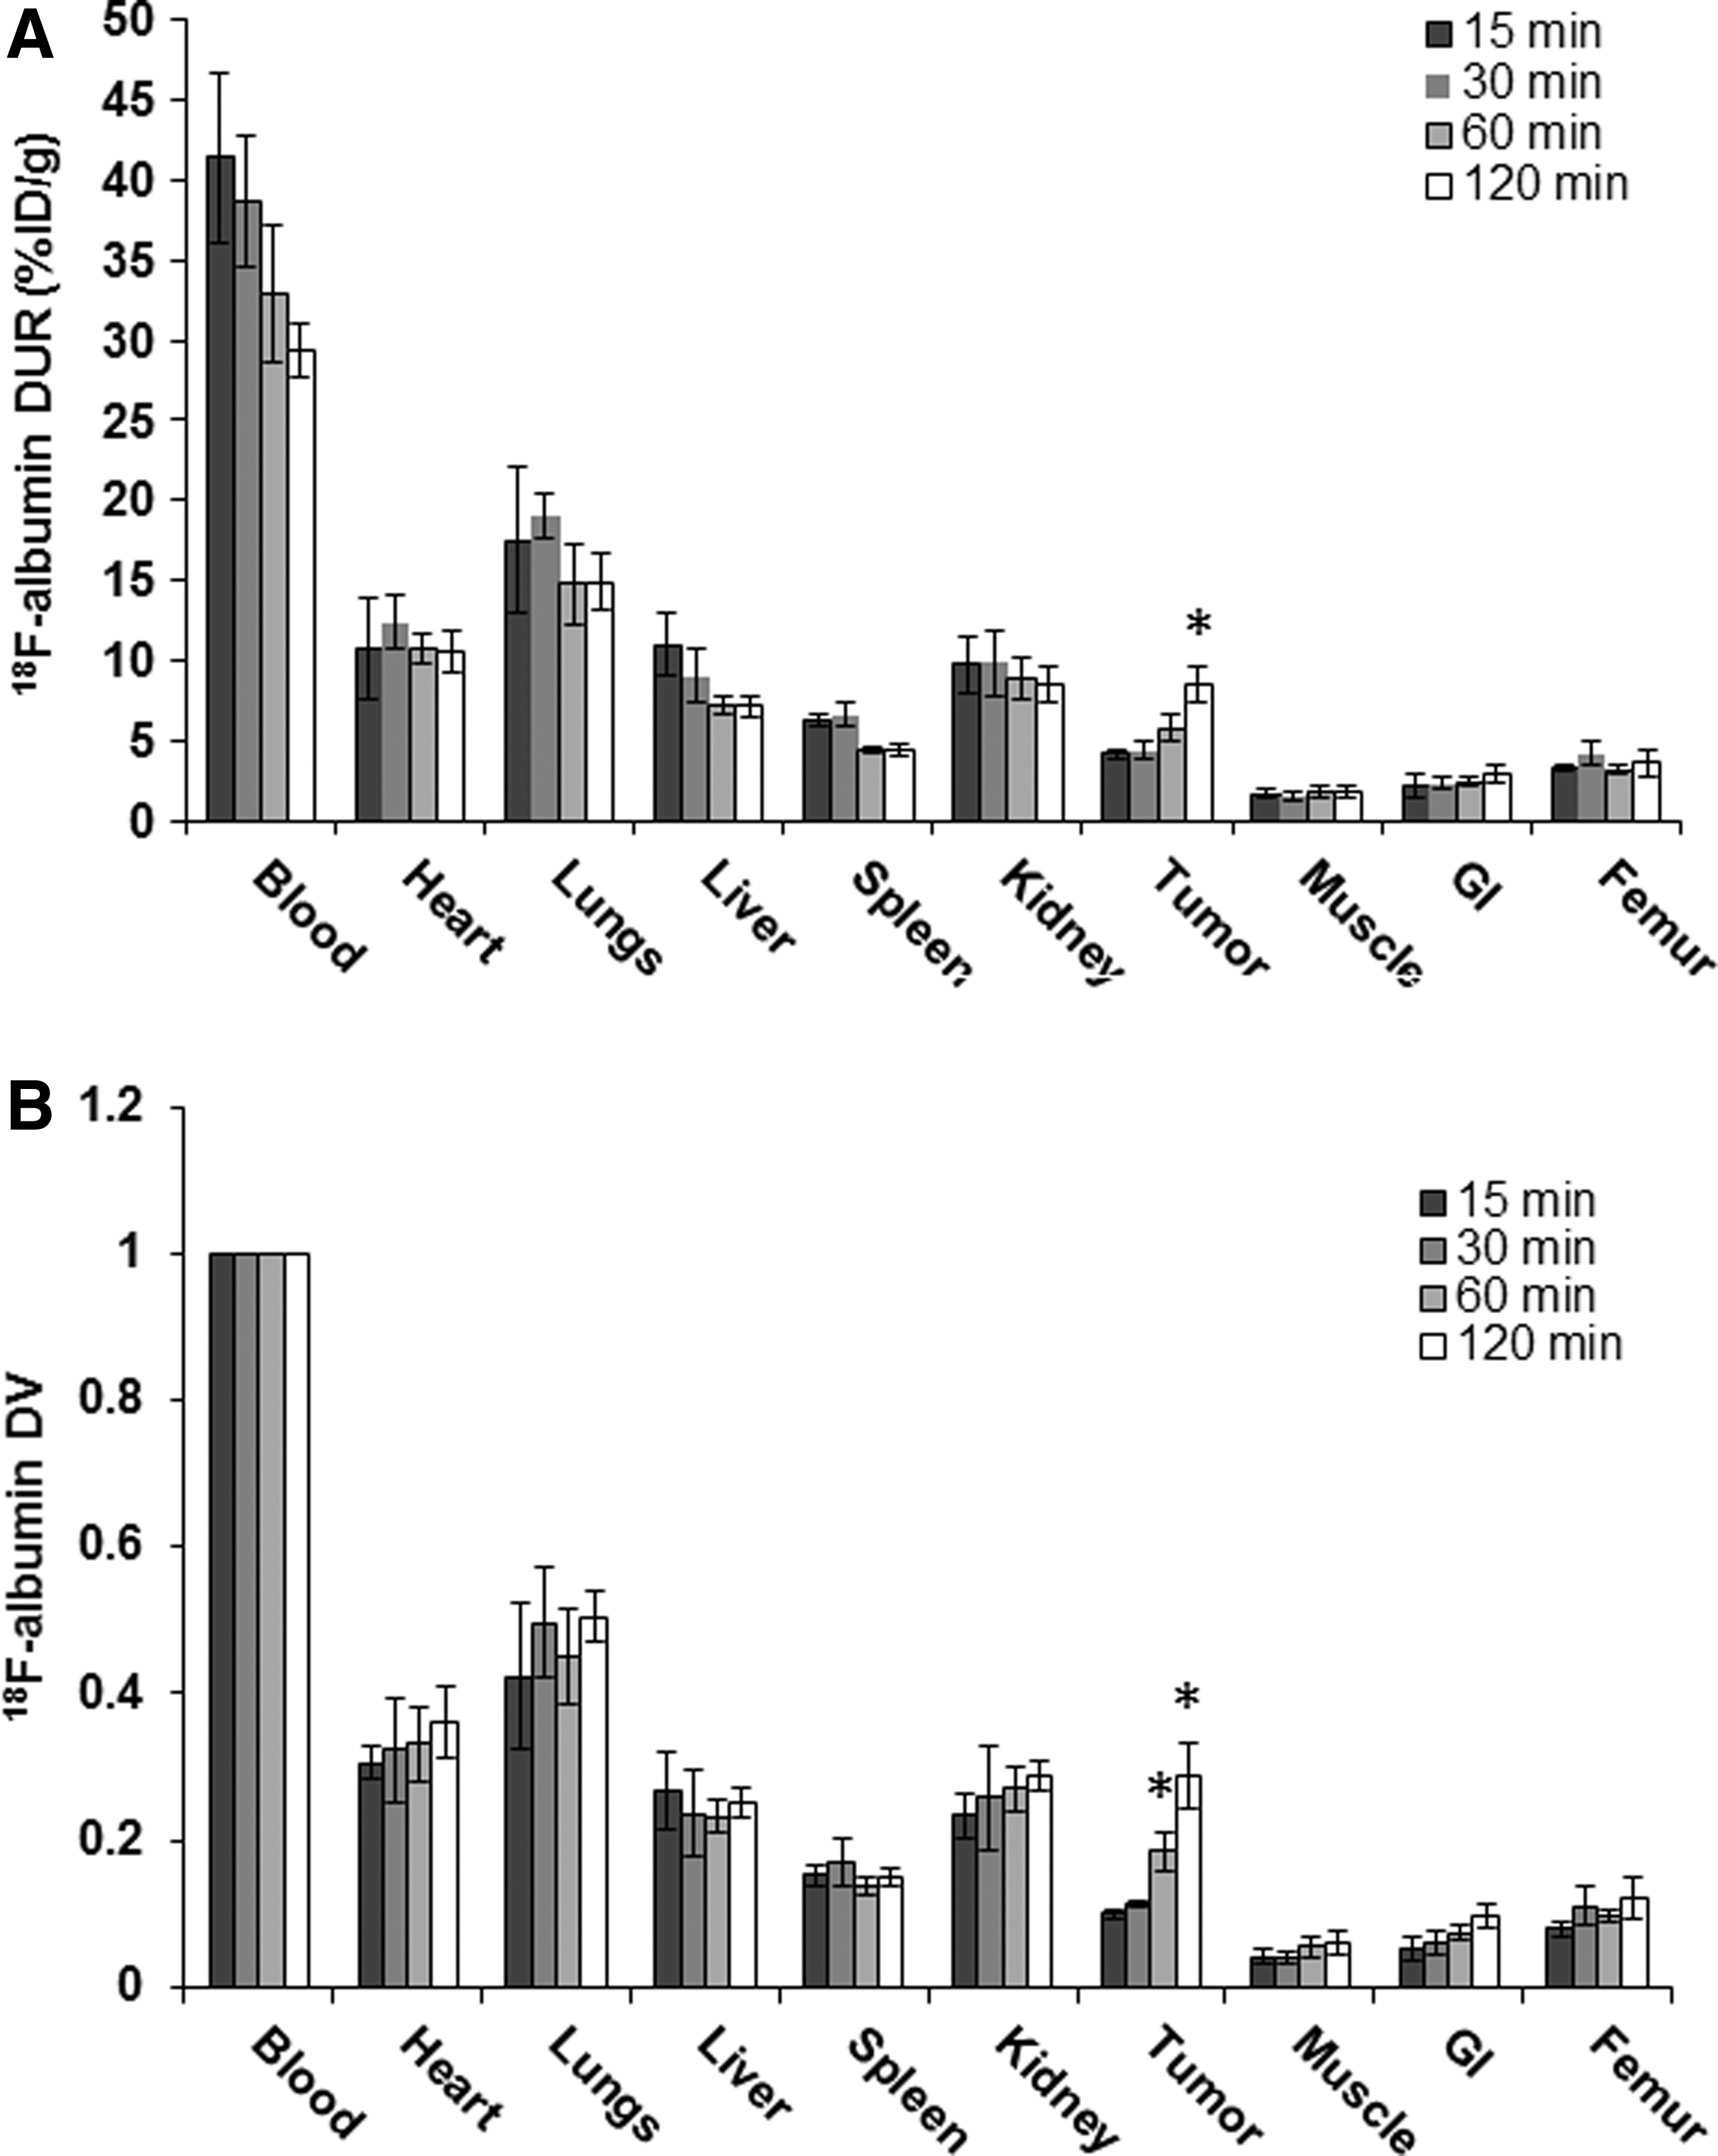
U87MG tumor DVs (Fig. 1B) increased approximately threefold (from 0.1 to 0.29) between 15 and 120 min. Tissue DVs in the other organs, however, did not change or increased slowly with time, implying that 18F-albumin is retained in the vasculature of these tissues. Similar biodistribution results were obtained in nontarget tissues for other xenograft tumor types (data not shown).
In Figure 2, DURs and DVs of 18F-albumin in U87MG, NCI-H460, MKN-45, PC3, and DLD-1 tumor xenografts are compared at 15, 30, 60, and 120 min postinjection. All tumor types exhibited higher DURs of 18F-albumin at 120 min compared with 15 min postinjection of the tracer (Fig. 2A and Supplementary Table S2). U87MG tumors displayed the highest DURs at all time points (4.16, 4.35, 5.77, and 8.41 at 15, 30, 60, and 120 min, respectively).
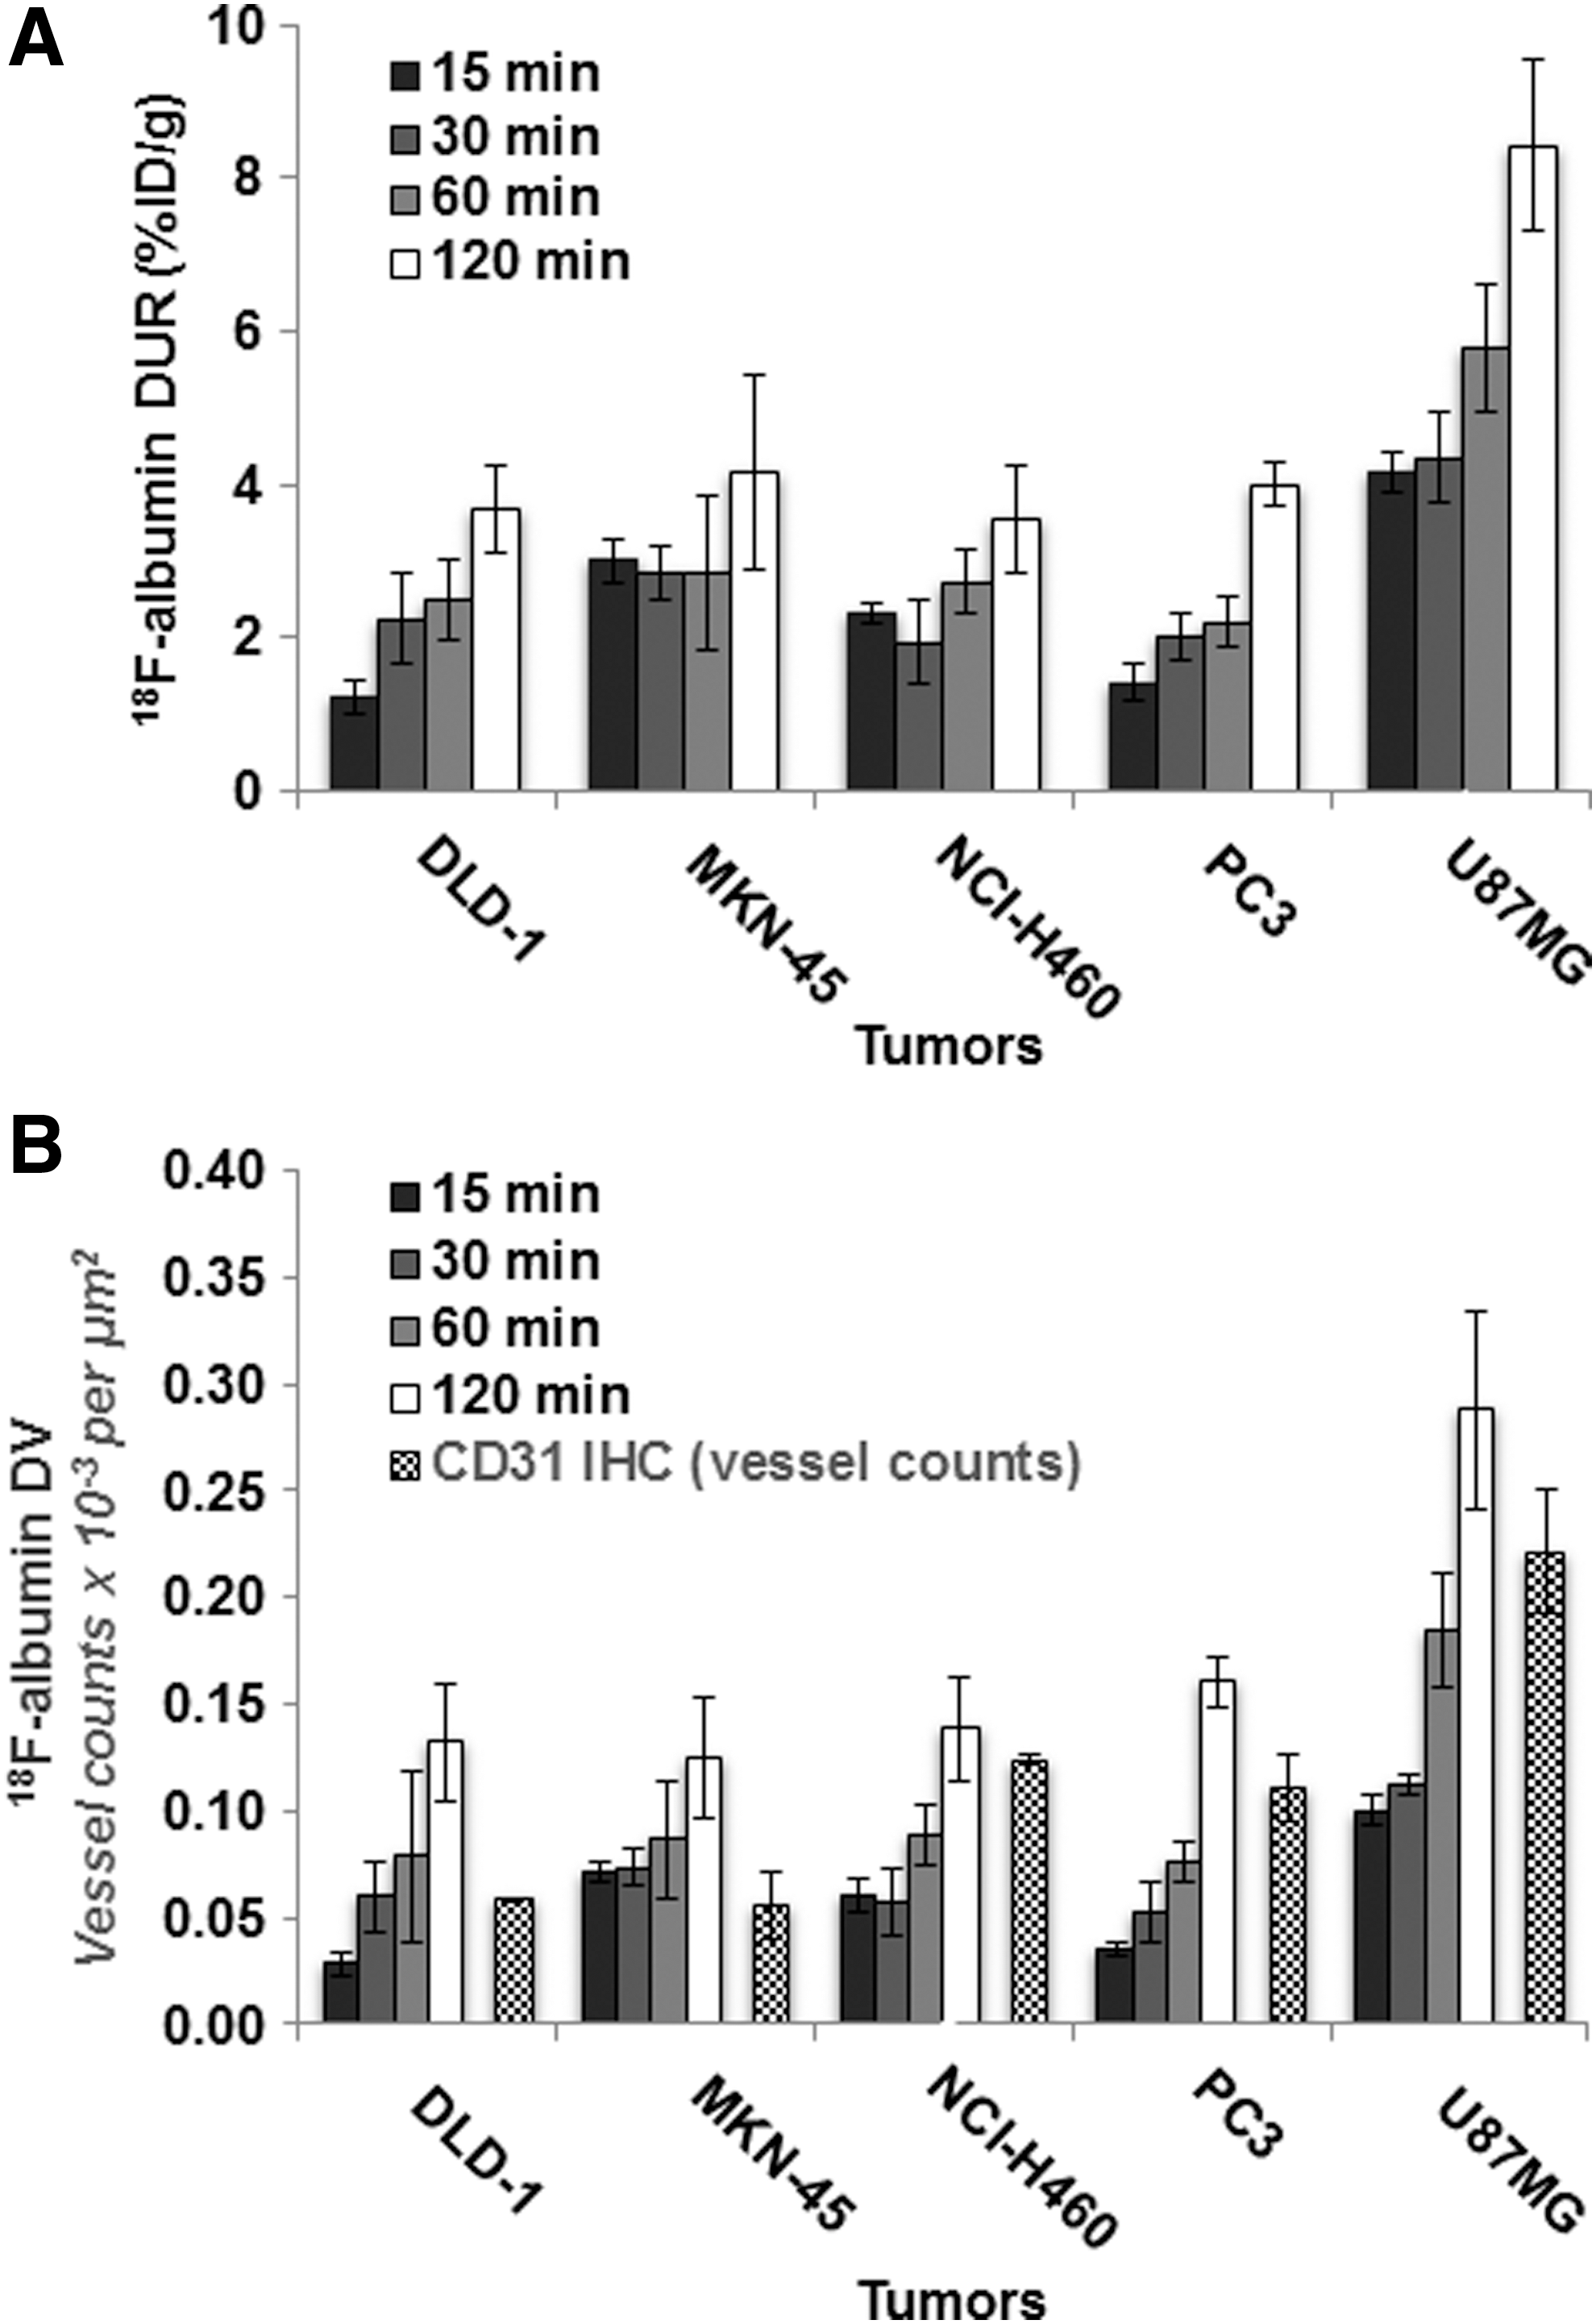
U87MG tumor DVs (Fig. 2B) were higher than all other tumor types at 15, 30, 60, and 120 min. Tumor DVs for all tumor xenografts were increased at 120 min compared with 15 min. Relative CD31-IHC blood vessel counts are also shown for each tumor type (Fig. 2B). Blood vessel counts for the various tumor types at 120 min were lowest for DLD-1 and MKN-45 tumors, approximately twice that for NCI-H460 and PC3 tumors, and highest for U87MG tumors.
PET imaging of U87MG xenografts with/without sunitinib treatment
18F-albumin DVs were measured by PET imaging in U87MG tumor xenografts before and after treatment with sunitinib. In these studies, control and treated mice were imaged at baseline (day 0) and then at 7, 14, and 21 days post-treatment. Tumor volumes (by caliper) were also measured on this same schedule. Tumors from both groups were visible throughout the study period and both exhibited an increase in necrotic areas within the tumors (Fig. 3A).
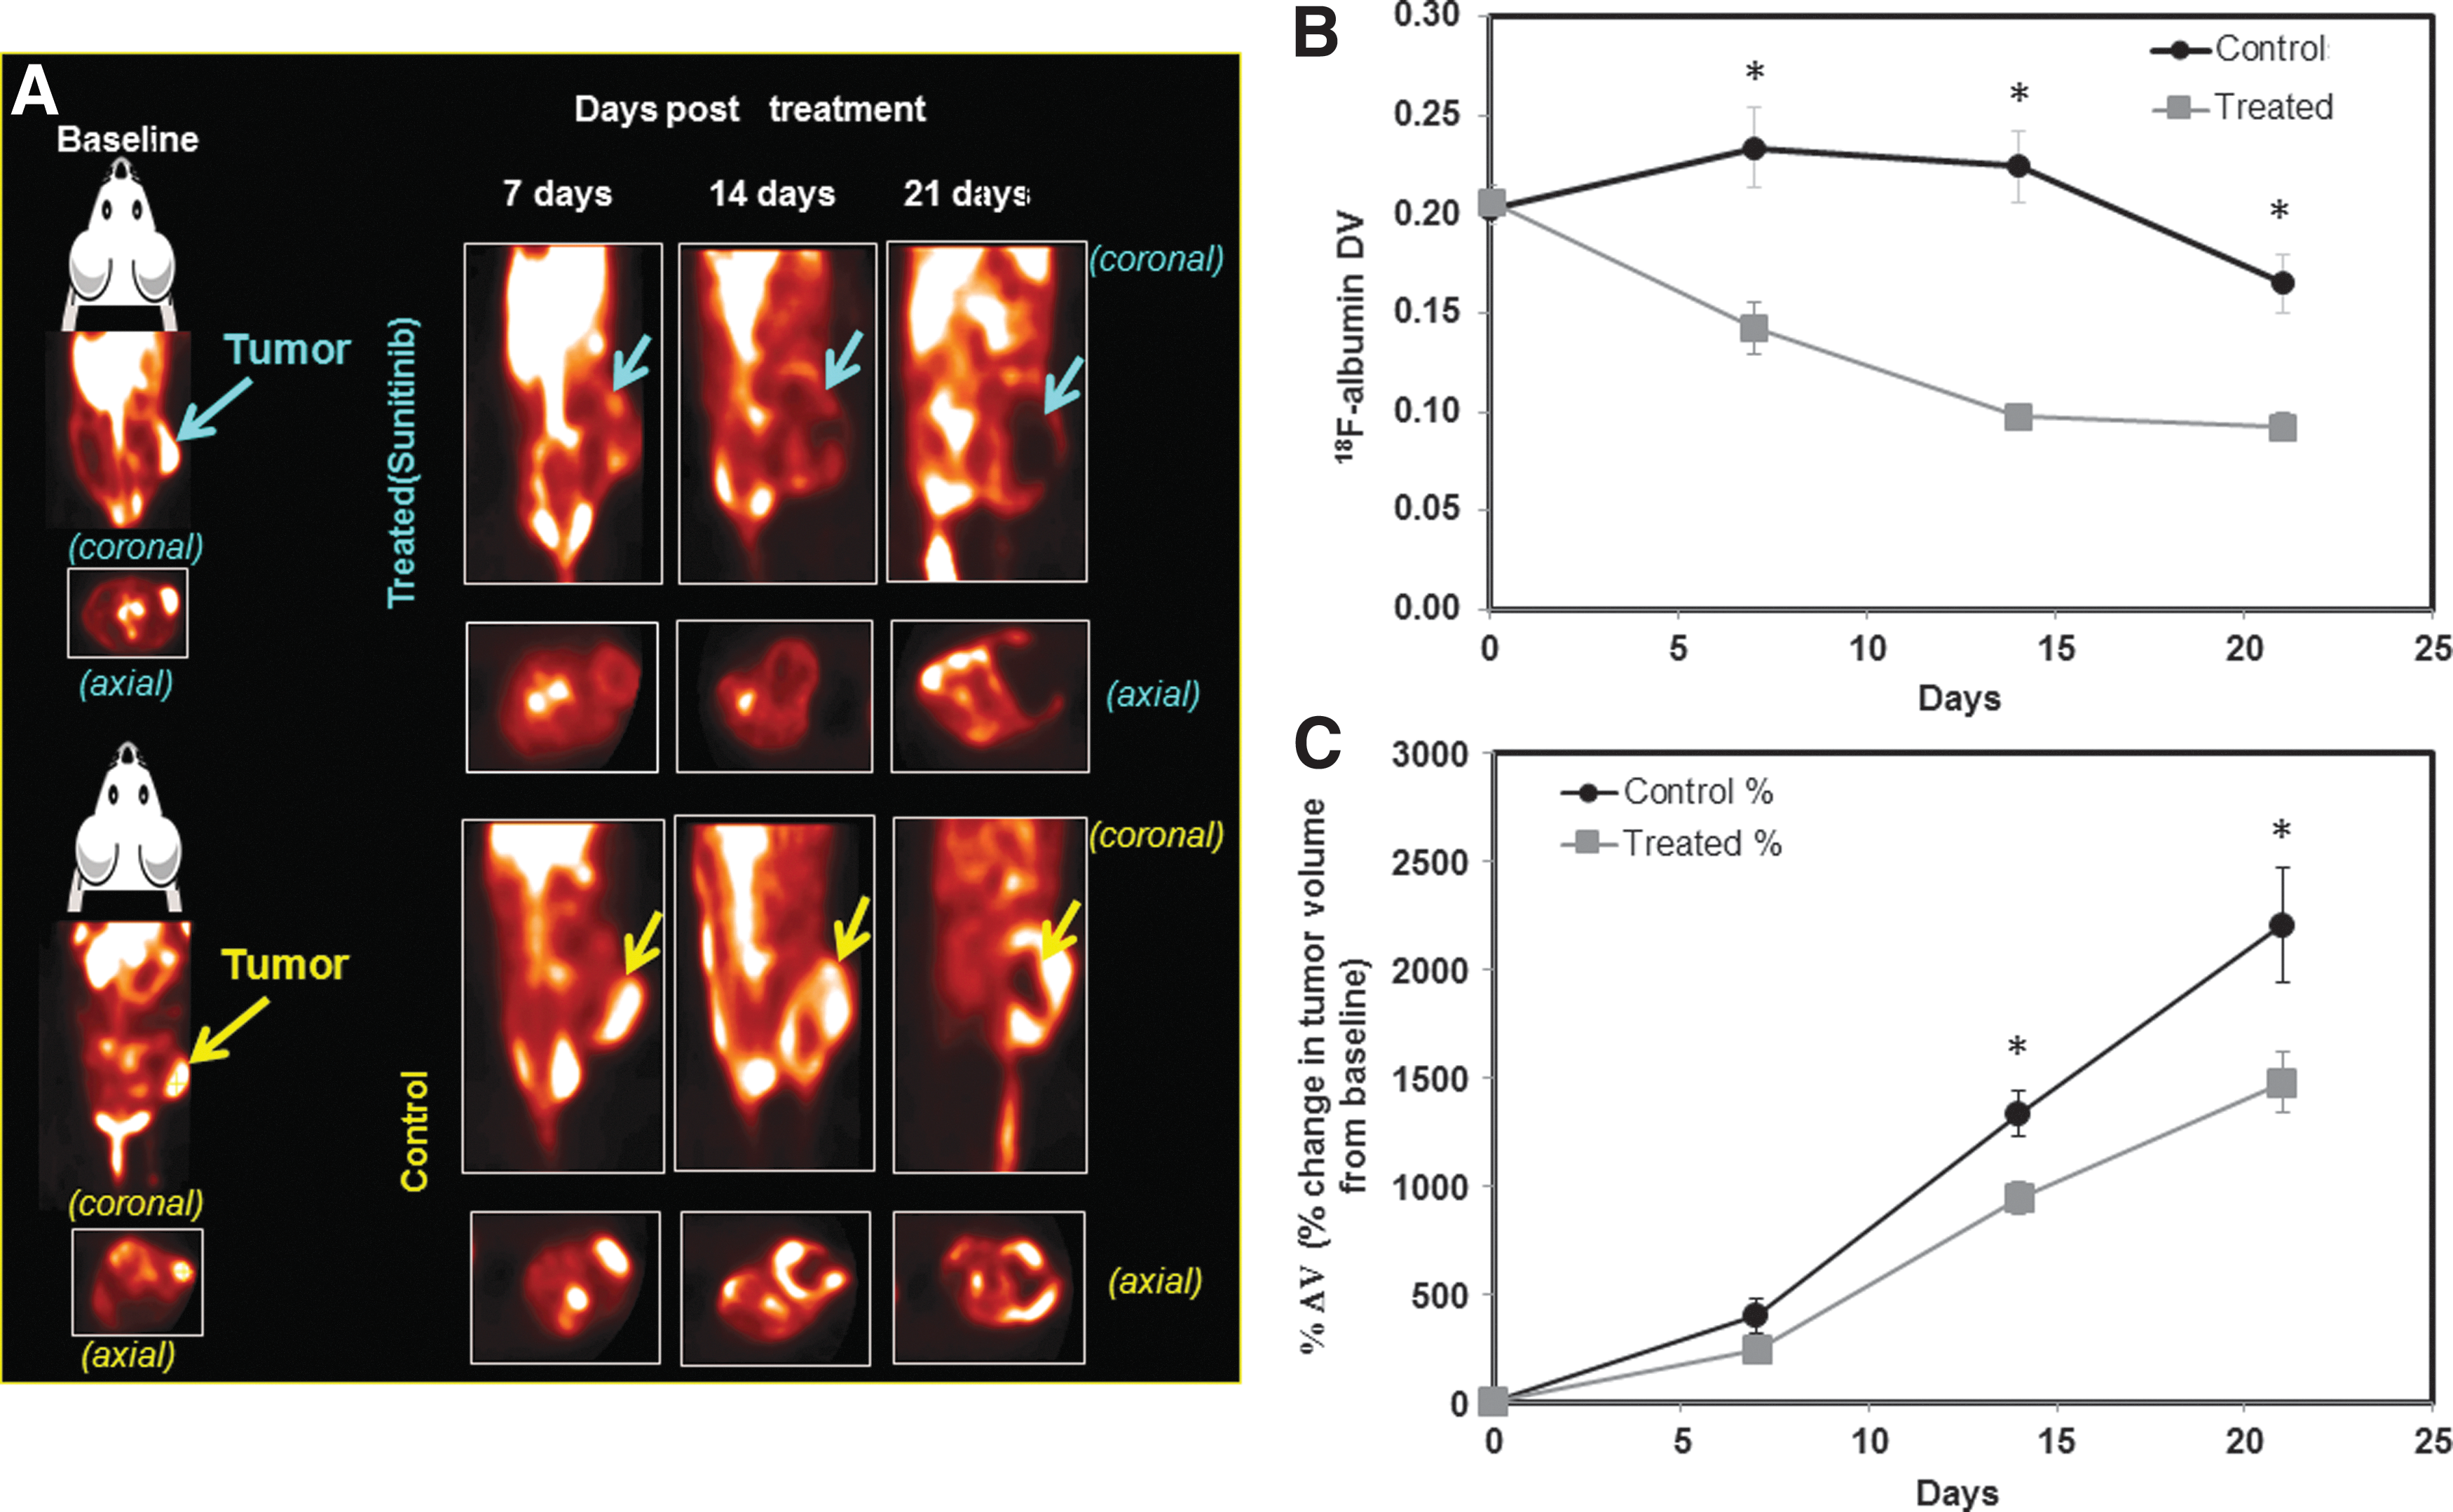
Tumor DVs (Fig. 3B) determined from these images were decreased significantly in the sunitinib-treated tumors at 7 days (−39%), 14 days (−56%), and 21 days (−44%) post-treatment compared with control tumors (p ≤ 0.05; control n = 8; treated n = 9). However, tumor volumes (by caliper) of treated tumors (Fig. 3C) were not significantly decreased compared with controls until day 14 (−29%) and day 21 (−33%; p ≤ 0.05; control n = 8; treated n = 9 for both times).
Tumor DURs in the treatment and control groups were also obtained from the biodistribution study performed after the final imaging session at 3 weeks (Fig. 4A and Supplementary Table S3). Tumor DVs determined from this same study showed a 45% reduction in the treatment group versus the control group (Fig. 4B), a value similar to that obtained from the imaging study at the same time. Microvessel density as determined by CD31 IHC staining of these tumors revealed a significant decrease (−59%) in the vessel density of treated (51.2 vessels/mm 2 ) tumor sections compared with controls (123.9 vessels/mm 2 ) (Fig. 4C).
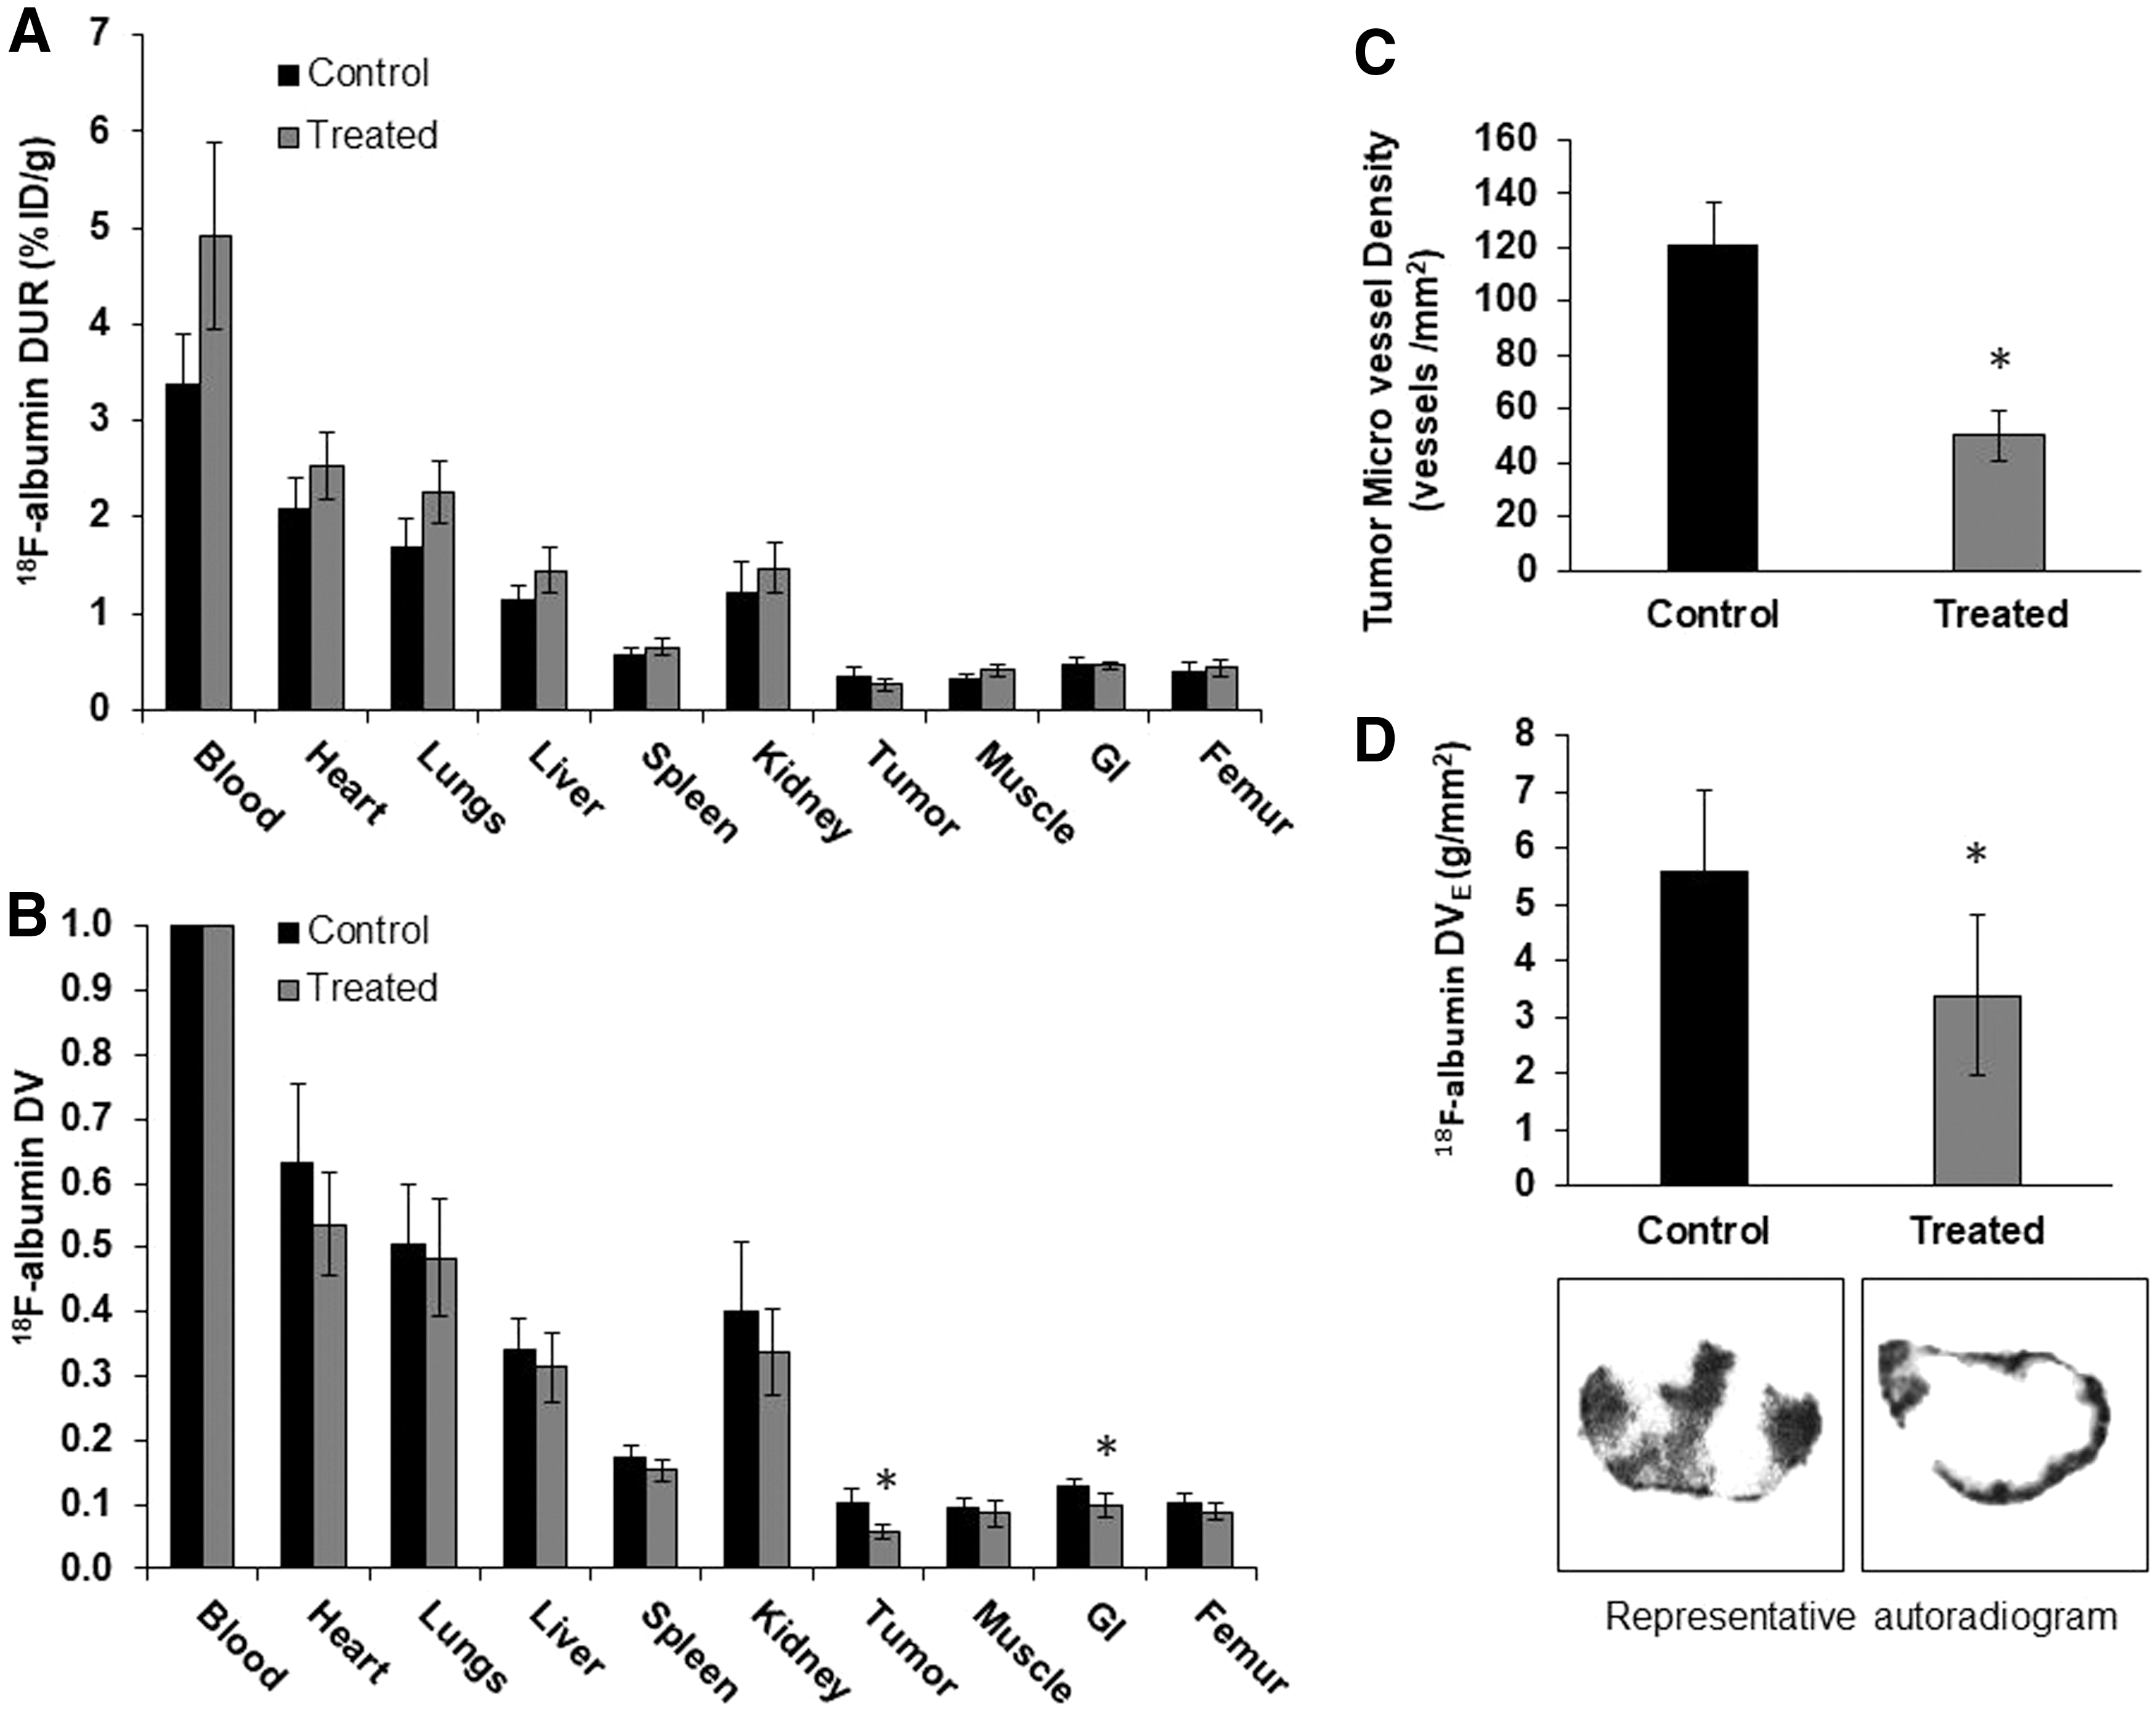
Ex vivo autoradiography sections obtained from these same tumors (Fig. 4D) also showed a decrease in effective slice DV (DVE, −39%; p < 0.05) of 18F-albumin in treated versus control tumors. The same or adjacent sections of both treated and control tumors were found to be severely necrotic as graded by H&E staining (data not shown) and lack of activity in the center of the autoradiographic sections (Fig. 4D). This high degree of necrosis might be expected due to the large size (>1 g) of tumors at 3 weeks and their rapid growth. Despite this confounding factor, control tumors had increased DVs compared with treated tumors at 3 weeks.
Discussion
These results indicate that 18F-albumin can be used to determine tumor DVs and detect responses to an antiangiogenic treatment. Significant reductions in 18F-albumin DVs were detected at earlier times compared with physical tumor volumes in sunitinib-treated U87MG xenografts. In another comparable study with sunitinib treatment of U87MG mouse xenografts, early responses were detected using 18F-fluorothymidine. 25,26 Other studies have used 18F-fluorodeoxy glucose, 2618F-Arg-Gly-Asp, 8 and 18F-fluciclatide 27 to study angiogenesis, but these imaging agents are not ideal for early detection of antiangiogenic therapeutic responses. The uptake of these agents is either dependent on the density of specific targets in tumor blood vessels or on tumor metabolic activity. Tumor accumulation of 18F-albumin, on the other hand, depends on the EPR effect, an effect directly related to vascular integrity and detectable in all of the tumor types studied here. 16 Thus, changes in 18F-albumin DVs measured with PET may more closely reflect changes in angiogenic processes during treatment.
Sunitinib treatment appears to delay excretion of 18F-albumin from the blood pool, as evidenced by the elevated blood and large organ DURs shown in Figure 4A, which may explain the lack of a difference in tumor DURs between treated and control groups. However, when tumor activity is compared with blood activity, that is, by DV (Fig. 4B), a significant decrease (−44%) is evident between treated and control groups. DUR values represent an absolute value at a given time point that will increase or decrease as blood tracer concentration increases or decreases. DV values, on the other hand, remove this dependence and show a significant decrease.
In these studies, the 18F-albumin tumor content is defined as a DV, which represents total tumor activity relative to blood activity at the same time. In normal tissues, in which blood vessels are intact, 18F-albumin would be expected to be retained in the vasculature and tissue/organ DVs would be expected to remain relatively constant and be representative of the physical blood volume of these tissues. In U87MG xenografts, 18F-albumin DVs (Fig. 1B) were, in fact, relatively constant in all organs/tissues over time with the exception of tumors where a significant increase in U87MG tumor DVs was observed, suggesting leakage of 18F-albumin out of the tumor vasculature into the tissue. These results are consistent with other literature reports in which tumor tissues are known to exhibit EPR effects: at early times, tumor DVs are proportional to actual tumor plasma volumes, whereas at later times, tumor content represents blood vessel plasma content plus the accumulation of 18F-albumin in tumor tissue due to leakage. 28 Thus, 18F-albumin tumor DV may serve as a surrogate measurement of tumor blood vessel patency and, indirectly, of tumor angiogenic activity. A clinical variant of this procedure might acquire the needed tracer blood concentration by imaging the heart or by drawing a physical blood sample at the time of tumor imaging.
A decline in the tumor DV of 18F-albumin in U87MG tumors preceded physical changes in tumor volume after treatment with the antiangiogenic agent sunitinib. 18F-albumin PET imaging of tumors may thus have clinical diagnostic and prognostic utility by detecting an early response to antiangiogenic therapies.
Footnotes
Acknowledgments
The authors would like to acknowledge Dr. Miriam R. Anver, Donna Butcher, and Rebecca Oden of the PHL, FNLCR Frederick, MD, for providing the CD31 PECAM-1 staining and microvessel quantitation results. This project has been funded, in whole or in part, with federal funds from the NCI, NIH, under Contract No. HHSN261200800001E. Jyoti Roy has been funded by Dr. Frank I. Lin, NIH. The content of this publication does not necessarily reflect the views or policies of the DHHS, nor does it mention trade names, commercial products, or organizations that imply endorsement by the U.S. Government.
Authorship Confirmation Statement
Listed below are the contributions of each author toward this article.
As a corresponding author of this article, E.M.J. confirms that all the coauthors have approved this article as submitted.
Disclosure Statement
No competing financial interests exist.
Supplementary Material
Supplementary Table S1
Supplementary Table S2
Supplementary Table S3
References
Supplementary Material
Please find the following supplemental material available below.
For Open Access articles published under a Creative Commons License, all supplemental material carries the same license as the article it is associated with.
For non-Open Access articles published, all supplemental material carries a non-exclusive license, and permission requests for re-use of supplemental material or any part of supplemental material shall be sent directly to the copyright owner as specified in the copyright notice associated with the article.