
Abstract
Objective:
To investigate value of quantitative dynamic contrast-enhanced magnetic resonance imaging (MRI) parameters and apparent diffusion coefficient (ADC) value in differential diagnosis of breast benign and malignant lesions, and their correlation with prognostic factors of breast cancer.
Methods:
The study collected MRI images and clinical data from 232 female patients suspected of breast cancer. Philips INGENIA 3.0T superconducting magnetic resonance scanner was used for imaging examination. Complete pathological data of patients were collected, and the expression of ER, PR, HER-2, and Ki-67 were further investigated.
Results:
K ep was higher in malignant breast lesion group than that in benign breast lesion group, and ADC value was lower in the former group than that in the latter group (both p < 0.05). The areas under the receiver operating characteristic curves for K ep, ADC, and extravascular volume fraction (V e) were 0.904 (95% confidence interval [CI]: 0.863–0.945), 0.813 (95% CI: 0.752–0.875), and 0.774 (95% CI: 0.707–0.841), respectively. Furthermore, according to the maximum Youden index, the specificity of K ep and the sensitivity of ADC were high, which were 97.20% and 96.00%, respectively, with a cutoff value of 0.314 and 0.151, respectively. K ep value in ER-positive expression group was significantly higher than that in ER-negative expression group (p < 0.05). K ep value in PR-positive expression group was significantly higher than that in PR-negative expression group (p < 0.05). There was positive correlation between K ep and expression of Ki-67 (p < 0.05). ADC value was negatively correlated with Ki-67 expression (p < 0.05).
Conclusion:
Quantitative parameters K ep and ADC of 3.0 T MR functional imaging can be used as reference indexes for differential diagnosis of benign and malignant breast lesions and for biological behavior evaluation, indicating potential clinical value for noninvasive preoperative evaluation of breast cancer.
Introduction
Breast cancer is a common malignant tumor impacting female heath and lives. 1 In recent decades, the incidence of breast cancer has increased globally. 2 In western countries, breast cancer has become a leading cause of feminine malignant tumor death. 3 According to the statistics by the American Cancer Society in 2014, the number of new cases was the highest among all malignant tumors in women. 4 Most Asian countries, including China, used to be low-risk areas for breast cancer. But in recent years, the incidence of breast cancer has risen rapidly at a rate higher than the high-risk areas and the world average. Especially in some economically developed regions and large cities, the incidence of breast cancer has ranked first or second in female malignancies. 5,6
The increasing incidence of breast cancer suggests that the exposure level of risk factors and risk factors related to breast cancer may be changed. The exact mechanism of the etiology and development of breast cancer has not yet been fully clarified. Epidemiological studies have identified a number of etiological factors, such as reproductive factors, dietary factors, environmental factors, and mental and psychological factors. However, in the past 20 years, Chinese women have undergone changes in different forms of life, including female reproduction, fertility, psychology, and living environment. 7 –9 In this regard, differential diagnosis of benign and malignant breast cancer, breast cancer prevention, early diagnosis, prognosis evaluation, and treatment scheme selection have become the focus and hot issues in the field of breast cancer urgently.
Imaging examination is an important method for the diagnosis of breast diseases. The commonly used methods of breast imaging, such as ultrasonography, mammography, and magnetic resonance imaging (MRI) 10 –14 have their own advantages and disadvantages. For example, ultrasound diagnosis of breast is simple and easy. However, there is a difference between the resolution of the ultrasound equipment and the clinical experience of the operator in clinical work. 15,16 At present, there is a lack of unified objective diagnostic criteria, and the diagnostic results can vary among different devices and operators. Mammography is sensitive to calcification and has some limitations in the dense breast, the deep lesions of the glands, and the display of multifocal lesions, with certain misdiagnosis or missed diagnosis. 17 MRI of soft tissue has high resolution, and can be used in multiplane, multisequence, and multiparameter imaging, which can reflect the biological characteristics of lesions more comprehensively, and has the advantages of high detection rate of small lesions, no ionizing radiation damage, etc. 18,19 It has been widely accepted in the clinical application of breast disease diagnosis and differential diagnosis. 20 Besides, MRI is a noninvasive evaluation of tissue lesions and microcirculation features of functional imaging technology, presenting MR continuous dynamic scanning for region of interest (ROI), providing qualitative, semiquantitative, and quantitative analysis of tissue perfusion and microvascular permeability of hemodynamics, which not only helps to improve the accuracy of early diagnosis and differential diagnosis of lesions but also can be used as an effective technology for the multicenter randomized controlled study. 21 –23
Significantly, the apparent diffusion coefficient (ADC) from diffusion-weighted imaging (DWI) has been proved helpful for differentiation breast tumors by multiple studies. 24,25 The thresholds of ADC values for differentiating benign from malignant breast lesions are not the same for different research purposes, research methods, MRI equipment (field strength), and statistical methods. In the study, the authors designed to make MRI quantitative analysis and analyze multiple parameters of breast tumor, to investigate value of MRI quantitative parameters by using 3.0 T equipment with wider application and relatively better imaging quality than 1.5 T equipment 26 and ADC value in differential diagnosis of breast benign and malignant lesions, and to investigate the correlation of quantitative parameters of MRI and ADC value with prognostic factors of breast cancer, so as to provide effective information and references to evaluate the rational selection of clinical breast cancer early detection, accurate diagnosis, treatment, and prognosis.
Materials and Methods
Object of study
The MRI images and clinical data of 232 female patients suspected of breast cancer and required further diagnosis and conformation due to clinical palpation or asked for ultrasonography or mammography were collected in Lishui Hospital of Zhejiang University from December 2014 to November 2015. Inclusion criteria were as follows: (1) before the MRI examination, the patient received no puncture, operation, radiotherapy, chemotherapy, hormone, or target therapy; (2) MRI dynamic contrast scan and DWI scan were performed on the MRI scan of breast, and the sequence and parameters of the scan were uniform, which met the technical requirements of this study; (3) one week after MRI examination, the breast biopsy or surgical pathology confirmed the diagnosis; and (4) MRI images were clear and available for quantitative analysis. The research was approved and supervised by the Ethics Committee of the authors' hospital. The subjects signed the informed consent and at the same time had the right to know all details related to the experiment. Included patients were aged between 22 and 67 years old, with a mean age of 39.65 years old. There were 101 benign lesions, with the size of the lesion 2.12 ± 1.15 cm. Furthermore, there were 131 malignant lesions, with the size of the lesion 3.54 ± 2.05 cm.
Examination equipment and scanning position
A Philips INGENIA 3.0T was used in the experiment, with a dedicated eight channel breast phased-array coil. The patient was in the prone position with both arms lifting so that the bilateral breasts were symmetrical and naturally suspended in the coil to avoid breast compression, deformation, and displacement. MRI examining method was a conventional scanning sequence that included axial T2 STIR sequence and bilateral sagittal T2 FSE Fat Sat sequence, followed by breast MRI 3D VIBRANT quantitative dynamic scanning. An intravenous bolus injection into the mammary gland through the cubital vein, with Magnevist as the contrast agent and the dynamic scan time of about 6 min followed. DWI used a transverse axial readout diffusion weighted imaging sequence (RESOLVE sequence; matrix of 99 × 192, layer thickness of 5 mm, and layer spacing of 1 mm). Diffusion sensitive factor b was 0 and 800 s/mm. Dynamic contrast-enhanced (DCE) scanning was performed with T1-vibe sequence in transverse view and T1 imaging using triple flip angle method (TR of 4.09 ms, TE of 1.39 ms; matrix of 154 × 192, layer thickness of 3.5 mm, and layer spacing of 0.7 mm). Then dynamic enhanced scanning was performed, with TR of 5.08 ms and TE of 1.77 ms, the other parameters were the same as T1 mapping scanning. A total of 25 phases were scanned. The scanning time of a single phase was 17 s, with the total scanning time of 7 min 5 s to 7 min 20 s. At the end of the third phase, the contrast agent Gadodiamide was injected through the middle elbow vein or the dorsal hand vein to carry out enhanced scan. The contrast medium was injected at a rate of 2 mL/s and a dose of 0.1 mmol/kg. Then, 20 mL normal saline was injected into the tube for flushing via the same injection rate.
Image postprocessing and data measurement
The MRI scan data of the patients in the group were sent to the Philips PHWS and the determination of dynamic quantitative enhancement index was processed by MR WorkSpace Ver 2.3.5.
Measurement of ADC
DWI scan data were transmitted to Philips PHWS for analysis. After sequence scanning, the system automatically generated the ADC diagram, the ROI was set in the target area of the ADC chart, and the ADC value of the corresponding position was recorded subsequently, as well as rate constant (K ep) and extravascular volume fraction (V e ). It should be noted that the signal intensity and morphological characteristics of the lesion were observed on DWI and ADC images, and then ROI was set up at different layers and different positions of the tumor to avoid the cystic degeneration, necrosis, and hemorrhage. The shape and area of ROI in the same tumor were approximately equal, which was about 10–20 mm2. Each tumor was measured with three ROIs, and the average value was taken as the final ADC value of the lesion. At the same time, the pseudo color image was generated by postprocessing to reflect the whole hemodynamic characteristics of the tumor. The default “Tofts two-compartment model” of TISSUE 4D software was used as the pharmacokinetic model, and the arterial input function calculating model software was used with default “Fast”.
Example figures of DCE–MRI images and ADC images of bilateral breasts (left + right) in the collected patients were provided in Figures 1 and 2, with ROI set up at different layers and different positions of the tumor.

DCE–MRI images of the left and right breasts in the included patients, with ROI set up at different layers and different positions of the tumor.
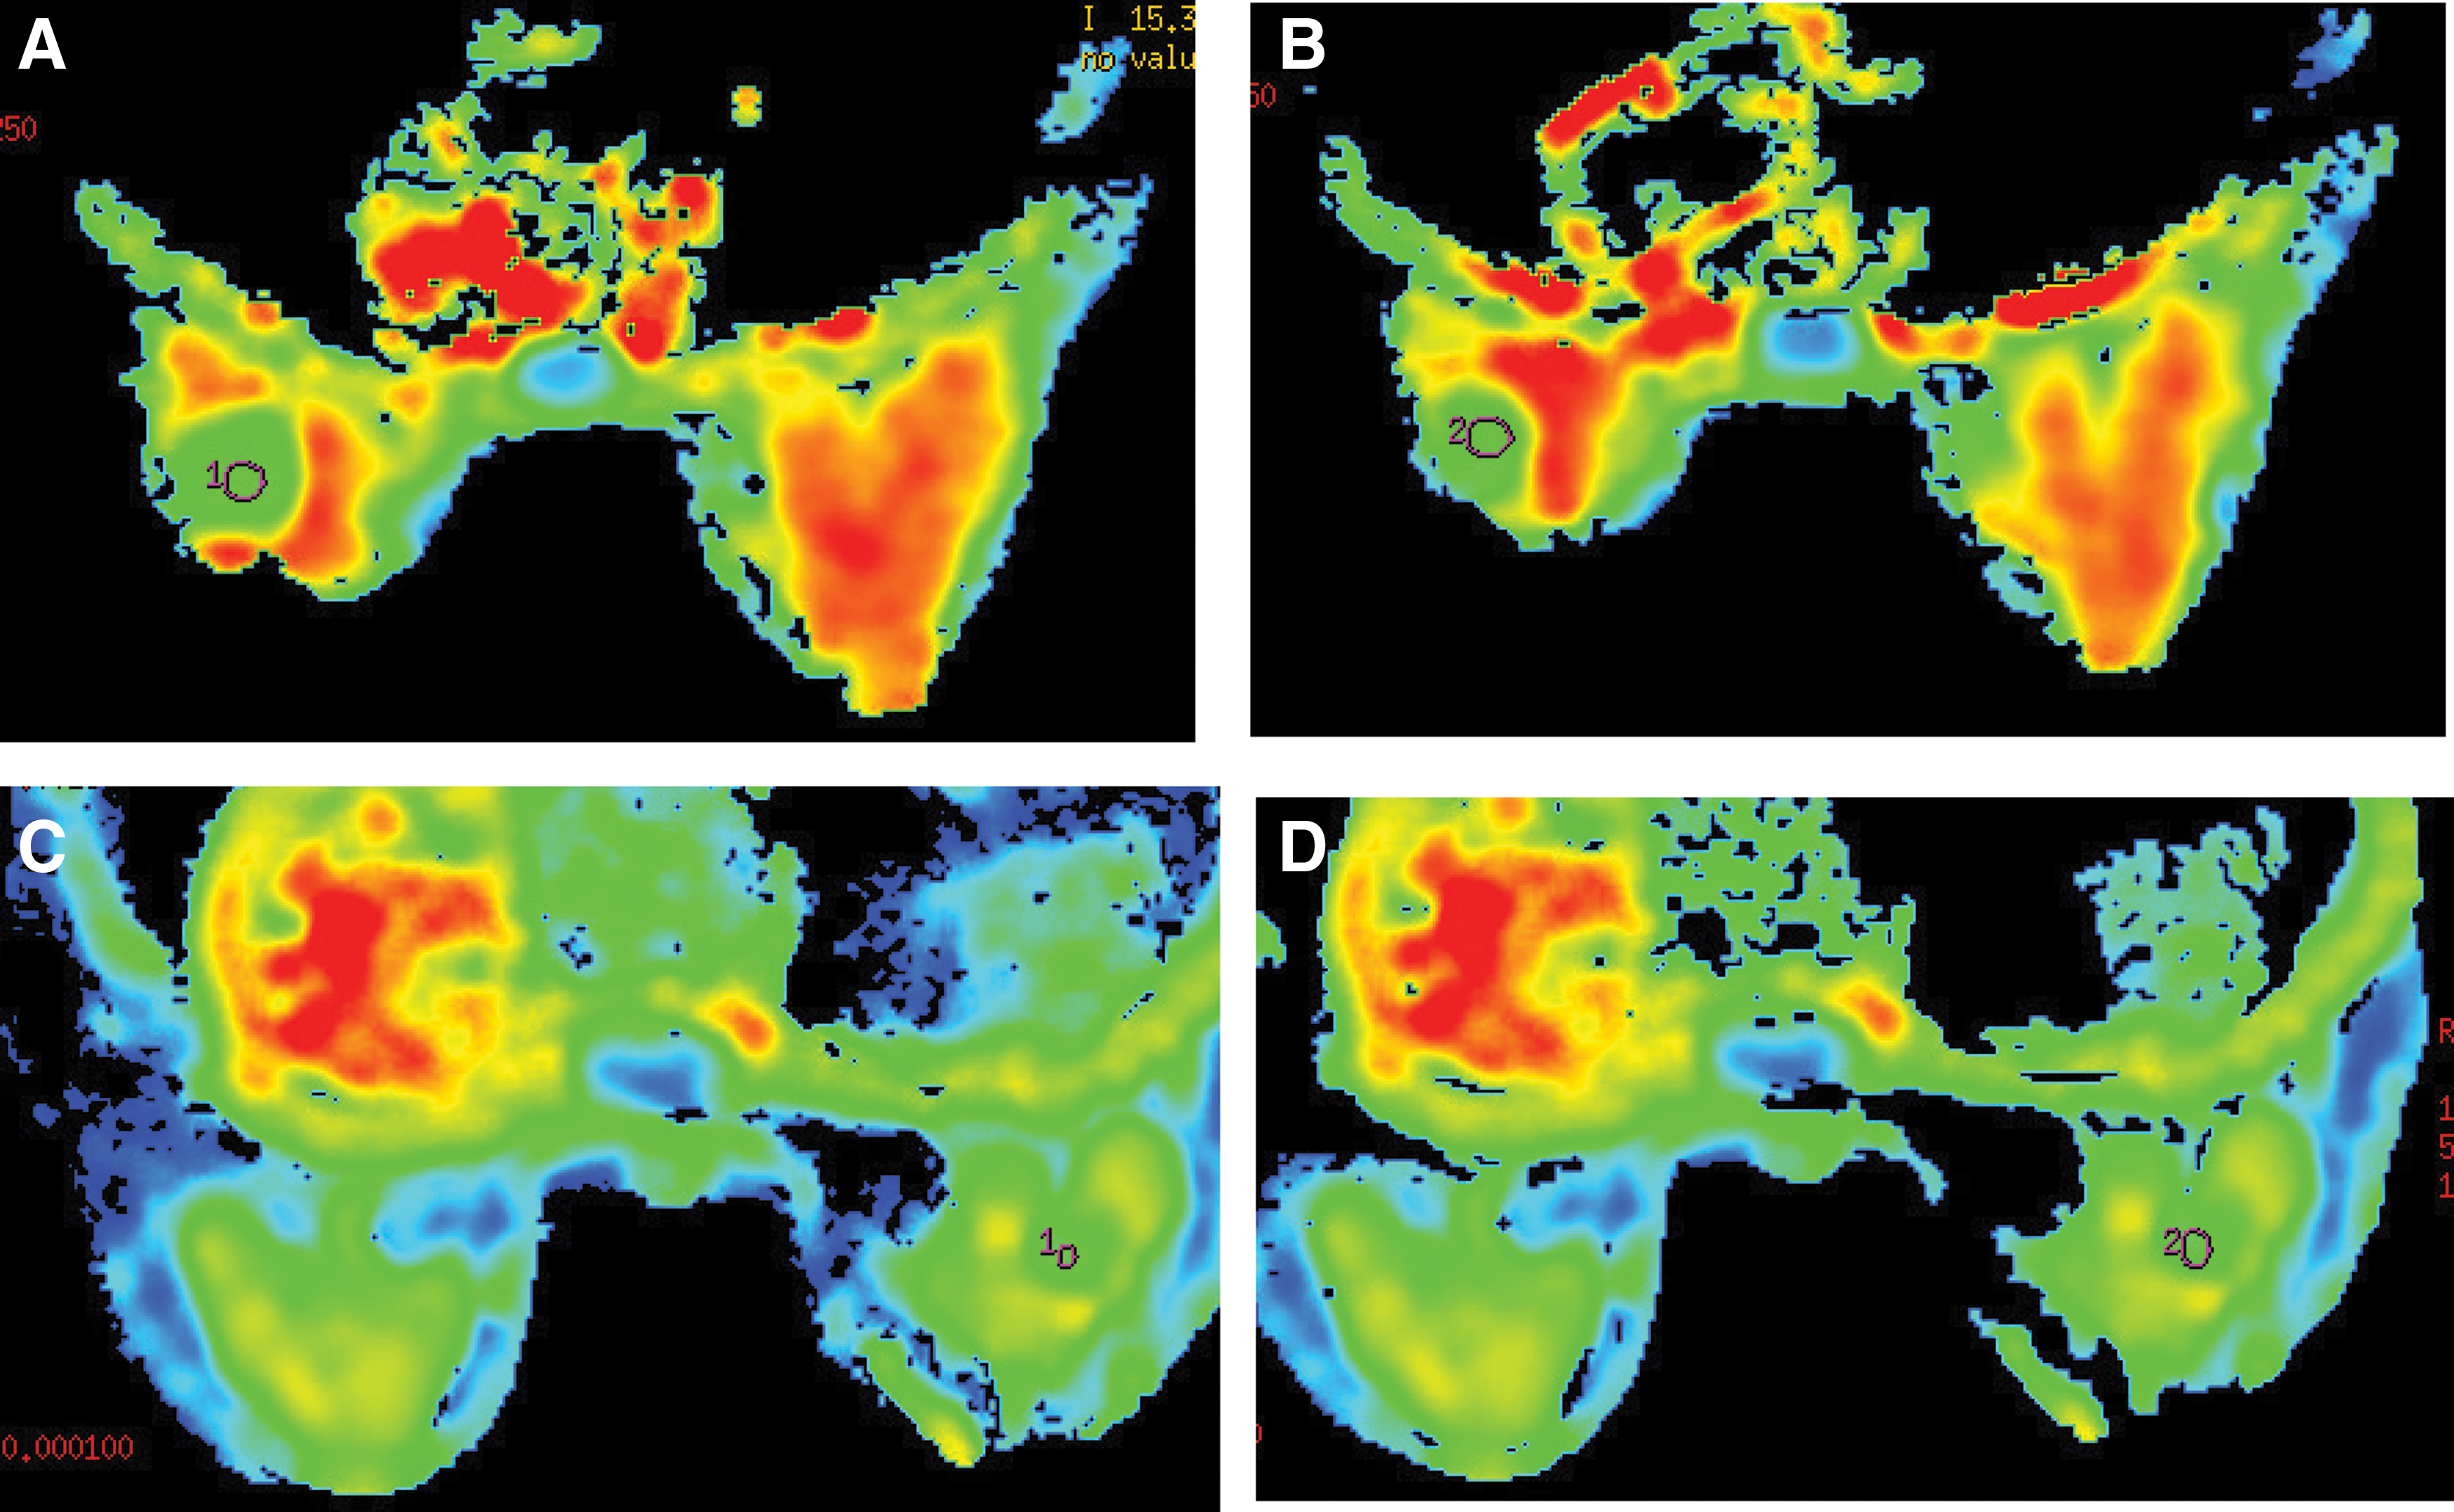
ADC images of the left and right breasts in the included patients, with ROI set up at different layers and different positions of the tumor.
Among them, K ep refers to the velocity constant of the contrast agent reflowing into the blood vessel within a tissue gap after a certain period of time. V e can be interpreted as the extracellular space outside the blood vessel accounts for the volume ratio of the whole body. The above DCE–MRI quantitative parameters can be calculated automatically by software.
Immunohistochemistry
Complete pathological data of enrolled patients were collected. The pathological examination methods were surgical pathology and needle biopsy of the lesion. There were complete pathological findings of hematoxylin and eosin staining and SP staining of immunohistochemistry, and the pathological records were complete.
Samples were fixed by formalin and embedded by paraffin, all of which were 4 μm thick slices, according to conventional immunohistochemical SP staining, all sections were observed under the optical microscope and read by professional pathologists. ER and PR were located in the nuclei of diseased cells, and the positive reactions were brownish yellow granules. Both of them were positive for >10% positive cells after staining. HER-2 was located on the cell membrane, the cell membrane without staining were negative: (−), any proportion of invasive cancer cells showed weak and incomplete cell membrane staining: (+), <30% infiltrating carcinoma cells showed brown and complete membrane staining: (++), >30% invasive carcinoma cells showed brown and complete membrane staining: (+++). Among them, (+), (++), and (+++) were defined as positive expressions. Ki-67 cells were positive for brownish yellow granules. At high magnification, a total of 1000 cells were counted, and the percentage of positive cells was recorded one by one.
Statistical analysis
SPSS 21.0 (SPSS, Inc., Chicago, IL) statistical software was used to analyze the data. Quantitative parameters between benign breast lesion group and malignant lesion group are expressed by mean ± standard deviation, and the comparison of measurement data in accordance with normal distribution used t test between groups. Receiver operating characteristic (ROC) curve of quantitative parameters was drawn, followed by the calculation of the area under ROC curve of each quantitative parameter, determination of the best diagnosis boundary value according to the maximum Jordan index (Jordan index = sensitivity + specificity-1), and evaluation of each quantitative parameter. Furthermore, according to the results of immunohistochemical detection, that was, positive or negative expression of ER, PR, HER-2, and Ki-67, breast cancer cases were then divided into positive and negative groups, and the difference of each parameters was compared by Mann–Whitney and U rank sum test. p < 0.05 meant that the difference was statistically significant.
Results
Quantitative parameters between benign breast lesion group and malignant lesion group and corresponding diagnostic value
Statistical analysis results showed that K ep was significantly higher in the malignant breast lesion group than that in the benign breast lesion group, with statistical difference (all p < 0.05). Furthermore, ADC value was obviously lower in the former group when compared to that in the latter group (all p < 0.05). However, there was no statistical difference in the comparison of V e between groups (p > 0.05). Detailed information is described in Table 1.
Quantitative Parameters of K ep, V e, and Apparent Diffusion Coefficient Value Between Benign Breast Tumor Group and Malignant Tumor Group
p < 0.05.
ADC, apparent diffusion coefficient.
Diagnostic efficacy of quantitative parameters in benign and malignant breast tumors
In contrast to the pathological results in the study, the ROC curves of the values of K ep, ADC value, and V e were drawn (Fig. 3). The areas under the ROC curves were obtained, which were 0.904 (95% confidence interval [CI]: 0.863–0.945), 0.813 (95% CI: 0.752–0.875), and 0.774 (95% CI: 0.707–0.841), respectively. The AUC of K ep, and ADC value were significantly greater than that of V e, indicating relatively higher diagnostic value (>0.8), which had higher diagnostic efficiency. Furthermore, according to the maximum Youden index, the best diagnosis boundary value of each quantitative parameter was determined to judge the sensitivity and specificity of differentiating breast benign and malignant tumors according to the value of K ep, ADC value, and V e. The specificity of K ep and the sensitivity of ADC were high, which were 97.20% and 96.00%, respectively, with a cutoff value of 0.314 and 0.151, respectively.
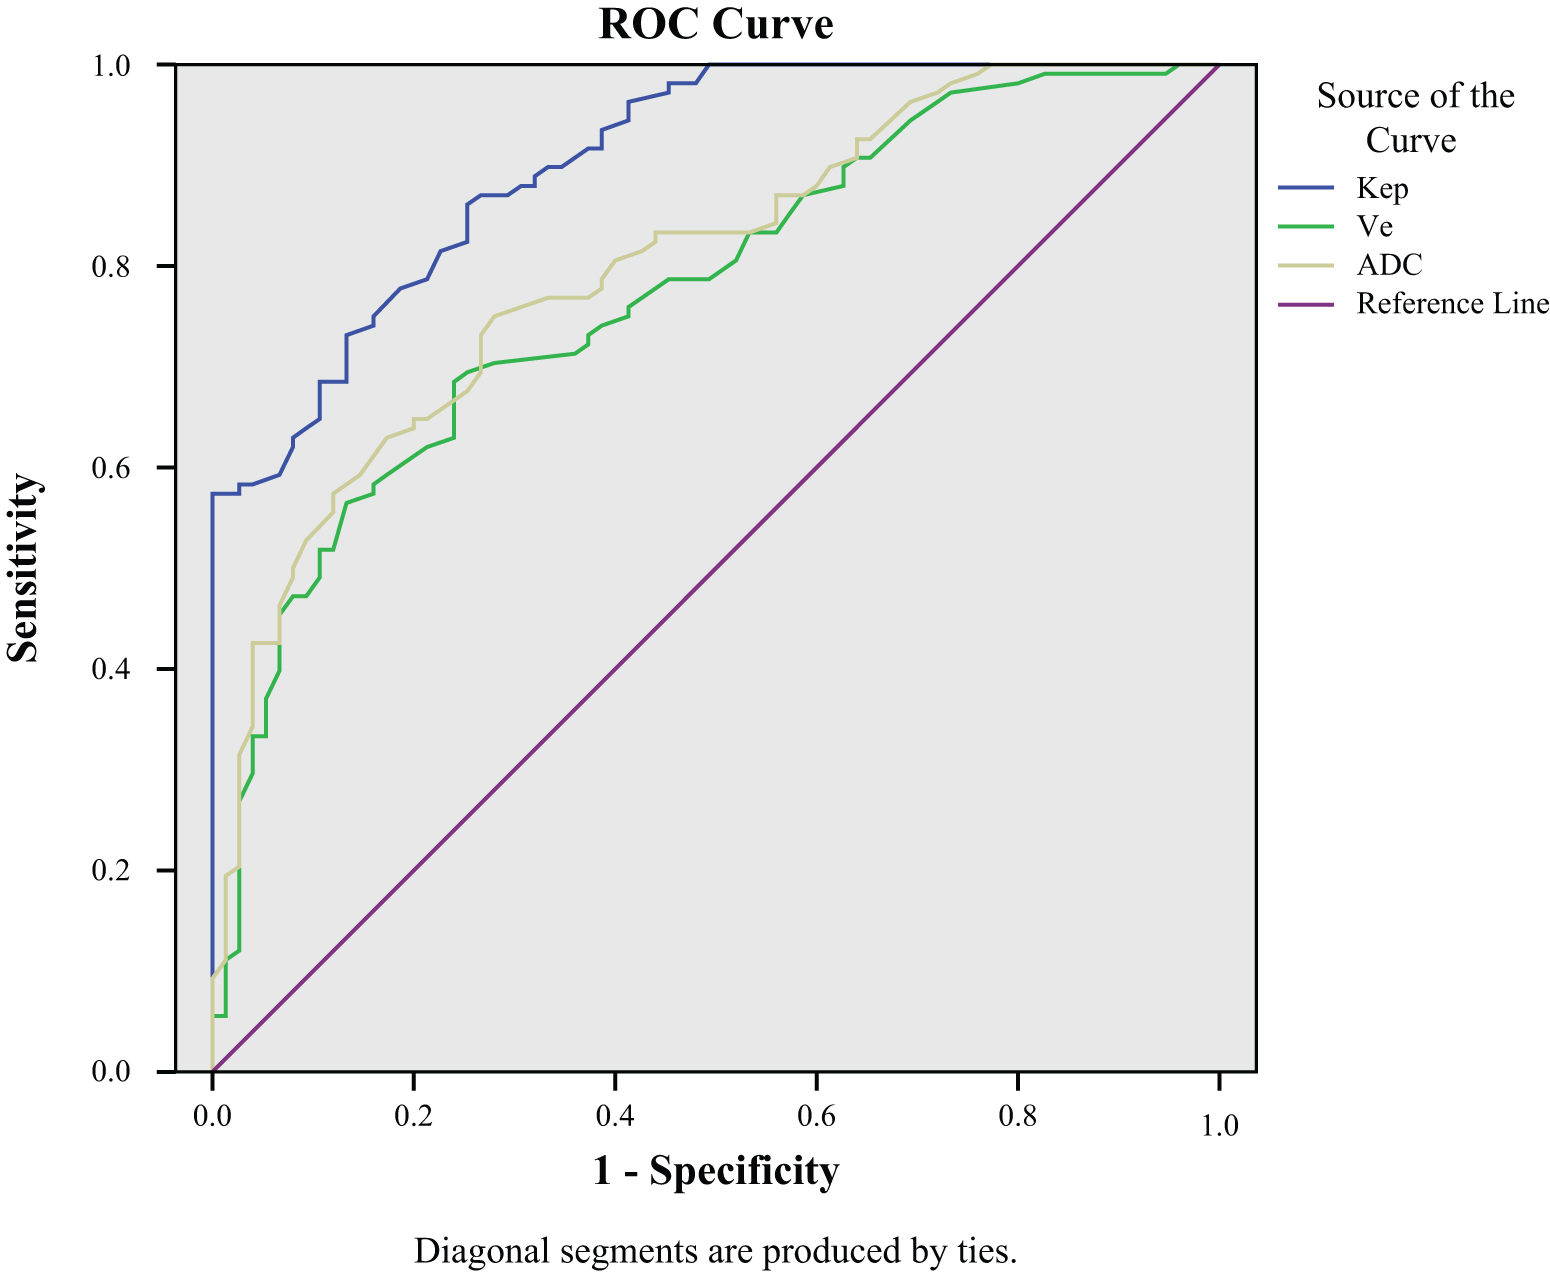
ROC curve of each quantitative parameter. The closer the area under the curve was to 1, the higher the diagnostic efficiency was. The areas under the ROC curves for K ep, ADC, and V e were 0.904, 0.813, and 0.774, respectively. ROC, receiver operating characteristic. Color images are available online.
Immunohistochemical detection of positive or negative expression of ER, PR, and HER-2
Of the included patients, 120 patients showed positive expression of ER, and 112 patients indicated negative expression of ER. Supplementary Figure S1 displayed the immunohistochemical detection results of positive expression of ER, PR, and HER-2. As shown in the table, K ep value in the ER-positive expression group was significantly lower than that in the ER-negative expression group (p < 0.05). However, there was no obvious difference in the comparison of other values (ADC value and V e) (all p > 0.05). In addition, there were 110 patients of positive expression of PR, and 122 patients with negative expression of PR. As shown in the table, K ep value in the PR-negative expression group was significantly higher than that in the PR-positive expression group (p < 0.05). However, there was no obvious difference in the comparison of other values (ADC value and V e) (all p > 0.05). Furthermore, there were 131 patients of positive expression of HER-2, and 101 patients with negative expression of HER-2. All values of K ep, ADC value, and V e showed no apparent difference in the comparison between HER-2-positive expression and HER-2-negative expression groups (all p > 0.05). For more details, please see Table 2.
Immunohistochemical Detection of Positive or Negative Expression of ER, PR, and HER-2 Associated with Parameters of K ep, V e, and Apparent Diffusion Coefficient Value
p < 0.05.
Correlation of quantitative parameters with the expression of Ki-67
Supplementary Figure S2 displayed the positive expression results of Ki-67 via immunohistochemical detection. Observation results of the correlation between different quantitative parameters and the expression of Ki-67 are shown in Table 3. As illustrated in the table, there was positive correlation between K e and expression of Ki-67 (p < 0.05). Meanwhile, ADC value was negatively correlated with the expression of Ki-67 (p < 0.05). However, no obvious difference was found between V e and Ki-67 expression (p > 0.05).
Correlation Between Different Quantitative Parameters of K ep, V e, and Apparent Diffusion Coefficient Value and the Expression of Ki-67
Discussion
The occurrence, development, and prognosis of breast cancer are closely related to angiogenesis, while the spatial and temporal imbalance of tumor tissue microcirculation is the pathological basis for MRI to evaluate the microcirculation of breast cancer. 27 –29 In quantitative parameters of MRI, the capacity transfer constant K ep reflects information about the flow of the contrast agent from the extravascular extracellular space into the lumen. 30 The growth of malignant tumor cells is vigorous, the neovascularization is increased, the basement membrane and endothelial cells are not complete, which result in increased microvessel density, incomplete endothelial cell growth and disordered structure, and the vascular permeability is increased obviously. 31 The rate of the contrast from the lumen of the blood vessels to the extravascular space will be increased, and the converse is also true, which in turn lead to increased K ep, by contrast, tumor tissue of benign lesion is less, the vascular endothelium is relatively intact, and the exchange of contrast agents is slower accordingly. 32 The value of K ep in breast malignant lesion was obviously higher than that of benign lesion. 33 Therefore, the quantitative parameters of K ep in MRI are helpful for the diagnosis and differential diagnosis of breast benign and malignant lesions and have certain clinical value. Furthermore, V e value represents the proportion of extravascular extracellular space to the volume of whole voxels, reflecting the percentage of contrast agents remaining in extravascular extracellular spaces. 34 The results of this study show that there was no significant difference in V e between benign breast lesion group and malignant lesion group, possible reason might be that although the permeability of new blood vessels in malignant lesions is high, their K ep values increase at the same time, but the ratio between them varies unobviously, and the V e is not significantly increased. The blood vessels of benign lesions are different from those of malignant lesions, 35 and they are relatively mature, the K ep value of the benign lesion tissues are relatively low, which result in no significant difference in V e between benign and malignant breast lesions. At the same time, the 3.0 T MR device was used to investigate the efficacy of MRI quantitative parameters (K ep, V e) in the diagnosis and differential diagnosis of breast benign and malignant lesions by using ROC curve. The results suggested that the quantitative parameters of MRI (K ep) were of high efficacy in the diagnosis and differential diagnosis of benign and malignant breast lesions, and have certain clinical value.
In addition, in recent years, with the rapid development and popularization of pathological and immunohistochemical techniques, the biological prognostic factors such as ER, PR, HER-2, and Ki-67 have been widely used in clinical practice. 36 –38 The results showed that K ep was higher in ER and PR negative expression group than that of ER- and PR-positive group, suggesting that when the expression of ER and PR was negative, there was more contrast medium from the extravascular extracellular space to the tumor capillary cavity, and the permeability of the capillary was higher. There was no significant difference in the V e between the positive and negative groups of ER and PR. Furthermore, quantitative parameters reflecting hemodynamic parameters (K ep, V e) were not statistically different between the HER-2-positive group and the HER-2 expression negative group. The reason may be due to the inconsistency between the amplification of HER-2 gene and its protein expression. The K ep of breast cancer tissues positively correlated with the expression of Ki-67. K ep can reflect the angiogenesis activity and the permeability of the blood vessel wall, greater values may suggest that the degree of vascular endothelial differentiation, vascular permeability, and higher blood perfusion in local tumor and the degree of malignancy is increased accordingly; the higher the positive expression of Ki-67 in breast cancer, the greater the possibility of tumor recurrence. In addition, differences in ADC values between positive group and negative group of ER, PR, and HER-2 were not statistically significant, but the ADC value was negatively correlated with the expression of Ki-67, suggesting that ADC value was negatively correlated with the expression of Ki-67, suggesting that the ADC value might be a potential functional imaging indicator for predicting the magnitude of Ki-67 expression.
It is worth noting that foreign scholars have found that analyzing the difference of quantitative parameters of DCE–MRI in benign and malignant tumors can improve the efficiency of tumor diagnosis and differential diagnosis. Habib and Patridge reported that advanced functional MRI parameters can improve the ability to assess biology in vivo using imaging correlates of vascularity, cellularity, and chemical composition of breast lesions. 39 In accordance with past cognition that multiparametric MRI of the prostate could improve the diagnostic accuracy of the prostate cancer, Sah et al. carried out a retrospective review and supported the role of multiparametric MRI in the diagnosis of chronic prostatitis and its differentiation from prostate cancer. 40 Kimura and da Cruz supported that functional MRI facilitate the quantification of dynamic physiologic processes that occur in the brain, and the use of these advanced imaging techniques has been widely accepted and performed widely worldwide in clinical practice for oncologic treatment of the brain. 41 Based on the above, the clinical significance of this article is further confirmed. At present, DCE–MRI and DWI have been gradually used in the clinical MRI examination and research of breast diseases. It is expected that with the continuous improvement of DWI scanning technique and further standardization of scanning methods, especially the continuous application and maturity of DWI related new technologies in the field of breast cancer research, the practical value of DWI is further highlighted in the diagnosis and differential diagnosis of breast benign and malignant tumors, the determination of the invasive range of breast adenocarcinoma, and the evaluation of the curative effect of neoadjuvant chemotherapy for breast cancer.
The shortcomings of this study are first, the sample size was small and the evaluation is not comprehensive, which limited the collection of more clinical data such as BIRADS category that should contribute to the clarification of the authors' results clearly; second, when the quantitative parameters of MRI (K ep, V e) and ADC were measured, there was no effective matching method between the setting of ROI and the points of pathological tissue; and third, pathological types were relatively limited, with invasive ductal carcinoma of the breast. The prognosis of breast cancer with different pathological types may be different. Therefore, sample size should be expanded according to different pathological types of grouping research. Besides, it should be noted that DWI of breast is sensitive to magnetic field inhomogeneity and easily leads to image distortion; it is sensitive to motion and the image is susceptible to motion artifacts; small lesions often cannot be well displayed, and some small lesions cannot be measured; and there are many factors affecting the microdiffusion of water molecules. The critical ADC values for differentiating benign and malignant breast lesions are different because of different research purposes and statistical methods. With the continuous improvement of DWI scanning technology and the further standardization of scanning methods, the clinical application value of DWI in the diagnosis and differential diagnosis of breast benign and malignant lesions, the determination of the infiltration range of breast cancer, and the evaluation of the efficacy of neoadjuvant chemotherapy for breast cancer will be further enhanced. In conclusion, the quantitative parameters of 3.0 T MR functional imaging, K ep, and ADC can be used as a reference index for differential diagnosis of benign and malignant breast cancers and for biological behavior evaluation, indicating potential clinical value of noninvasive preoperative evaluation of breast cancer prognosis in clinical.
Footnotes
Authors' Contributions
Study design: C.C., H.X. Experimental studies: L.Z. Data analysis: X.C. Article editing: M.X.
Acknowledgment
The authors acknowledge the reviewers for their helpful comments on this article.
Disclosure Statement
There are no existing financial conflicts.
Funding Information
This study was supported by National Natural Science Foundation of China (No. 81803778), Key Research and Development project of Zhejiang Province (No. 2018C03024), Zhejiang Province Medical and Health Care Key Project (Nos. 2016146810, 2018KY197, and 2018KY932), Experimental Animal Science and Technology Projects of Zhejiang Province (No. 2017C37178), High-level Talent Project of Lishui City (Nos. 2016RC22 and 2018RC17), and Public Welfare Project of Lishui City (Nos. 2016GYX39 and 2017ZDXK09).
Supplementary Material
Supplementary Figure S1
Supplementary Figure S2
References
Supplementary Material
Please find the following supplemental material available below.
For Open Access articles published under a Creative Commons License, all supplemental material carries the same license as the article it is associated with.
For non-Open Access articles published, all supplemental material carries a non-exclusive license, and permission requests for re-use of supplemental material or any part of supplemental material shall be sent directly to the copyright owner as specified in the copyright notice associated with the article.