
Abstract
A recent study reported the oncogenic function of lncRNA NR2F1-AS1 in liver cancer. Interestingly, by analyzing TCGA data set, downregulation of NR2F1-AS1 in colorectal cancer (CRC) was observed. This observation triggered interest to analyze the functions of NR2F1-AS1 in CRC. It was observed that NR2F1-AS1 was downregulated in CRC and predicted poor survival. NR2F1-AS1 can directly interact with miR-371a-3p but their overexpression failed to affect the expression of each other. However, NR2F1-AS1 overexpression led to the upregulation of TOB1, a target of miR-371a-3p. Cell proliferation analysis revealed reduced proliferation rate of CRC cells after NR2F1-AS1 and TOB1 overexpression. MiR-371a-3p overexpression played an opposite role and reduced the effects of NR2F1-AS1 and TOB1 overexpression. In conclusion, NR2F1-AS1 regulates miR-371a-3p/TOB1 axis to suppress proliferation of CRC cells.
Introduction
For decades colorectal cancer (CRC) is among the top five mostly diagnosed malignancies among all cancers. 1 In 2018, CRC affected 1,096,601 new cases, who represent 6.1% of all newly diagnosed cases. 2 During the same year, 551,269 patients died of CRC, who represent 5.8% of all cancer deaths in this year. 2 The only radical treatment of all solid tumors including CRC is still surgical resection, which is only applicable for patients diagnosed at early stages. 3 However, due to the lack of effective early diagnostic marker, the early diagnostic rate of CRC is low. 4 Advanced CRC can only be treated by chemotherapies or radiation therapies. 5 Although initial response to these therapies can usually be reached, long-term survival is generally poor. 6
Targeted therapies are emerging next-generation anticancer therapeutic approaches. 7 Targeted therapies interfere with specific genes involved in tumor biology, thus the development of targeted therapies relies on the functional characterization of genetic factors involved in cancer. 8 Previous studies have characterized a considerable number of genetic alterations involved in CRC. 9,10 However, the function of most genetic factors remains unclear. 9,10 A recent study reported the oncogenic function of lncRNA NR2F1-AS1 in liver cancer. 11 A TCGA data set was analyzed. Interestingly, downregulation of NR2F1-AS1 in CRC was observed. In addition, this preliminary bioinformatics analysis revealed the potential interaction between NR2F1-AS1 and miR-371a-3p, which has been characterized as an oncogenic miRNA in gastric cancer. 12 Those observations triggered interest to analyze the potential interaction between NR2F1-AS1 and miR-371a-3p in CRC.
Materials and Methods
CRC patients, tissue collection, and follow-up
This study included a total of 62 CRC patients (38 males and 24 females, 41 to 67 years, 54.1 ± 6.6 years) at the First Affiliated Hospital of the Henan University of Science and Technology between May 2011 and May 2013. This study was approved by the First Affiliated Hospital of the Henan University of Science and Technology Ethics Committee before the enrollment of patients. All patients signed informed consent. All patients were newly diagnosed cases. Patients complicated with other clinical disorders or those who had been treated before admission were excluded from this study. All the 62 patients were subjected to fine needle biopsies to collect paired fresh nontumor and CRC tissue samples. All samples were confirmed by histopathological examinations. The 62 patients included 12, 18, 15, and 17 cases at AJCC stages I, II, III, and IV, respectively. Based on clinical stages and patients' conditions, patients were treated by surgical resection, and/or chemotherapies or radiation therapies. Patients were followed up for 5 years to record their survival conditions. All patients completed the follow-up.
CRC cell line and cell culture
Human CRC cell line RKO (ATCC) was used. Cell culture was performed in a 5% CO2 incubator at 37°C with 95% humidity. Cell culture medium was composed of 10% FBS and 90% EMEM.
Transient cell transfections
With pcDNA3.1 vector (Invitrogen) as backbone, expression vectors of NR2F1-AS1 and TOB1 were constructed. Negative control (NC) miRNA and miR-371a-3p mimic were synthesized by Invitrogen. RKO cells were harvested at 75%–85% confluence, followed by the transfection of 10 nM vector or 40 nM miRNA into 106 cells using Lipofectamine 2000 (Thermo Fisher Scientific). Control (C) cells were untransfected cells. NC cells were cells transfected with NC miRNA or empty vector. The following experiments were performed at 24 h post-transfection.
Dual luciferase reporter assay
PsiCHECK-2 vector (Promega Corporation) was used to establish NR2F1-AS1 vector. Lipofectamine 2000 (Thermo Fisher Scientific) was used to transfect NR2F1-AS1 vector+NC miRNA (NC group) or NR2F1-AS1 vector+miR-371a-3p mimic (miR-371a-3p group) into RKO cells. At 48 h post-transfection, cells were harvested and luciferase activity was measured.
RNA samples and RT-q polymerase chain reaction
Monarch Total RNA Miniprep Kit (NEB No. T2010; NEB) was used to extract and purify total RNA from tissue samples (both CRC and nontumor tissues from each patient) and RKO cells. To remove genomic DNAs, DNA eraser (Takara) was used to digest all RNA samples. Precision nanoScript2 Reverse Transcription Kit (Primerdesign) was used to perform all total RNA reverse transcriptions and SYBR Premix Ex Taq™ kit (Takara) was used to prepare polymerase chain reaction (PCR) mixtures to measure the expression levels of NR2F1-AS1 and TOB1 mRNA with GAPDH as endogenous control. The mirPremier™ microRNA Isolation Kit (Sigma-Aldrich) was used to extract total RNAs. All-in-One™ miRNA qRT-PCR Detection Kit (Genecopoeia) was used to measure the expression levels of miR-371a-3p with U6 as endogenous control. All PCRs were performed in three technical replicates and 2−ΔΔcq method was used to calculate fold changes of gene expression levels. To normalize gene expression levels in tissue samples, the sample with the highest Δcq value was set to “1” and all other samples were normalized to this sample.
Western blot assay
Total Protein Extraction Kit (NBP2-37853; Novus Biologicals) was used to extract total proteins from RKO cells, following which BCA assay (Sigma-Aldrich) was used to measure protein concentrations. All protein samples were boiled in water for 10 min, followed by separation of proteins using 10% sodium dodecyl sulfate-polyacrylamide gel electrophoresis (SDS–PAGE). After gel transfer to PVDF membranes, PBS containing 5% nonfat milk was used to block membranes. After that, GAPDH (ab9845; Abcam) and TOB1 (ab236859; Abcam) primary antibodies were used to incubate with membranes for 12 h at 4°C. HRP goat antirabbit (IgG) (ab6721; Abcam) secondary antibody was used to further incubate with the membranes for 2 h at room temperature. Signals were developed using chemiluminescent substrate (Advansta). Signals were quantified using Quantity One software (Bio-Rad Laboratories).
Cell proliferation assay
Single cell suspensions (105 cell/mL) were prepared using RKO cells collected at 24 h post-transfection, followed by performing CCK-8 assay (DOJINDO, Japan) to detect cell proliferation. In brief, 104 cells in 0.1 mL cell suspension were seeded onto each well of a 96-well cell culture plate, followed by cell culture under aforementioned conditions. CCK-8 solution was added into each well at 4 h before cell collection. Cell culture medium was collected every 24 h until 96 h and OD values were measured at 450 nm.
Statistical analysis
All statistical analyses were performed using GraphPad Prism 6 software with data expressed as mean values of three biological replicates. Paired t test was used to compare CRC and nontumor tissues. Unpaired t test was used to compare two groups. ANOVA (one-way) was used to compare multiple groups, following which Tukey test was used to compare two groups. The 62 patients were divided into high and low NR2F1-AS1 level groups (n = 31) with median expression level of NR2F1-AS1 in CRC as cutoff value. Survival cure plotting and comparisons were performed by K-M plotter and log-rank test, respectively. p < 0.05 was statistically significantly.
Results
NR2F1-AS1 was downregulated in CRC
The differential expression of NR2F1-AS1 in CRC was first explored by analyzing TCGA data set. It was observed that expression level of NR2F1-AS1 was lower in CRC tissues than in nontumor tissues (1.99 vs. 3.73, p < 0.001). To further analyze the differential expression, expression levels of NR2F1-AS1 in both CRC and nontumor tissues were measured by qPCR. Paired t test showed that, comparing with nontumor tissues, expression levels of NR2F1-AS1 were significantly lower in CRC tissues (Fig. 1, p < 0.001).
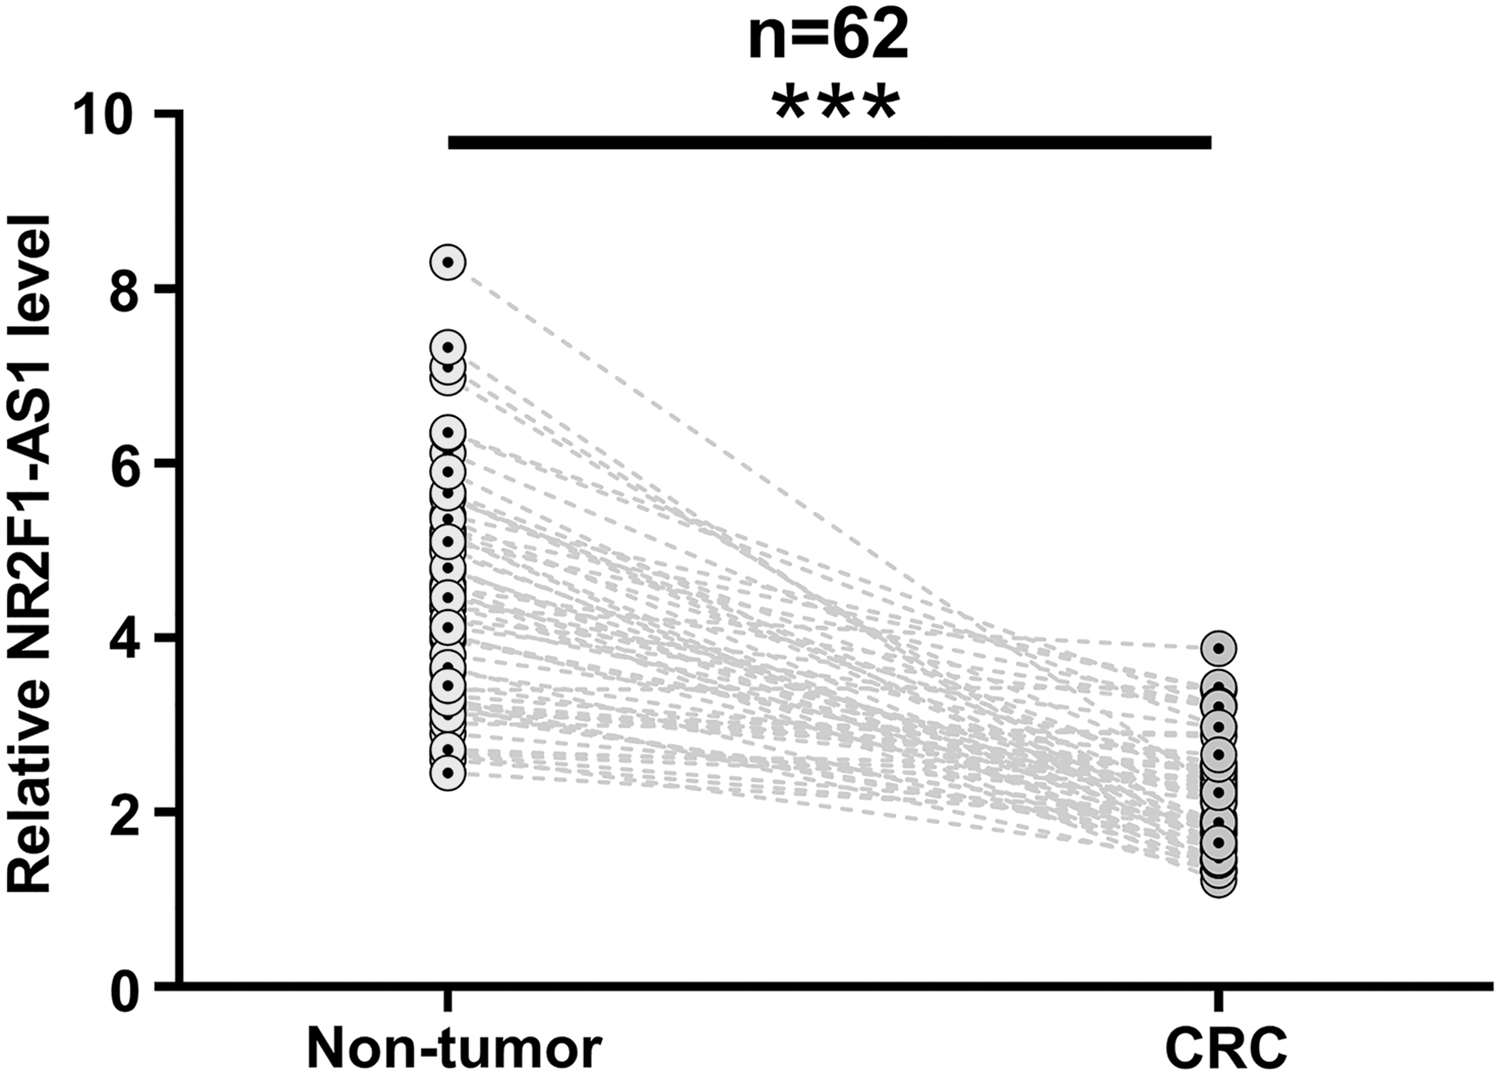
NR2F1-AS1 was downregulated in CRC. Expression levels of NR2F1-AS1 in both CRC and nontumor tissues from 62 CRC patients were measured by qPCR. The sample with the highest Cq value was set to “1” and all other samples were normalized to this sample. Paired t test was used for data comparison. All PCRs were repeated three times and mean values are presented. ***p < 0.001. CRC, colorectal cancer; qPCR.
Low level of NR2F1-AS1in CRC tissues predicted the poor survival of CRC patients
The 62 patients were divided into high and low NR2F1-AS1 level groups (n = 31) with median expression level of NR2F1-AS1 in CRC as cutoff value (Fig. 2A). Survival curves were plotted and compared between high and low NR2F1-AS1 level groups using the aforementioned methods. Comparing with high NR2F1-AS1 level group, survival rate of patients in low NR2F1-AS1 level group was significantly lower (Fig. 2B). Therefore, NR2F1-AS1 may be used as a prognostic marker for CRC.

Low level of NR2F1-AS1in CRC tissues predicted the poor survival of CRC patients. The 62 patients were divided into high and low NR2F1-AS1 level groups (n = 31) with median expression level of NR2F1-AS1 in CRC as cutoff value
NR2F1-AS1 and miR-371a-3p can directly interact but failed to affect the expression of each other
The potential base pairing formed by NR2F1-AS1 and miR-371a-3p was predicted by IntaRNA. 13 It was observed that NR2F1-AS1 and miR-371a-3p can form strong base pairing (Fig. 3A). To analyze the interactions between NR2F1-AS1 and miR-371a-3p, dual luciferase assay was performed by transfecting NR2F1-AS1 vector+NC miRNA (NC group) or NR2F1-AS1 vector+miR-371a-3p mimic (miR-371a-3p group) into RKO cells. Comparing with the NC group, relative luciferase activity was significantly lower in the miR-371a-3p group (Fig. 3B, p < 0.05). To further analyze the interaction between them, RKO cells were transfected with NR2F1-AS1 expression vector or miR-371a-3p mimic. Overexpression of NR2F1-AS1 and miR-371a-3p was confirmed by qPCR at 24 h post-transfection (Fig. 3C, p < 0.05). Interestingly, overexpression of NR2F1-AS1 and miR-371a-3p failed to affect the expression of each other (Fig. 3D).

NR2F1-AS1 and miR-371a-3p can directly interact but failed to affect the expression of each other. The potential base pairing formed by NR2F1-AS1 and miR-371a-3p was predicted by IntaRNA. It was observed that NR2F1-AS1 and miR-371a-3p can form strong base pairing
NR2F1-AS1 overexpression led to the upregulation of TOB1
TOB1 is a target of miR-371a-3p. In this study, qPCR and Western blot were used to analyze the effects of miR-371a-3p and NR2F1-AS1 overexpression on the expression of TOB1 at mRNA (Fig. 4A) and protein (Fig. 4B) levels, respectively. Comparing with C group, miR-371a-3p overexpression led to the downregulation of TOB1. NR2F1-AS1 overexpression played an opposite role and reduced the effects of miR-371a-3p overexpression (p < 0.05).
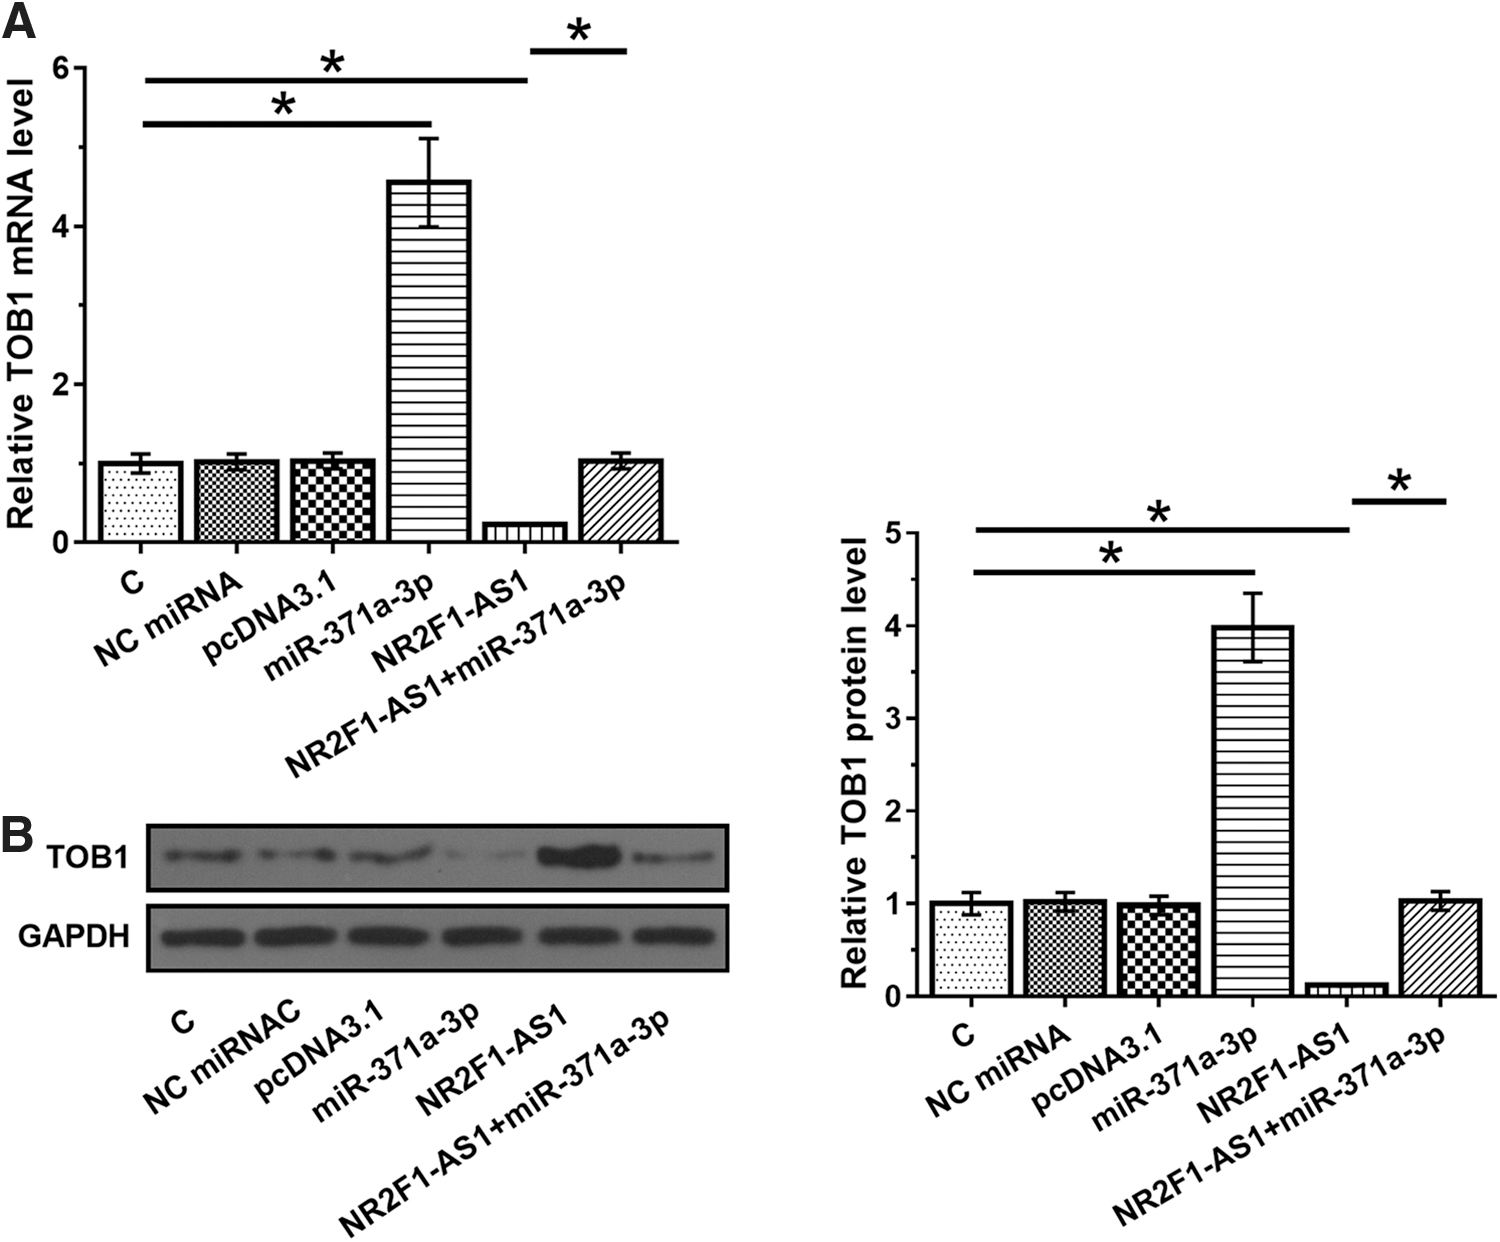
NR2F1-AS1 overexpression led to the upregulation of TOB1. TOB1 is a target of miR-371a-3p. In this study, qPCR and Western blot were used to analyze the effects of miR-371a-3p and NR2F1-AS1 overexpression on the expression of TOB1 at mRNA
NR2F1-AS1 regulated miR-371a-3p/TOB1 to inhibit the proliferation of RKO cells
CCK-8 assay was performed to analyze the effects of transfections on the proliferation of RKO cells. Cell proliferation analysis revealed reduced proliferation rate of CRC cells after NR2F1-AS1 and TOB1 overexpression. MiR-371a-3p overexpression played an opposite role and reduced the effects of NR2F1-AS1 and TOB1 overexpression (Fig. 5, p < 0.05).

NR2F1-AS1 regulated miR-371a-3p/TOB1 to inhibit the proliferation of RKO cells. CCK-8 assay was performed to analyze the effects of transfections on the proliferation of RKO cells. Cells were collected at 24, 48, 72, and 96 h after the initiation of cell culture to monitor cell proliferation. All experiments were repeated three times and mean values are presented. *p < 0.05. RKO.
Discussion
This study mainly investigated the roles of NR2F1-AS1 in CRC. It was found that NR2F1-AS1 was downregulated in CRC and may regulate miR-371a-3p/TOB1 axis to suppress the proliferation of CRC cells.
The functionality of NR2F1-AS1 has only been investigated in liver cancer. 11 It has been reported that NR2F1-AS1 is upregulated in liver cancer and promotes the development of oxaliplatin resistance by interacting with miR-363 and ABCC 1. Inhibition of NR2F1-AS1 expression led to the inhibited migration of liver cancer cells. 11 However, TCGA data set was analyzed and no obvious differences in expression levels of NR2F1-AS1 were observed between liver cancer and nontumor tissues (2.11 vs. 2.07). This is possibly due to the different populations involved in these two data sets. Future studies are needed to further analyze the expression pattern of NR2F1-AS1 in liver cancer. This study is the first to report the downregulation of NR2F1-AS1 in CRC. In addition, overexpression of NR2F1-AS1 led to the reduced proliferation rate of CRC cells, indicating the tumor suppressive roles of NR2F1-AS1 in CRC. Therefore, NR2F1-AS1 may play different roles in different types of cancers.
The application of novel diagnostic and treatment approaches has significantly improved the survival of CRC patients in past several decades. 14 However, at present, only <40% of CRC patients are diagnosed at localized stage. 15 The low early diagnostic rate of CRC is unlikely to be significantly improved due to the lack of sensitive markers. As an alternative approach, the development of accurate prognostic biomarkers may improve the survival of advanced stage CRC patients by guiding the personalized therapeutic approaches. In this study, it was proved that low levels of NR2F1-AS1 expression predicted the poor survival of CRC patients. However, the accuracy of the use of NR2F1-AS1 as a prognostic marker of CRC remains to be further tested.
The expression of miR-371a-3p is usually upregulated in cancer. 12,16 In a recent study, Terbuch et al. reported that miR-371a-3p can target TOB1 in gastric cancer to promote cancer development. 12 Consistently, this study also observed the downregulation of TOB1 and increased proliferation rate of CRC cells after miR-371a-3p overexpression. Therefore, miR-371a-3p may also play oncogenic roles in CRC by targeting TOB1. The data suggestion NR2F1-AS1 may harbor or sponge miR-371a-3p to upregulate TOB1 and suppress CRC cell proliferation. This observation enriched the understanding on the molecular pathogenesis of CRC.
In conclusion, NR2F1-AS1 is downregulated in CRC and may regulate miR-371a-3p/TOB1 axis to suppress the proliferation of CRC cells.
Footnotes
Disclosure Statement
No competing financial interests exist.
Funding Information
No funding was received for this article.