
Abstract
Background:
It has been reported that long noncoding RNA (lncRNA) MT1JP played a tumor-suppressive role in the development of many organs, such as liver and lung, but the exact mechanism is still unknown. In addition, the involvement of MT1JP in osteosarcoma (OS) and its clinical values are unknown. In this study, the authors explored the interactions among lncRNA MT1JP, miR-646, and FOXK1 in OS.
Materials and Methods:
Expression levels of MT1JP in both tumor and nontumor tissues from 42 early stage OS patients were measured by reverse transcription-quantitative polymerase chain reaction (RT-qPCR). Plasma levels of MT1JP in both OS patients (n = 42) and healthy controls (n = 42) were also measured by RT-qPCR. ROC curve as used for diagnostic analysis. Overexpression experiments were performed to analyze the interaction among MT1JP, miR-646, and FGF2. Cell invasion and migration were analyzed by Transwell assays.
Results:
The authors found that MT1JP was significantly downregulated in OS tissues than in adjacent noncancer tissues. In addition, plasma MT1JP was also downregulated in OS patients than in healthy controls. The lower plasma levels of MT1JP in OS patients distinguished early stage OS patients from healthy controls. miR-646 was positive, but FGF2 was negatively correlated with MT1JP across OS tissues. The MT1JP overexpression upregulated miR-646 and downregulated FGF2, while the miR-646 overexpression downregulated FGF2, but showed no significant effects on the MT1JP expression. MT1JP and miR-646 overexpression inhibited the migration and invasion of OS cells. The FGF2 overexpression played the opposite role and attenuated the effects of MT1JP and miR-646 overexpression.
Conclusions:
In conclusion, MT1JP might downregulate FGF2 through miR-646 to inhibit OS cell migration and invasion. The downregulation of plasma circulating MT1JP may serve as an early diagnostic biomarker for OS.
Introduction
Osteosarcoma (OS) is a type of malignancy from mesenchymal cells that are responsible for bone formation. 1 OS mainly affects young adults and children. 2 Due to its rapid development and malignant nature, OS causes an unacceptable mortality rate, with 3.4–4.3 per million of the incidence across the world. 3 With active treatments, such as adjuvant or neoadjuvant chemotherapy, tumor excision, and radiotherapy, only <65% patients with nonmetastatic OS can live longer than 5 years after the initial diagnosis. 4 For metastatic OS patients, the overall 5-year survival rate drops to below 50%. 5 Therefore, early diagnostic biomarkers and novel therapeutic approaches are always needed to improve the survival of OS patients.
Studies on the genetics of OS have identified a considerable number of genes that can act as candidate therapeutic targets for OS. 6,7 Long (>200 nt) noncoding RNAs (lncRNAs) are an emerging group of critical regulators in diverse biological activities, including tumorigenesis. 8,9 lncRNAs regulate the expression of downstream cancer-related factors, thereby inhibiting or accelerating the development of OS. 10 Therefore, investigations on the functions of lncRNAs in OS are always needed to improve the understanding on the pathogenesis of this disease. Long noncoding RNA (lncRNA) MT1JP has been reported to play a tumor-suppressive role in the development of many organs, such as liver and lung, 11,12 but the exact mechanism is still unknown. It is known that both MT1JP and miR-646 have crosstalk with p53 signaling. 11,13 Therefore, MT1JP may indirectly interact with miR-646. miR-646 inhibits cancer development and progression mainly by downregulating oncogenes. 14 In OS, miR-646 directly targets FGF2 to inhibit caner metastasis. 15 This study explored the interactions among MT1JP, miR-646, and FOXK1 in OS.
Materials and Methods
Study patients
Shouguang Hospital of Traditional Chinese Medicine admitted a total of 88 OS patients from June 2015 to September 2018. The authors' study selected 42 (23 males and 19 females, 18–39 years, 30.1 ± 5.5 years) out of those patients. Inclusion criteria were as follows: (i) newly diagnosed cases; (ii) no therapies were performed before admission; and (iii) AJCC stage I (n = 19) or II (n = 23). Exclusion criteria were as follows: (i) recurrent OS; (ii) OS patients transferred from other hospitals; and (iii) multiple disorders were diagnosed. During the same period, their study also enrolled 42 healthy volunteers (23 males and 19 females, 18–38 years, 30.3 ± 5.3 years) to be used as a control group. All participants were informed of the experimental principle, and informed consent was signed by all of them. This study passed the review of the Ethics Committee of the aforementioned hospital.
Specimens
All OS patients underwent histopathological biopsy. OS (cancer) and adjacent nontumor tissues (0.05–0.09 g) were collected from each OS patient.
Before any therapies, fasting blood (4–5 mL) was carried out for each OS patient and healthy volunteer. Blood was immediately collected using EDTA-containing tubes, and followed by centrifugation with 1200 g for 15 min at room temperature to obtain plasma.
Cells and transient transfection
For in vitro experiments, U2OS (ATCC) human OS cell line was maintained in Eagle's Minimum Essential Medium containing 10% fetal bovine serum (FBS) under conditions of 37°C and 5% CO2.
Expression vectors (pcDNA3 vector) of MT1JP (NCBI accession: NR_036677.1) and FGF2 (NCBI accession: NM_002006.5) were from Sangon (Shanghai, China). miRNA-646 mimic (5′-AAGCAGCUGCCUCUGAGGC-3′) and negative control (NC) miRNA (5′-CUAGUCAUCGAUGUCGUAGCA-3′) were from Sigma-Aldrich. U2OS cells (2 × 10⁵ cells) harvested at the confluence of 70%–80% were transfected with 10 nM empty pcDNA3 vector (NC), or 10 nM MT1JP or FGF2 expression vector, or 35 nM NC miRNA (NC), or 35 nM miR-646 mimic using lipofectamine 2000 (Thermo Fisher Scientific). Besides NC, this experiment also included a control (C) group, which included cells without transfections.
Reverse transcription-quantitative polymerase chain reaction
One milliliter Ribozol (Sigma-Aldrich) was used to extract total RNAs from 105 cells, 0.05 g tissue, or 0.2 mL plasma. After digestion with DNase I, AMV Reverse Transcriptase (Canvax Biotech) and QuantiTect SYBR Green PCR Kit (Qiagen, Shanghai, China) were used for reverse transcriptions and PCR, respectively. Expression of MT1JP and FGF2 was detected using 18S rRNA or GAPDH as endogenous control, respectively.
High Pure miRNA Isolation Kit (Cat# 5080576001; Sigma-Aldrich) was used to extract miRNA. miRNA reverse transcription was performed using MystiCq® microRNA cDNA Synthesis Mix (Sigma-Aldrich), and quantitative polymerase chain reaction (qPCR) was carried out using MystiCq microRNA® SYBR® Green qPCR ReadyMix™ (Sigma-Aldrich) to measure the level of miR-646 expression with U6 as an endogenous control.
Primer sequences were: 5′-ACCGCGGCTCGAAATGGACC-3′ (forward) and 5′-CACACTTGGCTCAGCCCATGG-3′ (reverse) for MT1JP; 5′-GTATTCCTAAAGTACATTGC-3′ (forward) and 5′-CTGACAGTAGAGGTCTGAAAG-3′ (reverse) for FGF2; 5′-GCTTAATTTGACTCAACACGGGA-3′ (forward) and 5′-AGCTATCAATCTGTCAATCCTGTC-3′ (reverse) for 18S rRNA; 5′-GTCTCCTCTGACTTCAACAGCG-3′ (forward) and 5′-ACCACCCTGTTGCTGTAGCCAA-3′ (reverse) for GAPDH. Forward primer of miR-646 was 5′-AAGCAGCUGCCUCUGAG-3′. miR-646 reverse primer and U6 primers were included in the kit.
Three biological replicates were set for each experiment. 2−ΔΔCT method 16 was used to analyze CT values. The sample with the lowest ΔCT value was set to “1.” All other samples were normalized to this sample.
Invasion and migration assay
U2OS cells (3 × 10⁴) collected at 24 h after transfections were mixed with 1 mL fresh medium. To test cell invasion and migration abilities, the upper chamber was added with 0.12 mL cell suspension, and Eagle's Minimum Essential Medium (20% FBS) was inserted into the lower Transwell chamber. Before invasion assay, Matrigel (300 μg/mL; Millipore) was used to coat the upper chamber for 12 h at 37°C. Cells were cultivated at 37°C for 10 h. Following cell culture, 1% crystal violet (Sigma-Aldrich) was used to stain the upper chamber membrane (20 min at 25°C). A light microscope was used to observe the stained cells.
Western blot
RIPA solution (Thermo Fisher Scientific) was used to extract total protein from cells with a ratio of 105 cells per 1 mL solution. Protein samples were incubated in boiling water for 10 min. Electrophoresis was then carried out using sodium dodecyl sulfate-polyacrylamide gel electrophoresis (10%). After gel transfer (polyvonylidene difluoride membranes) and blocking for with 5% nonfat milk 2 h, membranes were incubated with FGF2 (1:800, ab10421; Abcam) and GAPDH (1: 800, ab8245; Abcam) rabbit polyclonal primary antibodies (18 h at 4°C), and then immersed into immunoglobulin G-horseradish peroxidase (sc-2004; Santa Cruz Biotechnology) goat anti-rabbit secondary antibody. Signals were produced using ECL (Sigma-Aldrich). ImageJ v1.46 software was used to analyze data.
Statistical analysis
Values present in this article were all mean values. Mean values were calculated using data from three biological replicates. Differences between the two types of tissues were analyzed by paired-test. Differences between patients and healthy volunteer were explored using unpaired t test. Analysis of variance (one-way) combined with the Tukey's test was used for multigroup comparisons. Linear regression was performed to analyze correlations. ROC curve analysis was used for diagnostic analysis. p < 0.05 was statistically significant.
Results
MT1JP was downregulated in OS
MT1JP in OS tissue, normal one, and plasma was detected by reverse transcription-quantitative polymerase chain reaction (RT-qPCR). For data normalization, the sample with the lowest ΔCT value was set to “1,” and other samples were normalized to this sample. Differences in expression level of MT1JP between OS and nontumor tissues were analyzed by paired t test. Significantly lower expression level of MT1JP is observed in OS tissues comparing to nontumor tissues (Fig. 1A, p < 0.05). Differences in plasma level of MT1JP between OS patients and Control group was explored by unpaired t-test. It is found that plasma level of MT1JP is significantly lower in OS patients than in the Control group (Fig. 1B, p < 0.05).
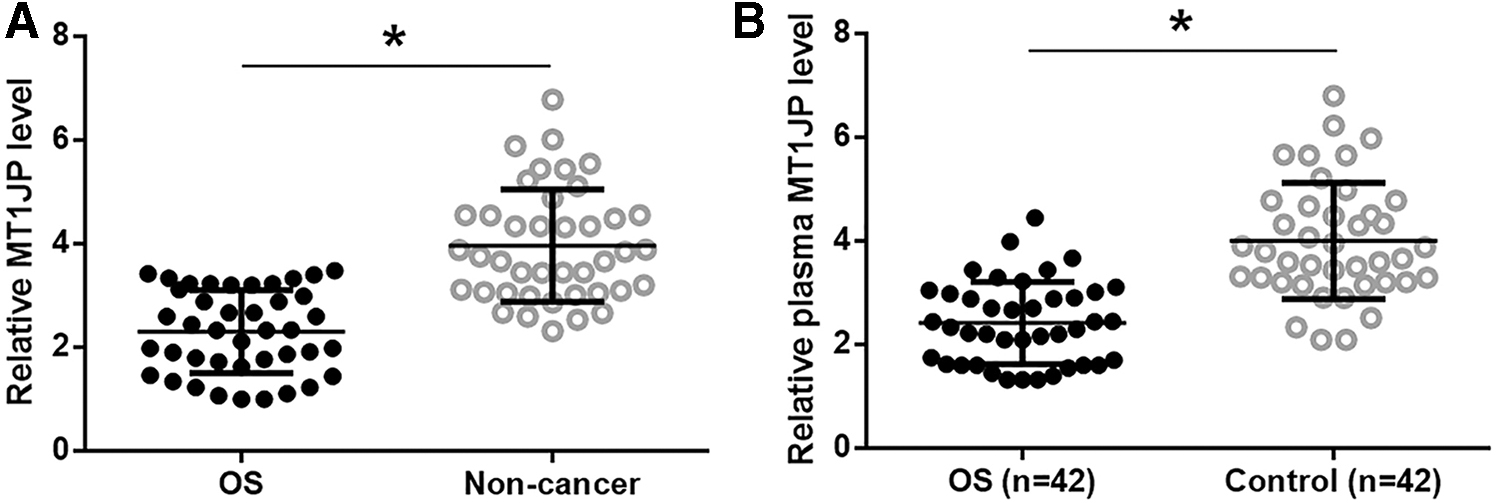
MT1JP was downregulated in OS. MT1JP in OS tissue, nontumor tissue of OS patients and in plasma was detected by RT-qPCR. Paired t-test showed that MT1JP expression level was significantly lower in OS tissues than in nontumor tissues
Altered plasma levels of MT1JP distinguished early-stage OS patients from healthy controls
To evaluate the early diagnostic value of plasma MT1JP for OS, their study only included OS patients at stage I or II. In ROC curve analysis, true negative cases were healthy controls (n = 42), while true positive cases were OS patients (n = 88). All other parameters were the default (Fig. 2). It is observed that area under the curve (AUC) is 0.88 (AUC >0.65 suggests diagnostic potential). Linear regression analysis shows that plasma level of MT1JP is significantly correlated with the expression level of MT1JP in OS tissues (Supplementary Fig. S1A, p < 0.0001), but has no effect on the expression level of MT1JP in nontumor tissues (Supplementary Fig. S1B, p > 0.05, data not shown). Moreover, there are no significant differences between male and female patients in the expression level of MT1JP in OS, nontumor, and plasma specimens (all p > 0.05, data not shown).
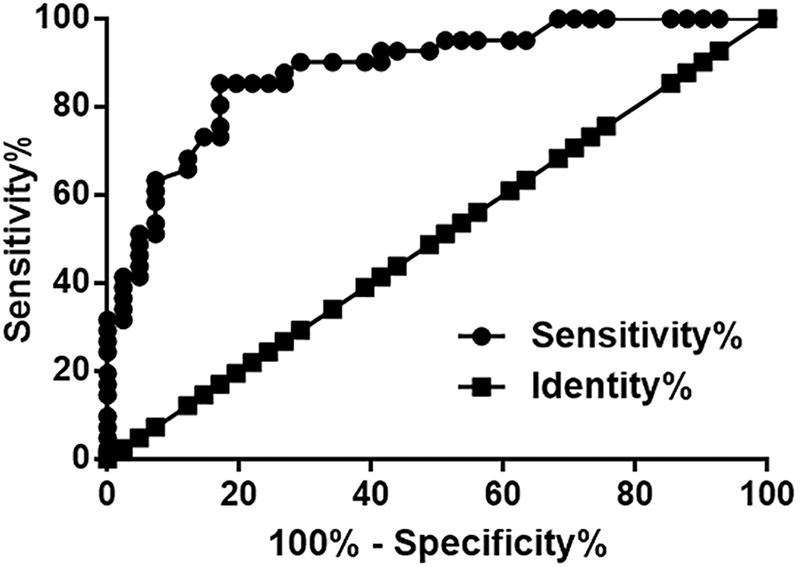
Changes of plasma level of MT1JP in early stage OS patients and healthy controls. Plasma levels of MT1JP distinguished early stage OS patients from healthy controls.
miR-646 and FGF2 mRNA were significantly correlated with MT1JP in OS tissues
miR-646 and FGF2 mRNA in OS tissues were also detected by RT-qPCR. Correlations between miR-646/MT1JP and FGF2/MT1JP were analyzed by linear regression. It is found that miR-646 is positively correlated with MT1JP in OS tissues (Fig. 3A), but contrary to FGF2 (Fig. 3B).
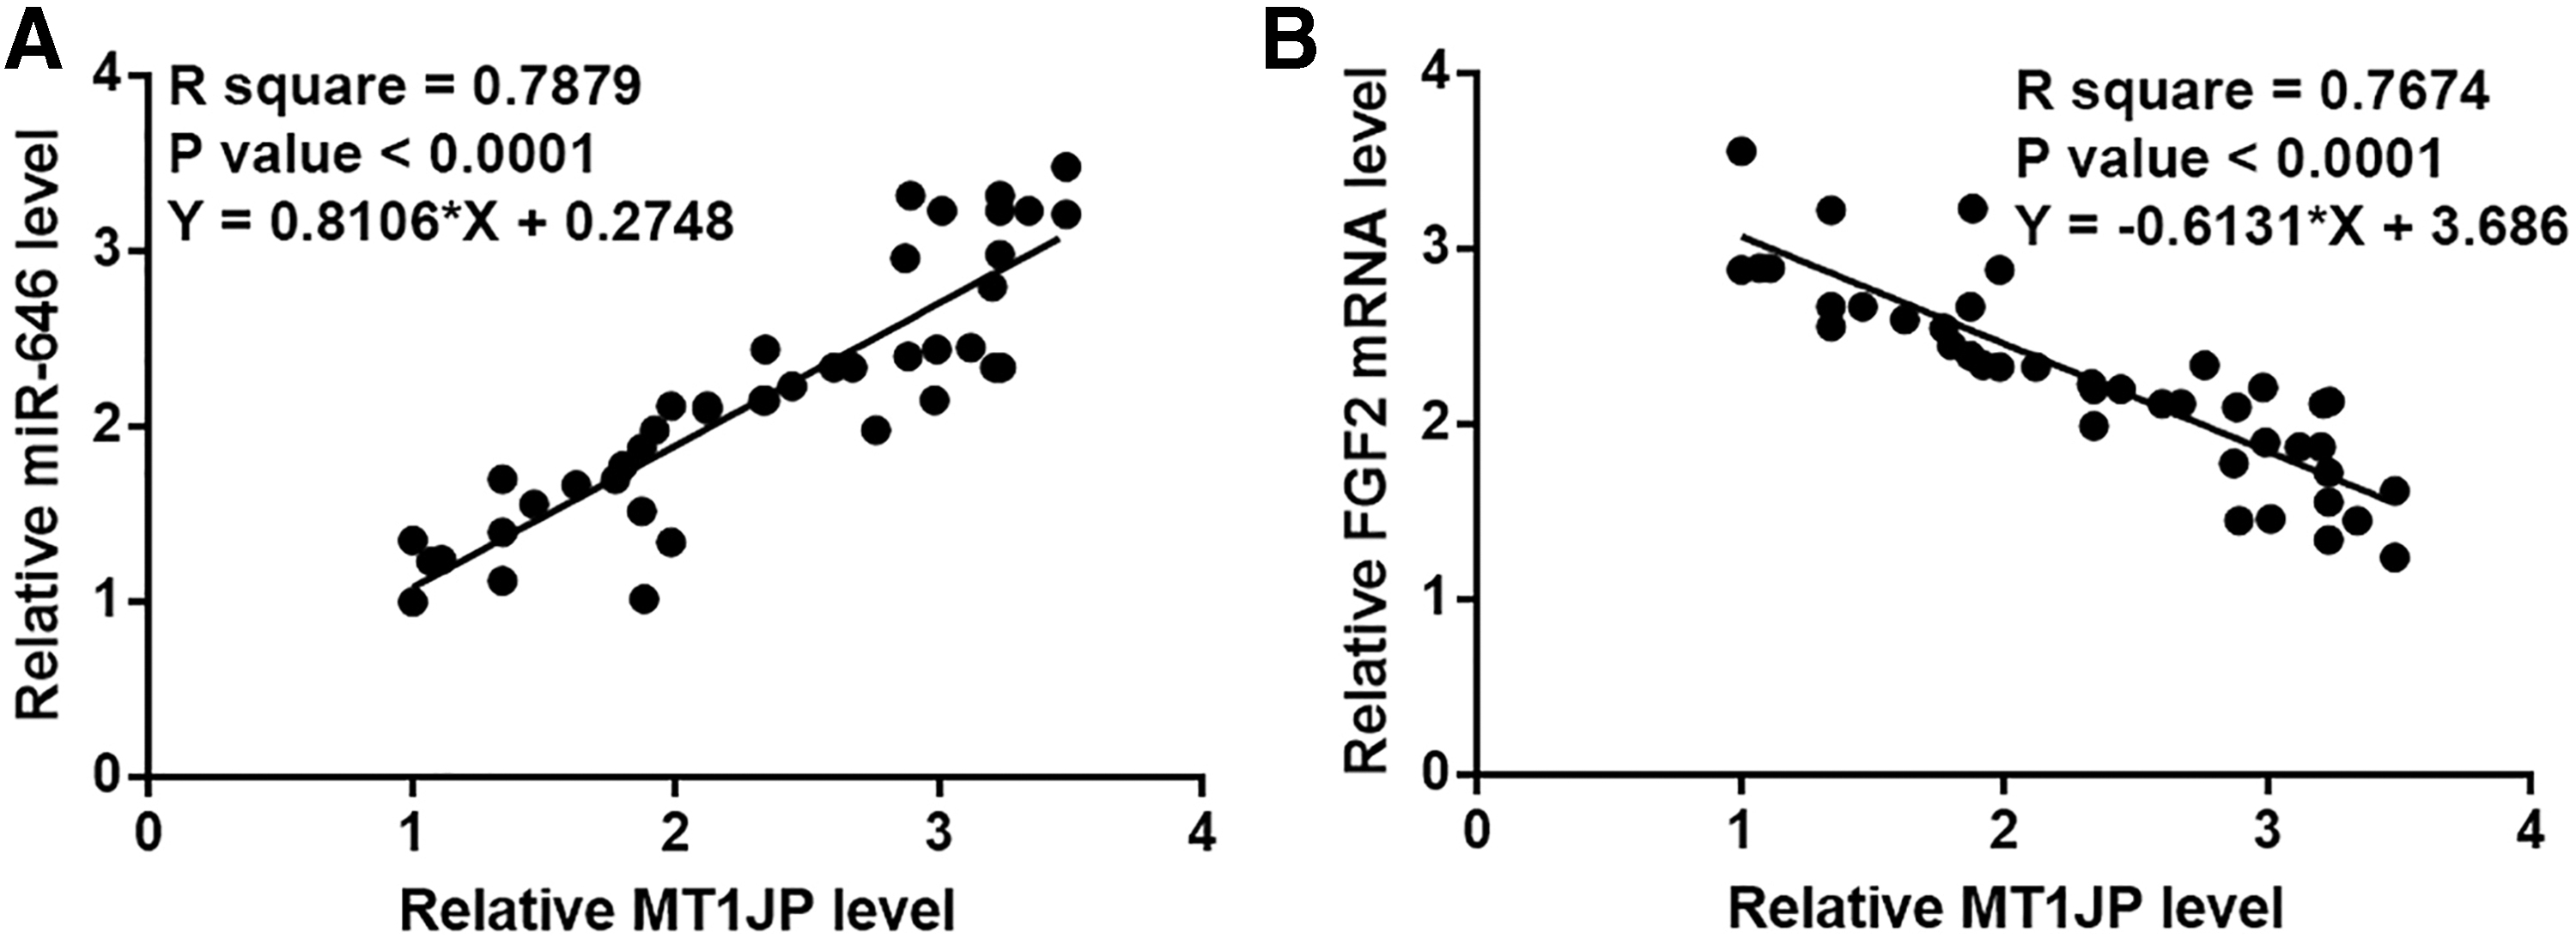
miR-646 and FGF2 mRNA were significantly correlated with MT1JP in OS tissues. Linear regression revealed a positive correlation between miR-646 and MT1JP
MT1JP upregulated miR-646 to downregulated FGF2
MT1JP expression vector, miR-646 mimic, and FGF2 vector were transfected into U2OS cells. In all cases, the expression level of Control (C) group was set to “1,” and all other groups were normalized to this group. At 24 h after transfections, expression levels of MT1JP, miR-646, and FGF2 are significantly increased by comparison with NC and C (Fig. 4A, p < 0.05). MT1JP overexpression upregulated miR-646, while miR-646 overexpression has no significant effect on the expression level of FGF2 (Fig. 4B, p < 0.05). Moreover, MT1JP or miR-646 overexpression alone results in the downregulation of FGF2 expression (Fig. 4C, p < 0.05). However, FGF2 overexpression fails to significantly affect the expression of MT1JP and miR-646 (Fig. 4D).
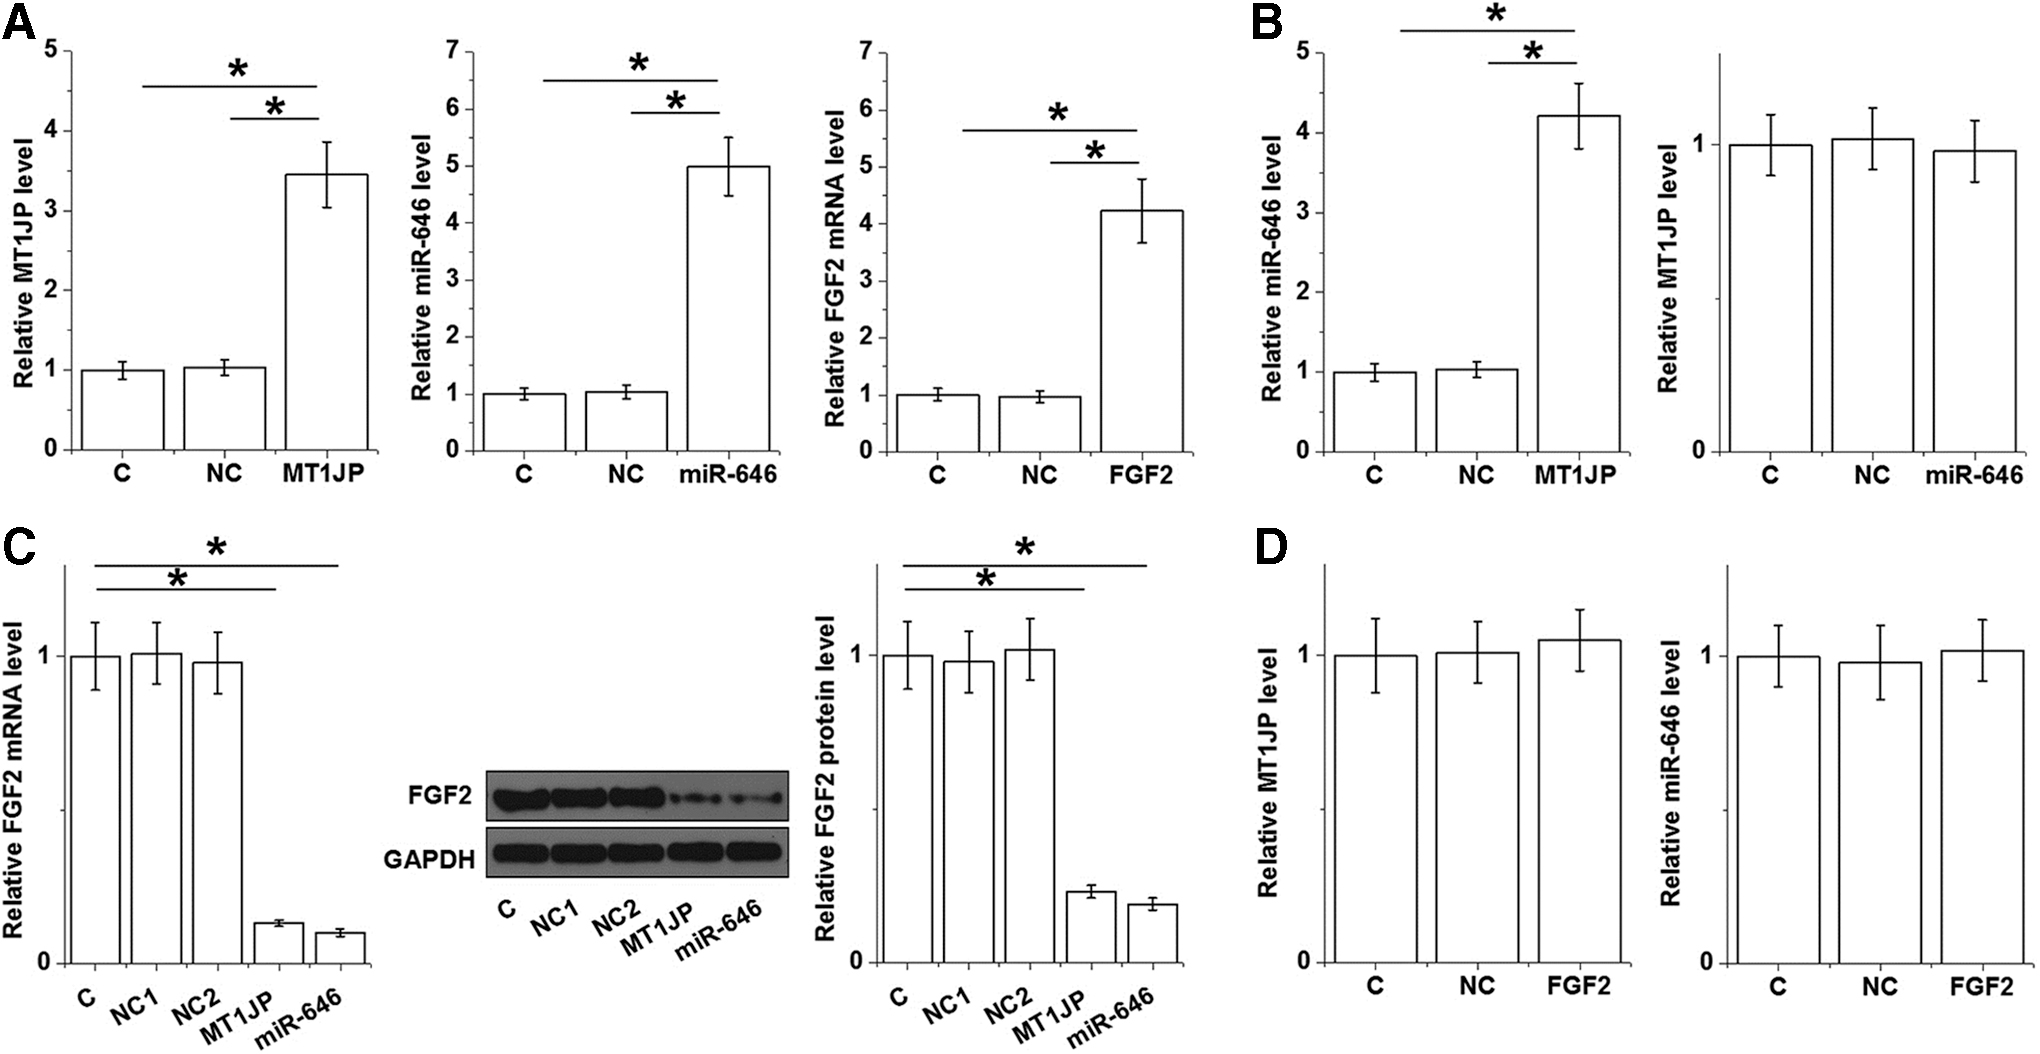
MT1JP upregulated miR-646 and downregulated FGF2. RT-qPCR revealed that the expression levels of MT1JP, miR-646, and FGF2 were significantly increased by comparison with NC and C controls at 24 h after transfections
MT1JP and miR-646 inhibited U2OS cell invasion and migration through FGF2
Transwell invasion and migration assay data were normalized by setting the value of the Control (C) group to “100.” All other groups were normalized to C group. Transwell invasion and migration assay data show that MT1JP and miR-646 inhibit invasion (Fig. 5A) and migration (Fig. 5B) of OS cells (p < 0.05) compared to NC and C groups. FGF2 overexpression plays the opposite role and attenuates the effects of MT1JP and miR-646 overexpression.
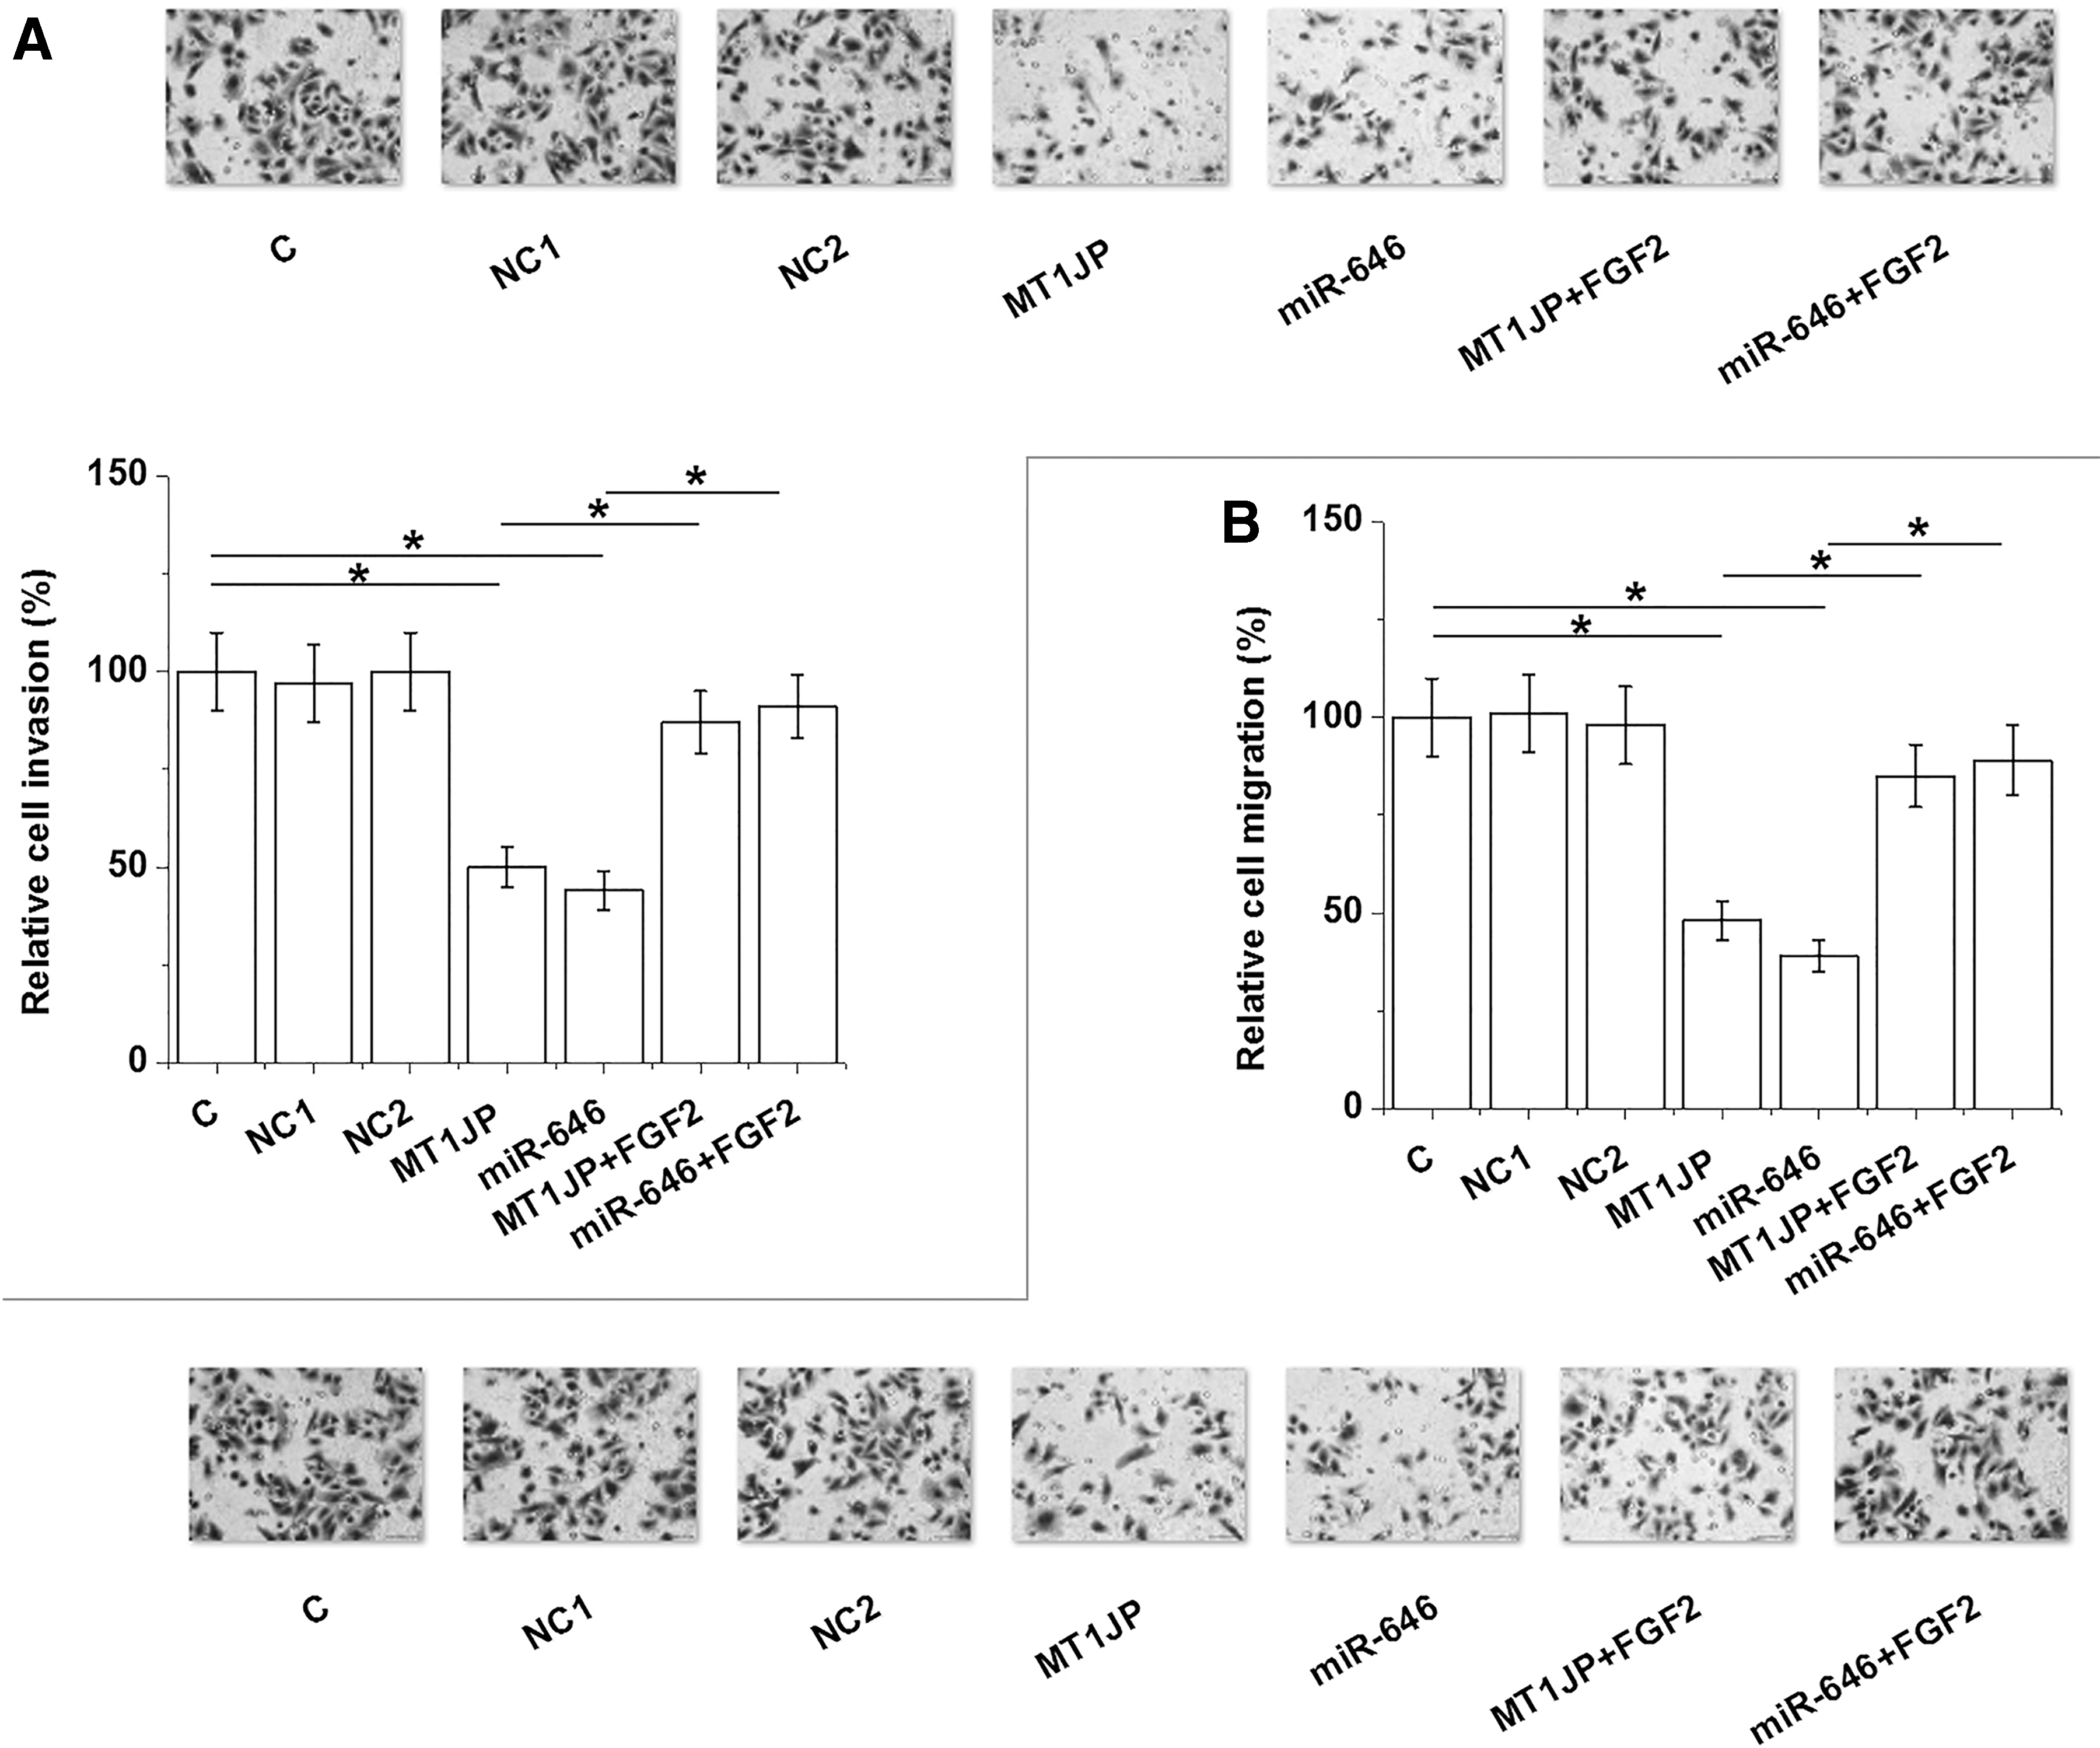
MT1JP and miR-646 inhibited U2OS cell invasion and migration through FGF2. Transwell invasion and migration assay data were analyzed by performing analysis of variance (one-way) and Tukey's test. It was observed that MT1JP and miR-646 significantly inhibited invasion
Discussion
This study investigated the role and clinical values of MT1JP in OS. The authors showed that MT1JP was downregulated in OS, and MT1JP overexpression inhibited the invasion and migration of OS cell by downregulating FGF2 through the upregulation of miR-646, which could directly target FGF2. 15
Treatment outcomes of OS patients are significantly affected by clinical stages, and OS patients with the advanced stage are more unlikely to be cured by the currently available treatment approaches. 17 Therefore, early diagnosis is critical. Circulating biomarkers of OS have attracted more and more attentions due to their noninvasive nature. 18 MT1JP is downregulated in many types of cancers and plays tumor-suppressive functions. 11,12 Liu and colleagues reported that MT1JP was downregulated in liver, colon, lung, and gastric cancer. 11 In these cancers, MT1JP modulated p53 pathway through the interactions with TIAR. 11 In another study, Xu et al. showed that MT1JP regulated MT1JP/miR-214-3p/RUNX3 Axis to suppress the proliferation and migration of gastric cancer cells. 12 In the present study, the authors first reported the downregulation of MT1JP in OS. In addition, MT1JP was detected in the plasma of both OS patients and healthy controls. Meanwhile, the reduced plasma level of MT1JP distinguished early-stage OS patients from healthy controls. Therefore, MT1JP in plasma may be used in clinical practices to assist the early diagnosis of OS. However, its specificity and sensitivity remain to be further tested.
miR-646 plays tumor-suppressive roles in many cancers, such as lung cancer and gastric cancer. 14,19 miR-646 inhibits cancer development and progression mainly by downregulating oncogenes, such as FOXK1 and EGFR. 14,19 In a recent study, miR-646 was found to downregulate fibroblast growth factor 2 or FGF2 to inhibit the metastasis of OS. 15 Consistently, their study also observed that the downregulation of FGF2 reduced migration and invasion rates of OS cells after miR-646 overexpression. Interestingly, their study showed that MT1JP was likely an upstream positive regulator of miR-646 in OS cells. MT1JP and miR-646 are known to have crosstalk with p53 signaling. 11,13 Therefore, p53 may mediate the interaction between MT1JP and miR-646. It is worth noting that in a recent study miR-646 was reported to regulate OS cell proliferation. 15 However, the preliminary data revealed no significant effects of MT1JP on cell proliferation. This is possibly caused by the different cell lines used. Another possibility is that MT1JP may interact with multiple factors to reach a fine regulation of the different behaviors of OS cells.
This study only included one cell line. Future studies may consist of more OS cell lines to further validate the authors' conclusions. This study is also limited by the small sample size. More clinical studies are needed to further analyze the potentials of plasma circulating MT1JP in the early diagnosis of OS. In addition, they also failed to analyze the prognostic value of MT1JP for OS. The prognostic values of this lncRNA for OS should be investigated by future studies through follow-up.
Conclusions
In conclusion, MT1JP was downregulated in OS and the downregulation of plasma circulating MT1JP may serve as an early diagnostic biomarker for OS. The overexpression of MT1JP may downregulate FGF2 by upregulating miR-646 to inhibit the invasion and migration of OS cells. Therefore, MT1JP is a potential early diagnostic marker and therapeutic target for OS.
Ethical Approval and Consent to Participate
Ethical approval was obtained from the Ethics Committee of Shouguang Hospital of Traditional Chinese Medicine. All patients understood the aims of specimen collection and signed written form informed consent.
Authors' Contributions
L.Y. and G.L.: experiments work, data analysis, and major contributors in writing the article. L.W., X.L., Q.T., and Z.L.: experimental work and clinical research. S.X.: research design, literature research, and article editing. All authors read and approved the final article.
Footnotes
Disclosure Statement
There are no existing financial conflicts.
Funding Information
No funding was received for this article.
Supplementary Material
Supplementary Figure S1
References
Supplementary Material
Please find the following supplemental material available below.
For Open Access articles published under a Creative Commons License, all supplemental material carries the same license as the article it is associated with.
For non-Open Access articles published, all supplemental material carries a non-exclusive license, and permission requests for re-use of supplemental material or any part of supplemental material shall be sent directly to the copyright owner as specified in the copyright notice associated with the article.