




Abstract
Background:
The objective of this study was to identify key molecules that included long noncoding RNAs (lncRNAs), microRNAs (miRNAs), and mRNAs involved in esophageal cancer with KH-type splicing regulatory protein (KHSRP) knockdown.
Materials and Methods:
GSE99422 and GSE99423 from Gene Expression Omnibus database were extracted. After differentially expressed analysis of miRNAs, lncRNAs, and mRNAs, the lncRNAs–mRNAs interaction was obtained. Then the protein–protein interaction (PPI) network and module analyses were performed for differentially expressed mRNAs (DEmRNAs). Combined with miRWalk tool and DIANA-LncBase tool, regulating relationship between differentially expressed miRNAs (DEmiRNAs) and DEmRNAs/DElncRNAs were predicted. Finally, mRNA-miRNA-lncRNA regulatory network construction was established by Cytoscape software. Finally, the key genes were validated based on the Gene Expression Profiling Interactive Analysis
Results:
Totally, 2,027 DEmiRNAs, 3,480 DElncRNAs, and 18,293 DEmRNAs were screened. The PPI network included 399 nodes and 1671 interaction pairs, and two function models (Cluster 1 and Cluster 2) were separately identified. The PLK1 was a hub in the Cluster 1, which mainly enriched in the function of nuclear division. Then the competing endogenous RNA (ceRNA) network was constructed with 20 miRNAs, 66 lncRNA, and 202 mRNA. Here, lncRNA RP11–159D12.2 might function as a ceRNA in regulating BIRC5 expression of esophagus cancer through competitively binding to hsa-miR-4430. BIRC5 was mainly enriched in the function of mitotic nuclear division. Besides, the expression of BIRC5 and PLK1 genes was upregulated in tumor tissues compared with normal controls. Also, the correlation analysis showed that the key genes (BIRC5 and PLK1) were validated to be positively correlated with KHSRP.
Conclusions:
PLK1, BIRC5, hsa-miR-4430, and lncRNA RP11–159D12.2 were likely to be associated with esophageal cancer development.
Introduction
Esophageal cancer is a common malignant gastrointestinal tumor with a typical high incidence, poor prognosis, and high mortality, and its clinical symptoms include pain in the posterior sternum and progressive dyspnea. 1,2 From the perspective of the prevalence of this malignant tumor, the incidence of esophageal cancer in China is relatively high on a global scale. Up to now, about 150,000 people die of esophageal cancer every year in China. 3 Esophageal cancer has no typical symptoms in the early stage, and the disease progresses slowly, therefore, early esophageal cancer is more difficult to diagnose. However, when esophageal cancer progresses to the middle and late stage, it is difficult to treat and easy to combine with poor prognosis. 4 At present, esophageal cancer patients are mainly treated by surgery, radiotherapy, and chemotherapy, with poor efficacy and high mortality. 5,6
Several studies have investigated the possible molecular mechanisms of esophageal cancer initiation and development to identify novel therapeutic targets for esophageal cancer. Notably, noncoding RNA transcripts such as microRNAs (miRNAs) and long noncoding RNAs (lncRNAs) have been reported to play significant roles in the molecular mechanism of cancers. According to the competing endogenous RNA (ceRNA) hypothesis, different RNA transcripts participate in pathological processes mainly through competing for the binding sites of shared miRNAs. Zheng et al. 7 suggested that miRNA-200c enhances radiosensitivity of esophageal cancer by cell cycle arrest and targeting P21. Xu et al. 8 found that miRNA-186-5p inhibits proliferation and metastasis of esophageal cancer by mediating HOXA9. Xu et al. 9 showed that lncRNA SNHG7 promotes the proliferation of esophageal cancer cells and inhibits its apoptosis, and can be used as a marker of esophageal cancer. A recent study showed that downregulated lncRNA UCA1 acts as ceRNA to adsorb miRNA-498 to repress proliferation, invasion, and epithelial mesenchymal transition of esophageal cancer cells by decreasing ZEB2 expression. 10
GSE99422 and GSE99423 were analyzed by Fujita et al., and they showed that the KH-type splicing regulatory protein (KHSRP) played a oncogenic function in esophageal squamous cell carcinoma (ESCC). 11 However, the molecular mechanisms underlying the development of esophageal cancer have not yet been understood. In this study, a microarray dataset of esophageal cancer was downloaded from a public database. The authors performed a differentially expressed analysis of miRNAs, lncRNAs, and mRNAs between KHSRP knockdown tumor group and control group, and then the protein–protein interaction (PPI) network and module analyses were conducted for differentially expressed mRNAs (DEmRNAs). According to the lncRNA–mRNA, mRNA–miRNA, and lncRNA–miRNA interaction pairs, the ceRNA network was constructed for functional enrichment analysis. In this study, they provide an insight into the role of KHSRP in esophageal cancer and identify novel RNAs related to KHSRP.
Materials and Methods
Data sources
Microarray dataset GSE99422 (Species: Homo sapiens) [mRNA + lncRNA expression data platform: GPL14550 Agilent-028004 SurePrint G3 Human GE 8x60K Microarray (probe name version)] from Gene Expression Omnibus (GEO) database 12 was downloaded, which included 8 samples (4 KHSRP knockdown [KYSE850_KHSRP_KD] and 4 KYSE850_control). The cell line was KYSE850 and the cell type was ESCC cell line. From GEO database, 12 the microarray dataset GSE99423 (Species: Homo sapiens) (miRNA expression data platform: GPL18402 Agilent-046064 Unrestricted_Human_miRNA_V19.0_Microarray miRNA ID version]) was downloaded, which included 4 samples (2 KKYSE850_KHSRP_KD and 2 KYSE850_control). The cell line was KYSE850 and the cell type was ESCC cell line.
Data preprocessing
The original data were preprocessed through limma 13 from R package. The processes of data preprocessing included background adjustment, quantile normalization, normalization, and log base 2 scale. 14,15 The gene expression value was calculated by mapping probes to symbols utilizing the GENCODE dataset, 16 and the average value was deemed as the value of gene expression when multiple probes matched to gene symbol.
Identification of DEmRNAs, lncRNAs, and miRNAs
The DEmRNAs, differentially expressed miRNAs (DEmiRNAs), and DElncRNAs between KHSRP knockdown tumor group and control group were analyzed using the empirical Bayes method and linear regression provided from R package limma. The DEmRNAs, DEmiRNAs, and DElncRNAs were screened with the screening criteria set as p < 0.05, |log2 (fold-change [FC])| >0.585. Finally, the heat map was drawn to observe the clustering of samples, and a volcano plot was drawn to show the difference.
Prediction of lncRNA–mRNA interaction pairs
Based on the expression data and the Pearson correlation coefficient method, the correlation relationship between DElncRNAs and DEmRNAs was calculated. The correlation test was conducted to obtain the lncRNA–mRNA interaction pairs with the threshold value of |r| > 0.98 and p < 0.05. Based on the lncRNA–mRNA interaction pairs, the Kyoto Encyclopedia of Genes and Genomes (KEGG) pathway analysis was performed with R package clusterProfiler (Version: 3.14.0,
PPI network analysis of DEmRNAs
The Search Tool for the Retrieval of Interacting Genes (STRING)
17
database was carried out to analyze the interactions between protein and protein encoded by DEmRNAs. Cytoscape software
18
was used to construct the PPI network. Besides, significant network modules were analyzed by Molecular Complex Detection (MCODE) plugin (Version: 1.5.1,
Prediction of miRNA–mRNA interaction pairs
The DEmRNAs of the DEmiRNAs were predicted with the miRWalk tool, 20 and the miRNA–mRNA interaction pairs were validated through miRDB release, 21 miRTarBase release, 22 and TargetScan release. 23
Prediction of lncRNA–miRNA interaction pairs
The DIANA-LncBase tool 24 was conducted to search the DElncRNAs of miRNA, and then the lncRNA–miRNA interaction pairs were obtained with the score >0.7.
Construction of ceRNA network
The interaction pairs of lncRNA–mRNA, miRNA– mRNA, and lncRNA–miRNA were integrated to construct the ceRNA network. Besides, the GO-biological processes (BP) enrichment analysis for the mRNA in the ceRNA network was carried out.
Validation analysis
Gene Expression Profiling Interactive Analysis (GEPIA) database (
Results
Identification of DEmRNAs, lncRNAs, and miRNAs
A total of 2,027 DEmiRNAs, 3,480 DElncRNAs, and 18,293 DEmRNAs were identified. According to the screening criteria of p < 0.05 and |log2 (FC)| >0.585, there were 21 DEmiRNAs (including 6 upregulated and 15 downregulated), 117 DElncRNAs (including 68 upregulated and 49 downregulated), and 1,094 DEmRNAs (including 441 upregulated and 653 downregulated) in KHSRP knockdown tumor group compared with control group. The heatmap and volcano plot of the DEmRNAs, DElncRNAs, and DEmiRNAs are shown in Figure 1. The two groups of samples can be significantly separated, indicating that the difference analysis results were reliable.
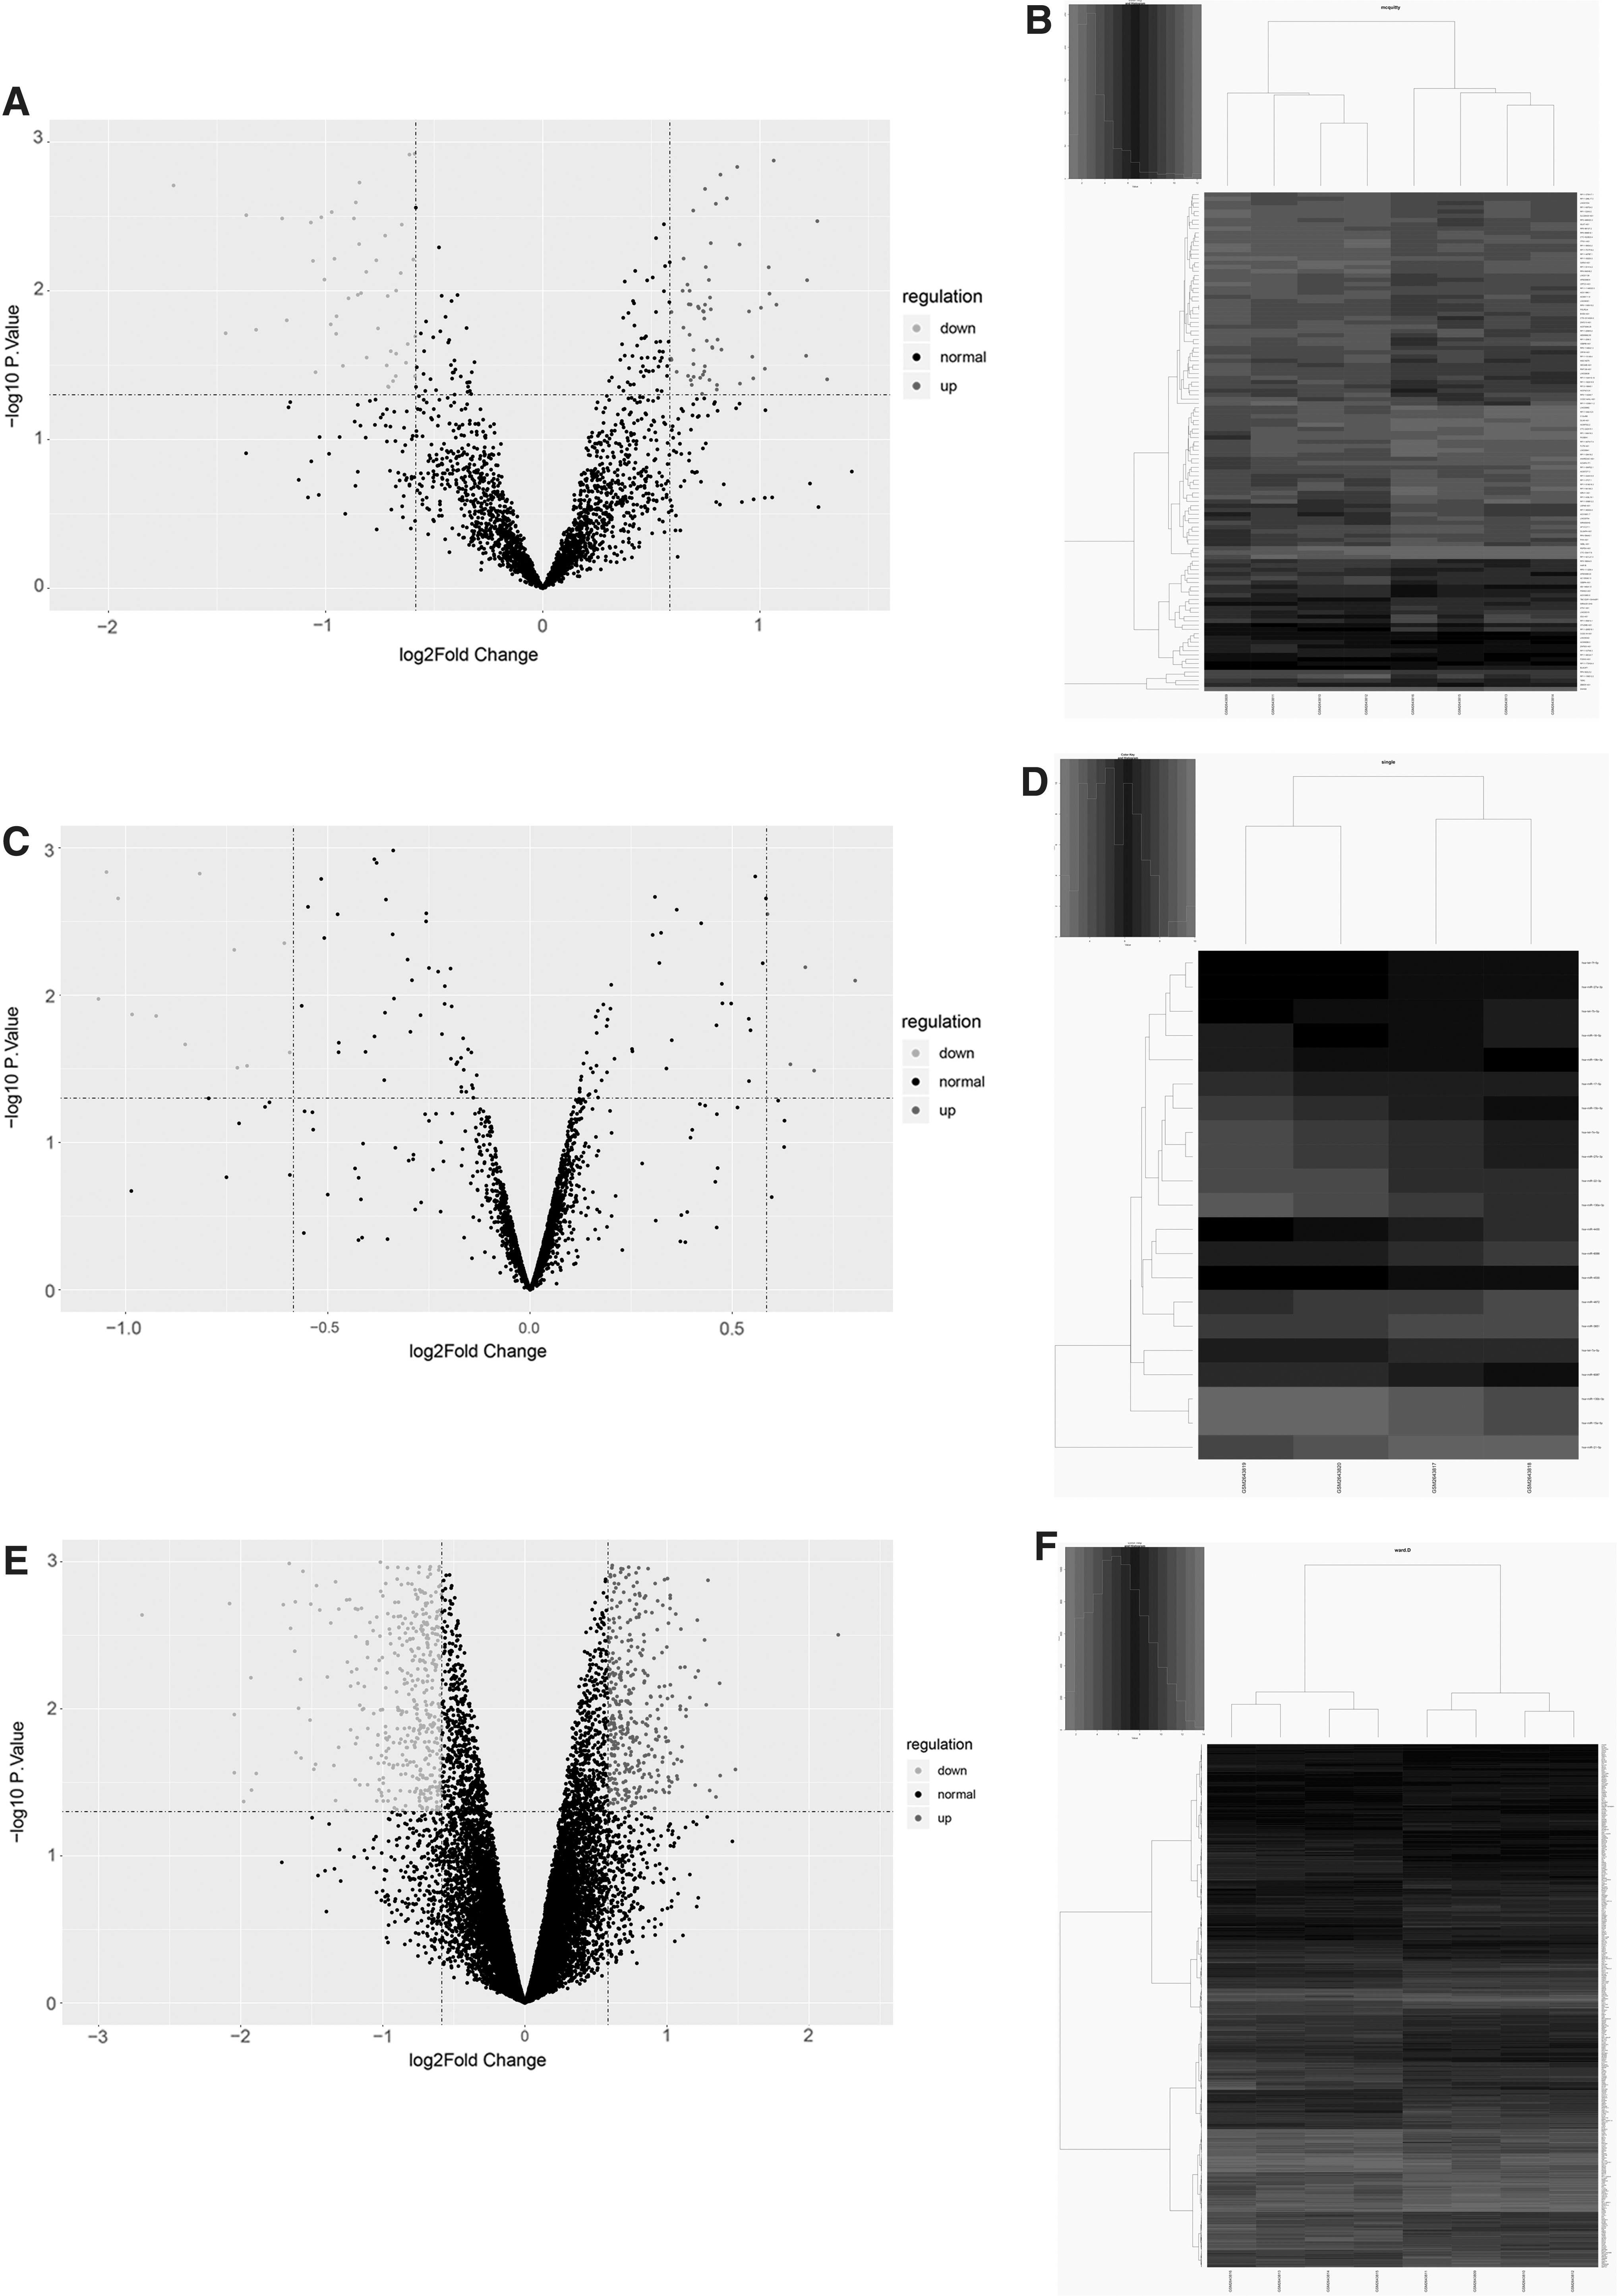
Identification of DEmRNAs, lncRNAs, and miRNAs.
Prediction of lncRNA-mRNA interaction pairs
A set of 171 lncRNA–mRNA interaction pairs were obtained among 41 lncRNAs and 156 mRNAs. The KEGG pathway analysis of these mRNAs regulated by lncRNAs suggested that three pathways with the most enrichment included Protein export, Drug metabolism-other enzymes, and Glycosaminoglycan (Fig. 2).
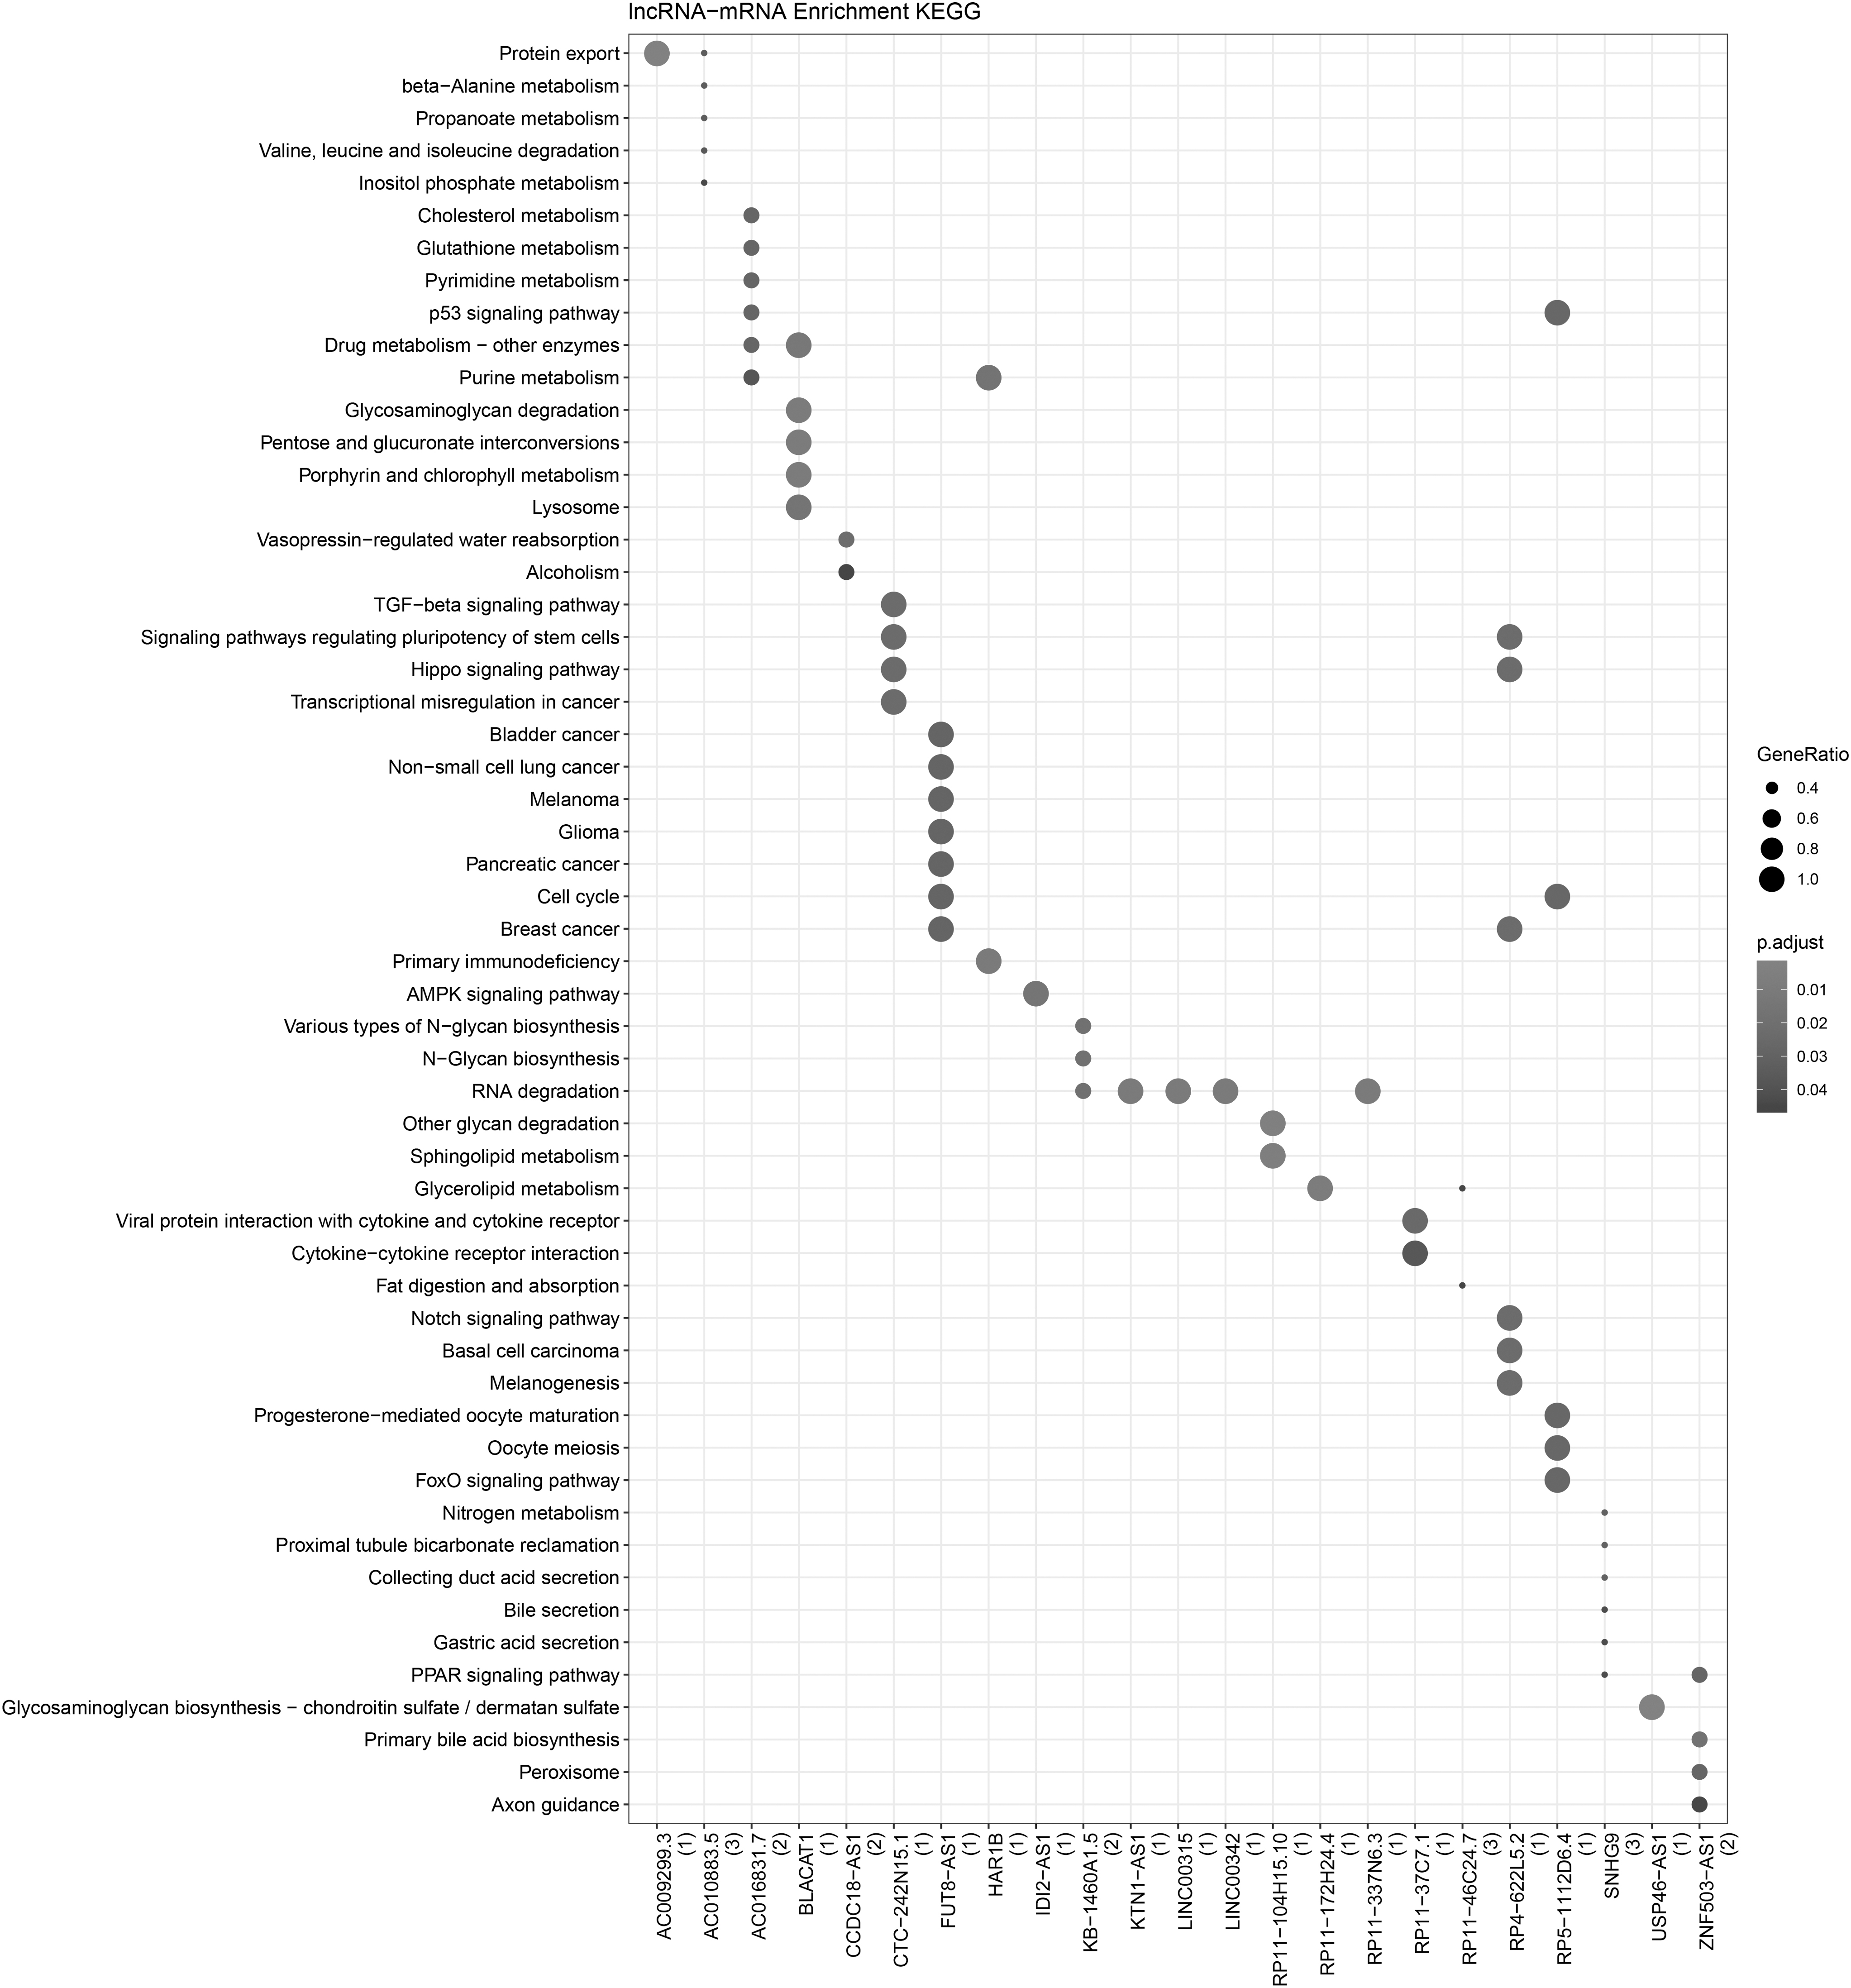
KEGG pathway analysis of mRNA regulated by lncRNAs. X-axis is lncRNA, and the number of mRNA regulated by lncRNA is shown in parentheses. Y-axis is the signaling pathway predicted by KEGG pathway analysis that may be regulated by the corresponding mRNA. The size of the ball represents the number of genes enriched in each term. The color of the ball represents the number of the p value. KEGG, Kyoto Encyclopedia of Genes and Genomes.
PPI network of DEmRNAs
A set of 399 nodes and 1,671 interaction pairs were identified in the PPI network. Moreover, two function models (Cluster 1: score 14.174 and Cluster 2: score 13.538) were separately identified with scores >10 from the PPI network. There were 24 downregulated genes in the Cluster 1, and the PLK1 was a hub in the Cluster 1 (Fig. 3A). There were 7 upregulated and 33 downregulated genes in Cluster 2 (Fig. 3B). Meanwhile, the GO-BP and KEGG pathway analyses were conducted for the mRNAs in Cluster 1 and Cluster 2, and the top 10 related BPs are shown in Figure 3C and D, and the KEGG analysis results are shown in Figure 3E and F, and the results showed that PLK1 was mainly enriched in the function of nuclear division.
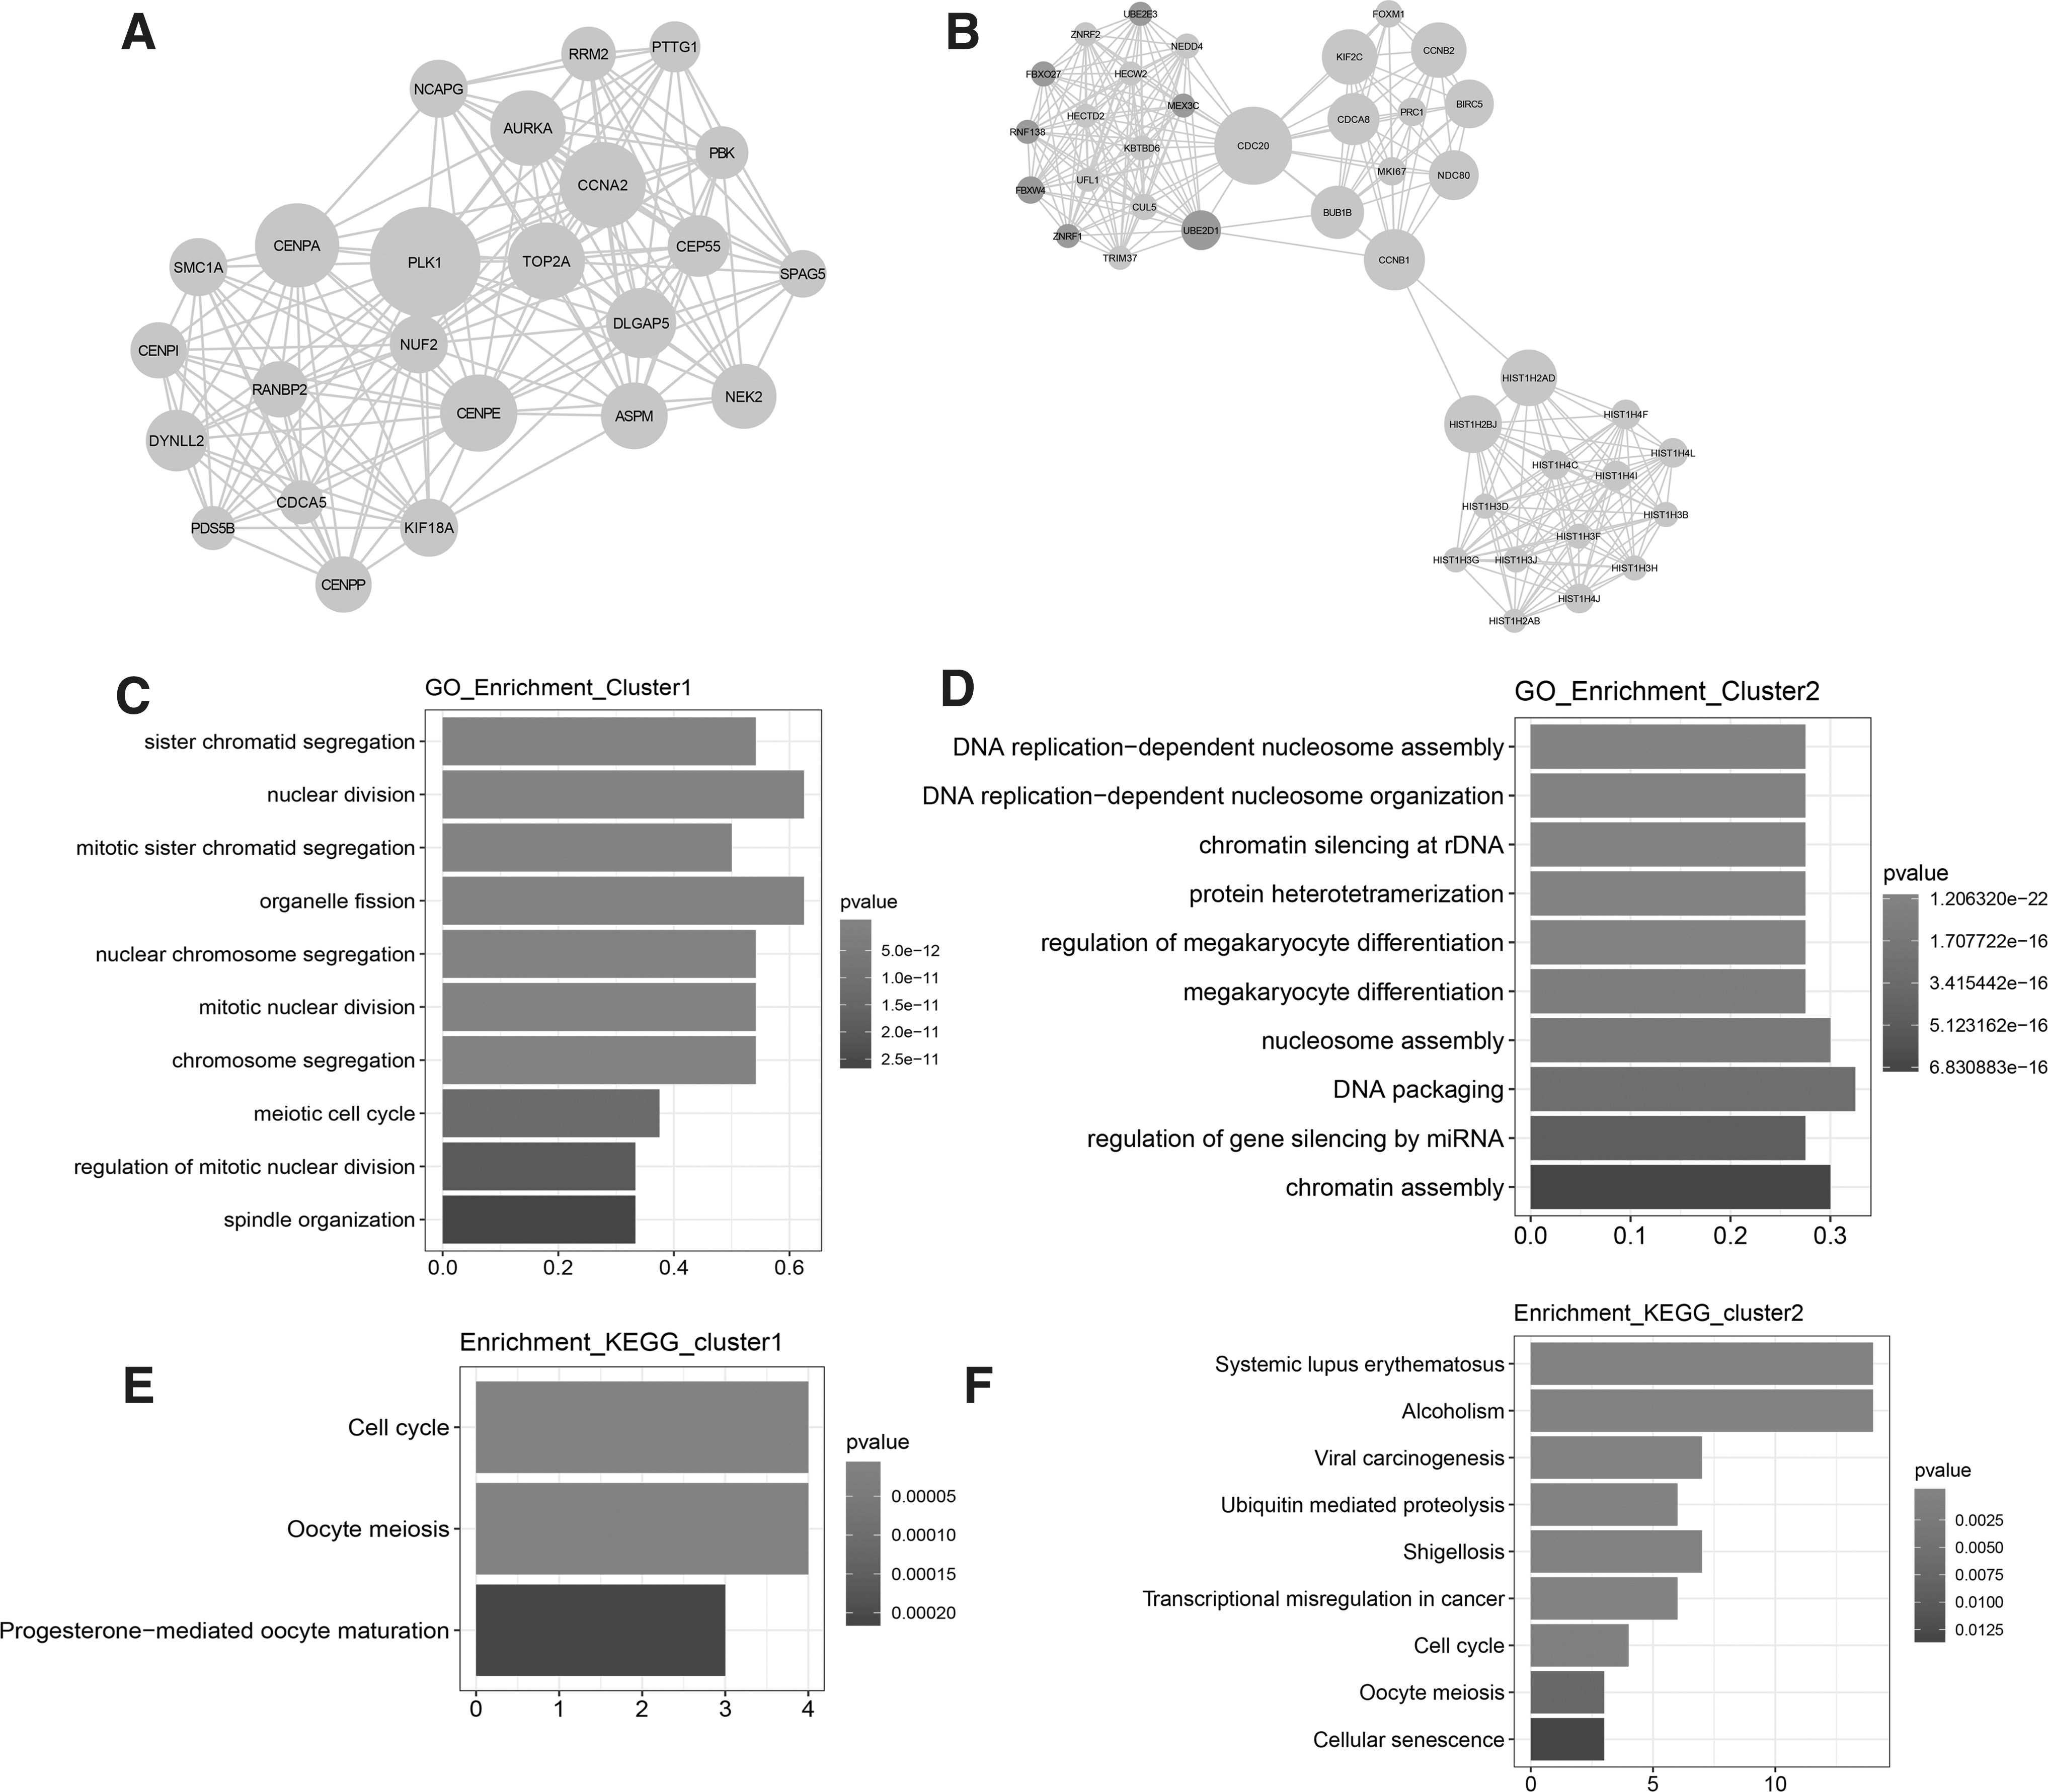
PPI network of DEmRNAs.
Prediction of miRNA–mRNA and lncRNA–miRNA interaction pairs
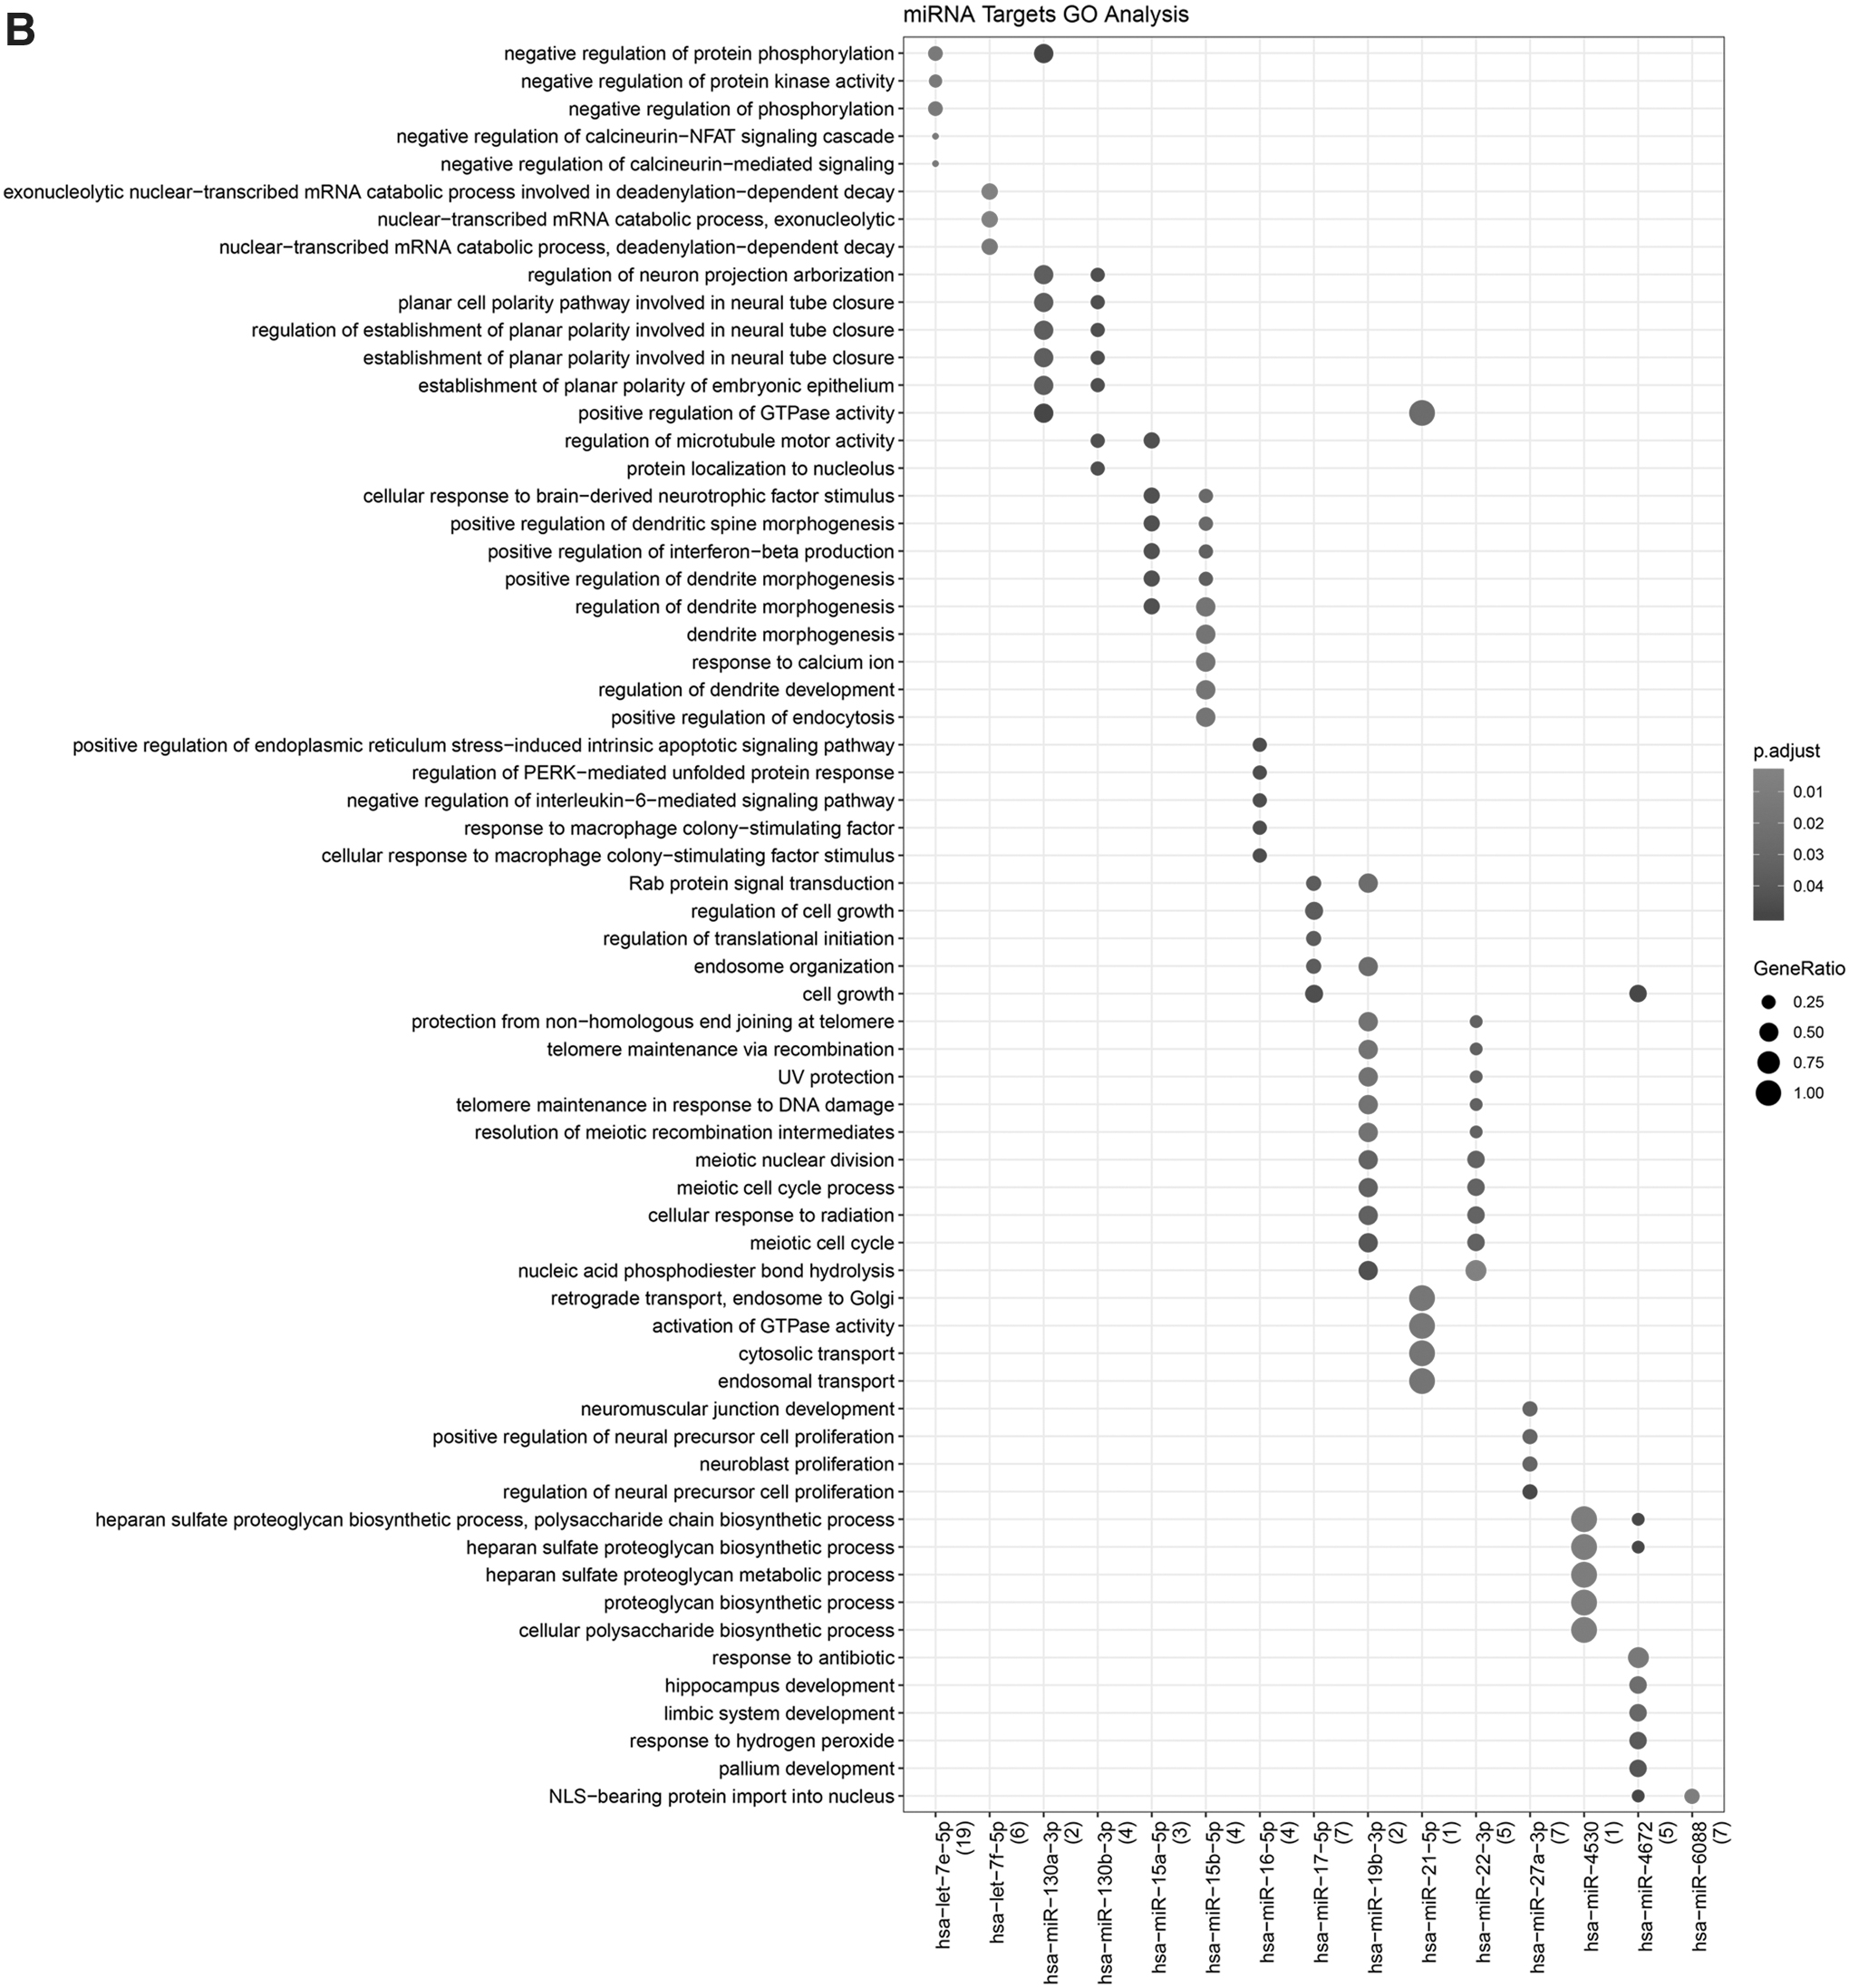
There were 174 miRNA–mRNA interaction pairs identified, including 20 DEmiRNAs and 103 DEmRNAs (Fig. 4A), and the GO-BP and KEGG pathway analyses of miRNA were conducted (Fig. 4B, C). The result showed that the miRNAs were enriched in the function of negative regulation of protein phosphorylation, negative regulation of protein kinase activity, and negative regulation of phosphorylation, and so on. Based on the DIANA-LncBase tool, total 128 lncRNA–miRNA interaction pairs were obtained (Supplementary Table S1).

Enrichment analysis of miRNA-target.

Construction of ceRNA network
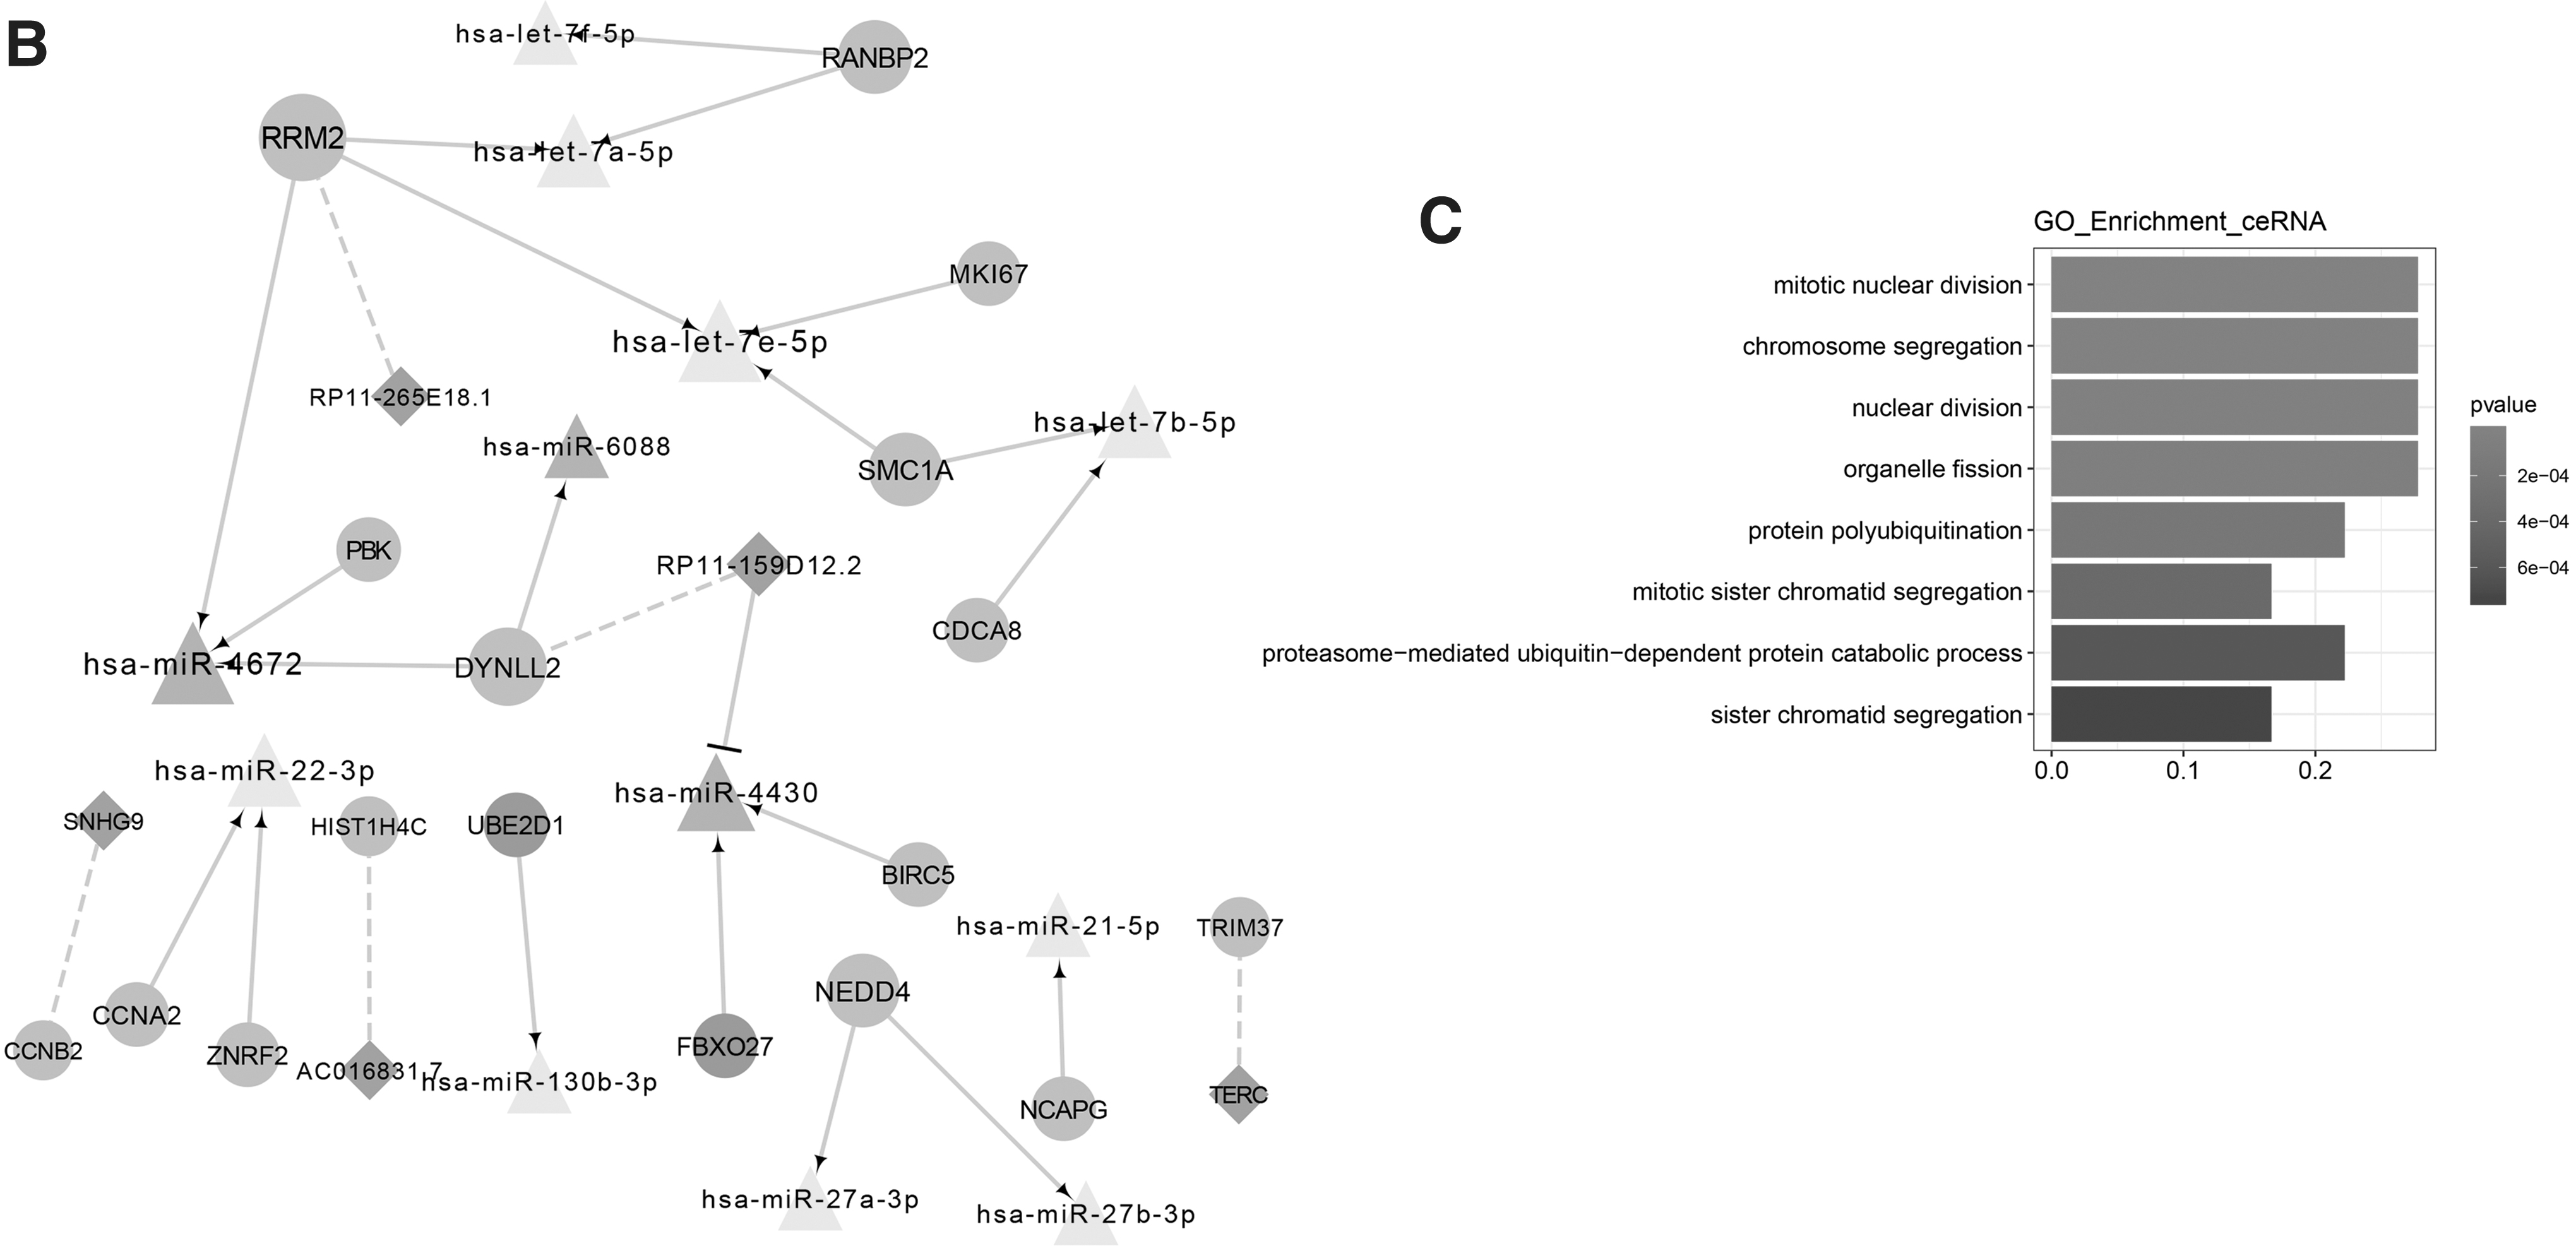
According to the interaction pairs of 171 lncRNA–mRNA, 174 mRNA–miRNA, and 128 lncRNA–miRNA, a ceRNA network was constructed with 20 miRNAs, 66 lncRNA, and 202 mRNA (Fig. 5A). The related miRNA and lncRNA in Cluster 1 and Cluster 2 were shown in the sub-ceRNA network among 17 mRNAs, 12 miRNAs, and five lncRNAs, including 20 miRNA–mRNA, five mRNA–lncRNA, and one miRNA–lncRNA (Fig. 5B). Here, lncRNA RP11–159D12.2 might function as a ceRNA in regulating baculoviral inhibitor of apoptosis repeat containing 5 (BIRC5) expression of esophagus cancer through competitively binding to hsa-miR-4430. Sub-ceRNA-mRNA was significantly enriched in 8 GO-BP (Fig. 5C and Supplementary Table S2), and the BIRC5 was enriched in the function of mitotic nuclear division.
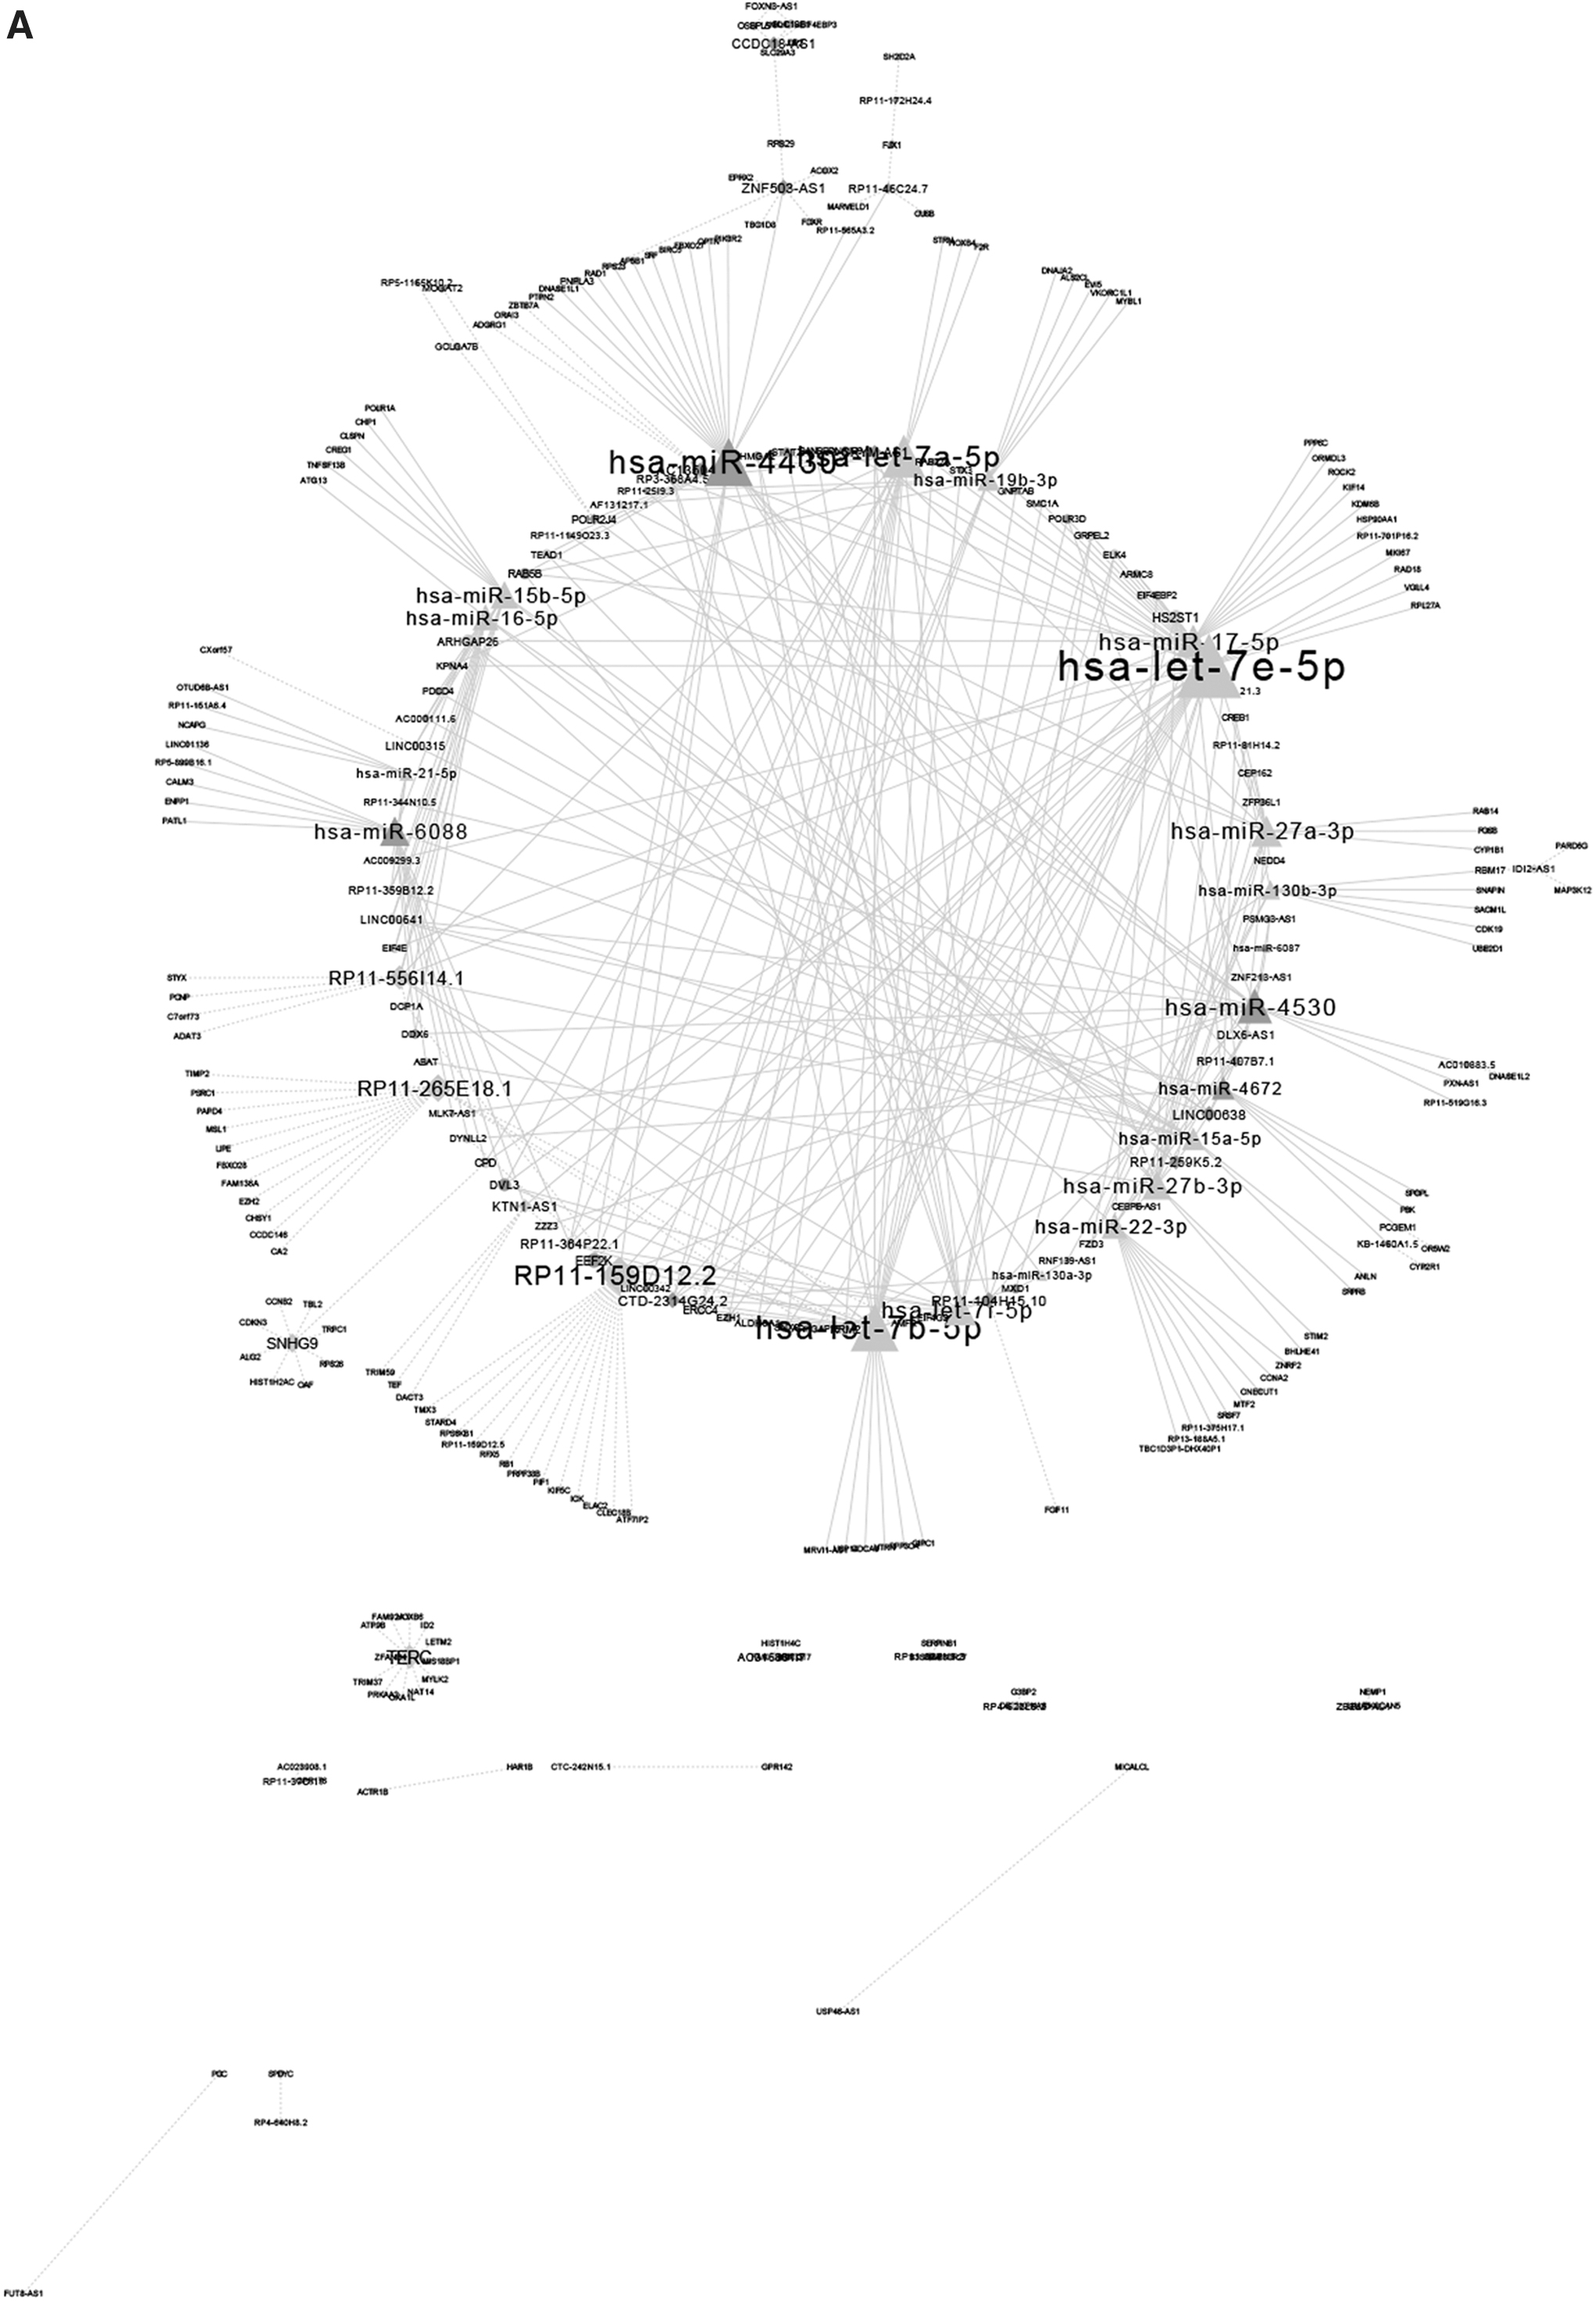
Construction of ceRNA network.
Expression validation of key genes in esophageal cancer
Next, for improving accuracy of analysis, TCGA esophageal cancer samples and GTEx normal data were introduced to validate expression levels of two key genes via GEPIA database. As shown in Figure 6A and B, the expression of BIRC5 and PLK1 genes was upregulated in tumor tissues compared with normal controls. Besides, the correlation analysis showed that the key genes (BIRC5 and PLK1) were validated to be positively correlated with KHSRP (Fig. 6C and D).
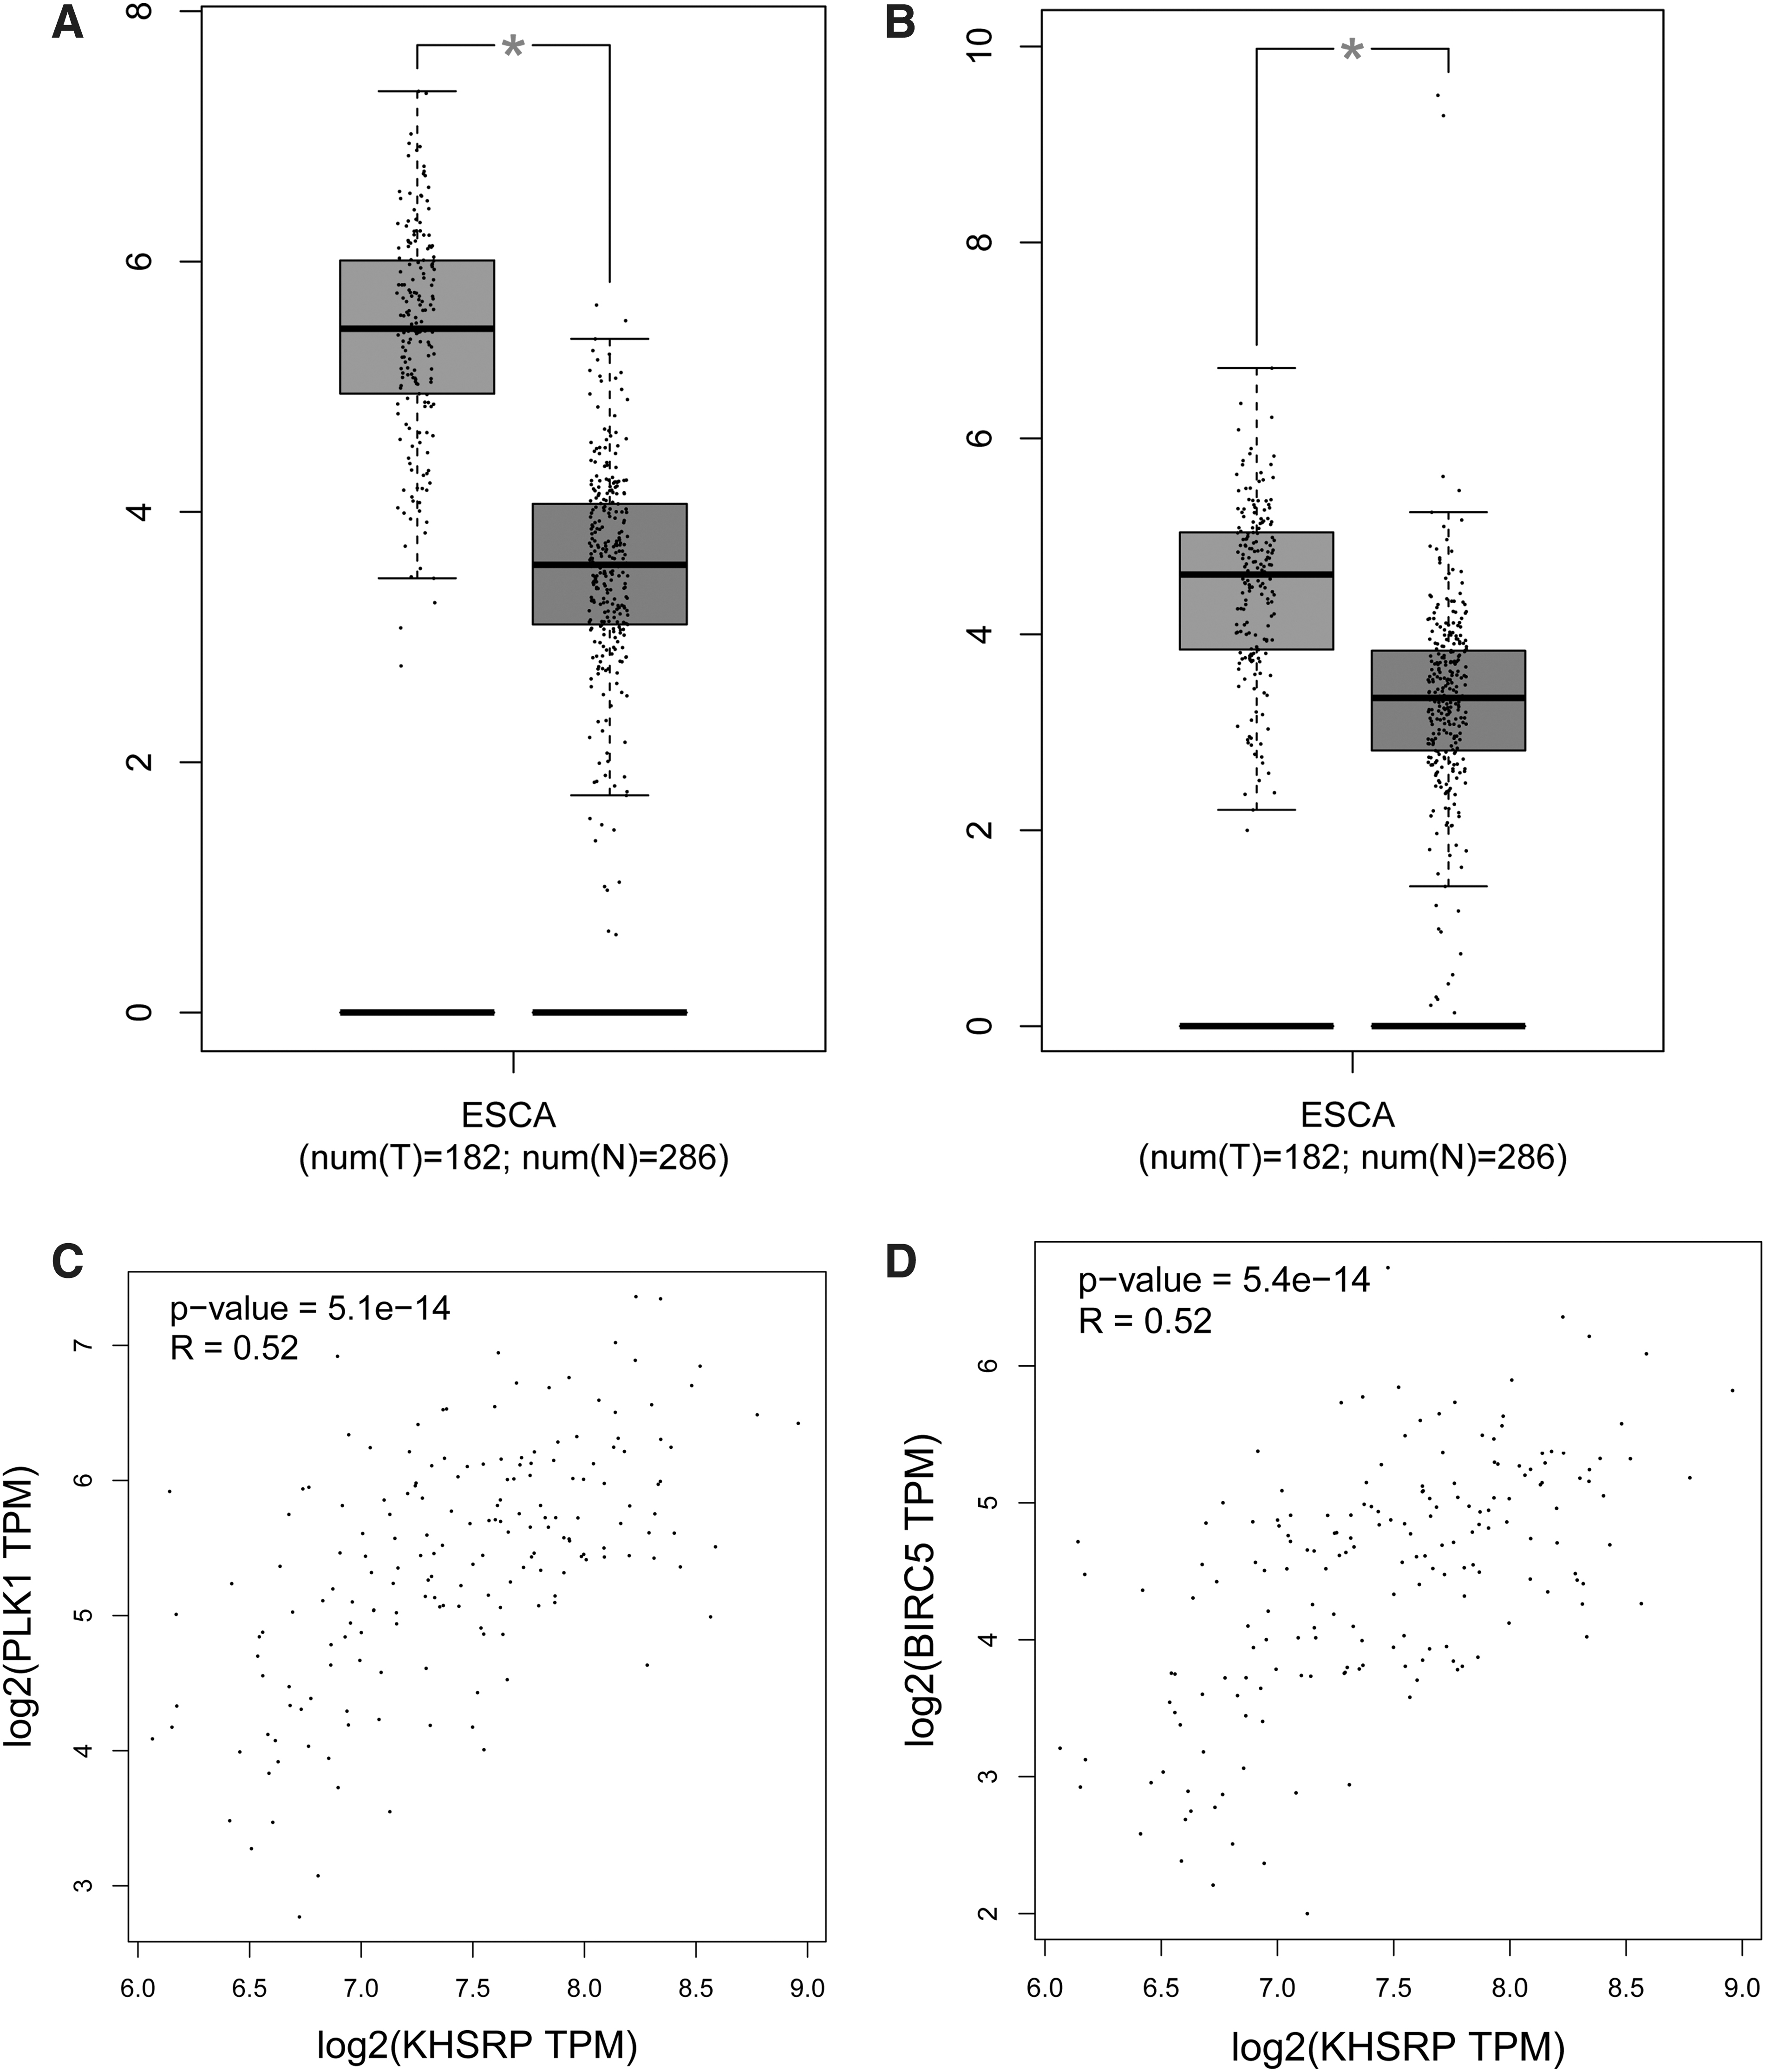
Expression validation of key genes in esophageal cancer.
Discussion
The occurrence of esophageal cancer will affect the patient's normal eating and the quality of life, and will produce many complications, such as cachexia, hematemesis, recurrent laryngeal nerve paralysis, aspiration pneumonia, and so on. In the authors' study, a total of 21 DEmiRNAs, 117 DElncRNAs, and 1,094 DEmRNAs were identified in KHSRP knockdown tumor group compared with normal group. A set of 171 lncRNA–mRNA interaction pairs were obtained among 41 lncRNAs and 156 mRNAs. Two function models were obtained in the DEmRNAs PPI network. There were 24 downregulated genes in the Cluster 1, and the PLK1 was a hub and mainly enriched in the function of nuclear division. There were 7 upregulated and 33 downregulated genes in Cluster 2. Meanwhile, lncRNA RP11–159D12.2 was predicted to be involved in the ceRNA network of BIRC5 and hsa-miR-4430, and the BIRC5 was enriched in the function of mitotic nuclear division. Besides, the expression of BIRC5 and PLK1 genes was upregulated in tumor tissues compared with normal controls. Also, the correlation analysis showed that the key genes (BIRC5 and PLK1) were validated to be positively correlated with KHSRP.
PLK1 has been reported to be upregulated in many cancer cells, and it has been reported that PLK1 is in close connection with esophageal cancer. For instance, Li et al. 25 detected the expression level of miR-210 in ESCC patients and confirmed the induction of miR-210 in hypoxic ESCC cells, and the results explained that miR-210 inhibited the proliferation of ESCC cells by inducing G2/M phase cell cycle arrest, and these effects of miR-210 were mediated by the targeting of PLK1. Ito et al. 26 showed that PLK1 regulates cell proliferation and was targeted by miR-593* in esophageal cancer. Interestingly, a report suggested that reciprocal activation between PLK1 and Stat3 promote esophageal cancer cells survival and proliferation. 27 In addition, Bu et al. 28 found that silencing of PLK1 via siRNA causes inhibition of growth and induction of apoptosis in human esophageal cancer cells. Herein, the PPI network of DEmRNAs showed that PLK1 was a hub in Cluster 1. Also, the expression of PLK1 gene was upregulated in tumor tissues compared with normal controls. Taken together, the authors' results suggest that PLK1 is likely associated with esophageal cancer with KHSRP knockdown occurrence and progression. In addition, their GO enrichment analysis of Cluster 1 showed that PLK1 was mainly enriched in the function of nuclear division. Perencevich 29 suggested that aberrant nuclear division configurations occurring in the bone marrow of cancer patients further imply that PLK1 was likely related to the progression of esophageal cancer with KHSRP knockdown via regulating nuclear division function.
BIRC5, a mitotic spindle checkpoint gene, plays a key role in the occurrence and development of most malignant tumors. For instance, Ghaffari et al. 30 indicated that BIRC5 gene has the potential to be a marker for the early detection and prognosis of breast cancer. Shang et al. 31 investigated the expression of BIRC5 in patients with different stages of esophageal squamous cell cancer, and the results found that downregulation of BIRC5 inhibits the migration and invasion of esophageal cancer cells by interacting with the PI3K/Akt signaling pathway. These findings pointed that BIRC5 is related to esophageal cancer development. Currently, several miRNAs have been illustrated to be associated with esophageal cancer, such as hsa-miR-720 and hsa-miR-6743-5p. 32,33 Tanman et al. 34 uncovered that miRNA hsa-miR-4430 might play a key regulatory role in the occurrence and development of breast cancer and might be a prognostic marker for breast cancer patients. Nevertheless, the role of hsa-miR-4430 in esophageal cancer development has not been explored. In their study, BIRC5 was downregulated in KHSRP knockdown esophageal cancer samples and interacted with hsa-miR-4430, and the validation analysis showed that the expression of BIRC5 gene was upregulated in cancer tissues compared with normal controls. In addition, hsa-miR-4430 was found to be interacted with lncRNA RP11–159D12.2. In particular, lncRNA RP11–159D12.2 was also downregulated in KHSRP knockdown esophageal cancer samples and interacted with BIRC5. Moreover, BIRC5 was enriched in the function of mitotic nuclear division. It has been suggested that mitotic nuclear division has a significant role in the pathophysiology of bladder cancer. 35 Therefore, the authors speculated that BIRC5 was likely to be related to the progression of esophageal cancer with KHSRP knockdown via regulating mitotic nuclear division function.
Although they explored the potential molecular mechanisms of esophageal cancer occurrence and development using a bioinformatics approach, there were still several limitations in this study. First, the sample size involved in this study is relatively small. In addition, relevant experiments, including cell biology assays, and animal and clinical studies need to be performed to verify the multiple candidate targets and signaling pathways identified from the authors' bioinformatics analyses.
Conclusion
In conclusion, PLK1, BIRC5, hsa-miR-4430, and lncRNA RP11–159D12.2 might have participated in the development of esophagus cancer. These molecular markers might be used as the therapeutic target for esophagus cancer. The results of the present study may provide a theoretical basis for further studies on the mechanisms of KHSRP in the development of esophagus cancer.
Footnotes
Disclosure Statement
There are no existing financial conflicts.
Funding Information
No funding was received for this article.
Supplementary Material
Supplementary Table S1
Supplementary Table S2
References
Supplementary Material
Please find the following supplemental material available below.
For Open Access articles published under a Creative Commons License, all supplemental material carries the same license as the article it is associated with.
For non-Open Access articles published, all supplemental material carries a non-exclusive license, and permission requests for re-use of supplemental material or any part of supplemental material shall be sent directly to the copyright owner as specified in the copyright notice associated with the article.
